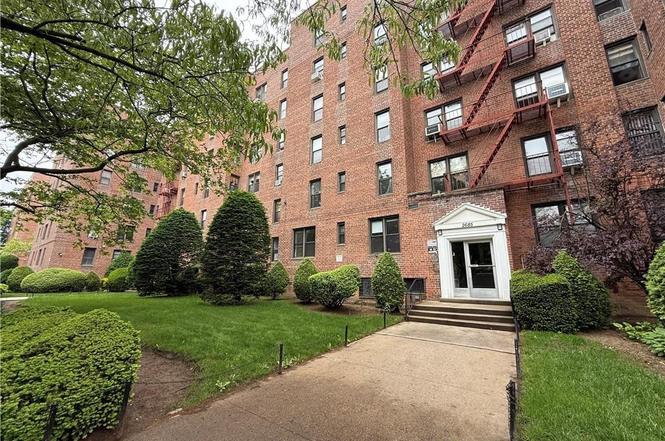
2685 E 7th St Unit 6M · New York, NY
Flood risk 8/10 · Major
- FEMA flood zone
- X (shaded)
- Chance of flooding over 30 yrs
- 0.78%
- Est. flood insurance / yr
- $507 – $1,088
Fire risk 1/10 · Minimal
- Est. fire insurance / yr
- $691 – $1,283
Heat risk 7/10 · Major
- Hot days now (above 97°F)
- 7 days/yr
- Hot days in 30 yrs
- 15 days/yr
Wind risk 6/10 · Moderate
- Chance of severe wind over 30 yrs
- 72.0%
Air-quality risk 4/10 · Minor
- Unhealthy air days now
- 5 days/yr
- Unhealthy air days in 30 yrs
- 7 days/yr
Risk factors via First Street. Map © Google.
Why this score? — see what drove the C- grade
The composite is a weighted blend of 9 inputs, each scored 0–100. Each bar is that input's sub-score; the figure is the points it added to the 100-point composite (weight × sub-score).
- Cash flow +18.9/30.0
- ARV discount +7.5/15.0
- DSCR +5.9/10.0
- 1% rule +5.0/10.0
- Schools +5.0/10.0
- Rent growth +3.8/5.0
- Livability +3.8/5.0
- Condition / age +2.5/5.0
- Appreciation +0.0/10.0
$369,000
🖨 Deal sheet 📄 Offer letter ✓ Due diligence
Listing remarks MLS
Prime Location! Beautiful 2 bedroom coop, almost 1000sf, lots of closets, new kitchen, bath, bright and sunny, parquet floors. Near to everything.
Key facts
- Fully tiled bathroom
- Private backyard
- New laundry
Tags
Property features AI
Finance
- Other: Pets are not allowed; Handicap access available; Co-op shares associated with unit
- Financial info: Flip tax applies; Financing available: Bank mortgage
- HOA & community: Monthly maintenance/ common fee; Managed by Metro Mgmnt (manager phone available)
Exterior
- Parking: Parking wait-list
- Security: Secure lobby
- Utilities: All utilities
- Home design: Residential building; Unit on the 6th floor
- Exterior features: Floor 6 location; Building has 84 units
Interior
- Kitchen: Dishwasher; Refrigerator; Stove
- Bedrooms: Two bedrooms on the first floor
- Bathrooms: One full bathroom on the first floor
- Heating & cooling: Window A/C units
- Interior features: Window A/C units (3); Elevator access; Laundry area; Secure lobby
- Laundry & utility: Card-operated laundry in building; In-unit laundry area
Neighborhood map
What this means for you Summary
Snapshot
- This is a 2-bed/1.0-bath condo listed at $369k.
Deal economics
- At list price, monthly cash flow is $310 ($4k/yr) — positive.
- The deal already cash-flows at list — no discount required.
- Meets the 1% rule at list price ($4k rent vs $369k).
- Recommended offer: $336k (9.0% below list) — sets the bar for market timing.
- Cap rate 7.5% vs local median 2.6% in New York — top-decile yield for the area; either an underpriced asset or a hidden risk that comps aren't pricing in. Stress-test before assuming the spread holds.
Location & tenants
- Location reads 75/100 on livability (#268 in NY, #4,188 nationally) — a middle-class / working-renter tenant base. Strengths: amenities A+, commute A+, health & safety A; Watch: crime F, cost of living F.
- Market conditions: Rents rising fast (+5.0%/yr); 521 active listings in the ZIP; 15 comparable units currently listed for rent nearby; rentals at typical pace (median 25d on market — plan ~3-4 weeks tenant-placement turnaround); 10,063 units permitted in Kings County in 2024 (9,789 in 5+ unit buildings).
- At $3,705/mo this rent would consume 75% of the median local household income ($60k/yr) (locally 7823% of renters already pay >50% of income on rent) — very limited rent-growth headroom before tenants either downsize or default.
Forward outlook
- Local home prices are declining (-3.0%/yr); year-one equity from $3k of loan paydown is wiped out by about $11k of value loss. Plan a longer hold.
- Kings County population projected at +13% by 2050 — modest demand growth; plan on rents tracking national, not racing it.
Negotiation context
- It's been on market 114 days — a 9% lower offer ($336k) is reasonable based on typical stale-listing flexibility.
- 3 sale attempts since 21y ago; this cycle's ask has dropped $26k (7%) from the opening price — seller is motivated, your offer sets the floor, not the list.
Risks & watch-outs
- Watch-outs: flood insurance adds $66/mo.
- Climate carrying-cost: severe flood risk; major wind risk, 72% chance of damaging wind over 30y; extreme-heat days projected 7→15/yr by 2055 (HVAC capex compounding) — expect insurance premiums to compound above CPI over the hold.
Questions for the listing agent
- It's been on market 114 days. Have you received any prior offers? Is the seller open to a 9% concession, seller financing, or rate buy-down credit?
- What's the actual annual flood-insurance premium (NFIP or private), and is the property in a SFHA with mandatory coverage?
- Any open or pending special assessments — roof, HVAC, plumbing, elevator, façade? What's the per-unit balance and payoff schedule, and is the seller paying it off at close or rolling it to the buyer?
- Why hasn't it sold? Are there any deal-killer items the seller is aware of (foundation, flood, title, zoning, code violations)?
- Is there a deadline driving the sale (1031 exchange, divorce, estate, relocation)? That informs how much negotiation room exists.
- Schools are B-rated — typically a magnet for longer-tenancy family renters. What's the average tenant stay here, and is there a school-zone premium baked into asking?
- Crime grade is F in this area — have there been break-ins, vandalism, or insurance claims at this property in the last 3 years? What carrier currently insures it and at what premium?
- What's the average days-on-market for RENTAL listings here right now (not sales)? A rising rental-DOM trend means longer vacancies and softer asking-rent achievability than the comps imply.
- What's the recent tenant-quality profile in this submarket — average credit score on applications, eviction rate, late-payment / NSF rate, and stable-employment percentage? A property-management company in the area should have these aggregated.
- How much new apartment / multifamily construction is in the pipeline within 1–3 miles? Heavy new supply (>2% of stock underway) typically softens rents 12–24 months out; light construction supports rent growth.
Investment metrics
- 1% rule
- 1.00% ✓
- Cap rate
- 7.52%
- Cash-on-cash
- 4.37%
- DSCR
- 1.19
- GRM
- 8.3
CMA / ARV
No comps found within radius.
Projected returns pro-forma
-3.0% appreciation · 5.04% rent growth · sell at horizon
- IRR
- -8.3%
- Equity multiple
- 0.69×
- Total profit
- $-32,183
- Equity at exit
- $55,019
- IRR
- 3.8%
- Equity multiple
- 1.30×
- Total profit
- $31,002
- Equity at exit
- $31,904
Cash invested: $103,320 (down + closing). Projections, not guarantees.
Landlord ↔ Tenant lean methodology
- Overall (CITY)
- 0 Strongly Tenant-Friendly
- State New York
- 15 Strongly Tenant-Friendly · D+10
- County
- — inherits STATE
- City New York
- 0 Strongly Tenant-Friendly · D+34
ZIP-level market 11235
- Rents YoY
- 5.0%
- Active inventory
- 521
- Price-to-rent
- 8.3×
Monthly cashflow live
- Estimated rent
- $3,705 high interval (Pro) →
- Mortgage (P&I)
- −$1,935
- Tax est. 1.5%
- −$461 /mo · $5,535/yr
- Insurance
- −$154
- Flood insurance flood zone
- −$66 /mo · $798/yr
- HOA
- −$0
- Vacancy / Maint / Mgmt
- −$778
- Net cashflow
- $310
Break-even live
UW: 25.0% down · 7.5% · 30yr · 1.5% tax · 5.0% vac · 8.0% maint · 8.0% mgmt
Financing live
Cash to close
- Down payment
- $92,250
- Closing costs
- $11,070
- Reserves months
- —
- Total cash needed
- —
Loan-product check · same deal, 3 products live
Conventional
25% down · 7.5% · 30yr
- Down + closing
- —
- Monthly P&I
- —
- Monthly cashflow
- —
- DSCR
- —
- Eligible?
- —
Personal DTI + credit; lowest rate.
DSCR
20% down · 8.5% · 30yr
- Down + closing
- —
- Monthly P&I
- —
- Monthly cashflow
- —
- DSCR
- —
- Eligible?
- —
No personal income docs; deal must DSCR.
Hard money
10% down · 12.0% · 12mo
- Down + closing
- —
- Monthly P&I
- —
- Monthly cashflow
- —
- DSCR
- —
- Eligible?
- —
Short-term bridge; refi at stabilization.
Rent comps 15 comps
| Address | Beds | Baths | Sqft | Rent | $/sqft | DOM | Units | Dist |
|---|---|---|---|---|---|---|---|---|
| 2538 E 2nd St Unit 2 Brooklyn, NY | 3.0 | 1.0 | 1100 | $2,600 | $2.36 | 24d | 1 | 0.41mi |
| 3000 Ocean Pkwy Brooklyn, NY | 2.0 | 2.0 | 1130 | $3,775 | $3.34 | 19d | 2 | 0.65mi |
| 532 Neptune Ave Brooklyn, NY | 1.0–3.0 | 1.0–2.0 | 948 | $4,562 | $4.81 | 7d | 8 | 0.81mi |
| 2957 Shell Rd Brooklyn, NY | 3.0 | 2.0 | 1292 | $5,550 | $4.30 | 24d | 1 | 0.83mi |
| 2971 Shell Rd Unit 704 Brooklyn, NY | 2.0 | 1.0 | 826 | $3,950 | $4.78 | 24d | 1 | 0.83mi |
| 2971 Shell Rd Unit 711 Brooklyn, NY | 2.0 | 2.0 | 907 | $4,200 | $4.63 | 24d | 1 | 0.83mi |
| 2971 Shell Rd Unit 612 Brooklyn, NY | 2.0 | 2.0 | 907 | $4,150 | $4.58 | 24d | 1 | 0.83mi |
| 2971 Shell Rd Unit 508 Brooklyn, NY | 2.0 | 2.0 | 930 | $4,099 | $4.41 | 24d | 1 | 0.83mi |
| 2971 Shell Rd Unit 406 Brooklyn, NY | 2.0 | 2.0 | 920 | $3,550 | $3.86 | 24d | 1 | 0.83mi |
| 2971 Shell Rd Unit 720 Brooklyn, NY | 2.0 | 2.0 | 920 | $4,100 | $4.46 | 24d | 1 | 0.83mi |
| 2971 Shell Rd Unit 602 Brooklyn, NY | 3.0 | 2.0 | 1301 | $5,299 | $4.07 | 24d | 1 | 0.83mi |
| 3000 Emmons Ave Unit 5 Brooklyn, NY | 2.0 | 2.0 | 840 | $4,085 | $4.86 | 24d | 1 | 1.20mi |
| 2483 W 16th St Brooklyn, NY | 1.0 | 1.0 | 800 | $1,800 | $2.25 | 20d | 1 | 1.22mi |
| 1515 Surf Ave Brooklyn, NY | 1.0–2.0 | 1.0 | 706 | $5,195 | $7.35 | 2d | 15 | 1.30mi |
| 3112 Emmons Ave Unit 203 Brooklyn, NY | 1.0 | 1.0 | 734 | $3,200 | $4.36 | 24d | 1 | 1.36mi |
HOA detail condo
- Monthly dues
- $0 · $0/yr
- Assessments
- None detected in remarks — confirm with the listing agent.
Listing history 18 events
-
2026-06-18days on market $369,000 Active 114 DOM
-
2026-06-17days on market $369,000 Active 113 DOM
-
2026-06-15days on market $369,000 Active 111 DOM
-
2026-06-13days on market $369,000 Active 109 DOM
-
2026-06-10days on market $369,000 Active 105 DOM
-
2026-06-08days on market $369,000 Active 104 DOM
-
2026-06-08pricedays on market $369,000 Active 103 DOM
-
2026-06-04days on market $375,000 Active 100 DOM
-
2026-06-03days on market $375,000 Active 99 DOM
-
2026-06-01days on market $375,000 Active 97 DOM
-
2026-05-31days on market $375,000 Active 96 DOM
-
2026-04-27price $375,000
-
2026-04-06price $385,000
-
2026-02-24$395,000 Active
-
2020-04-15soldstatus $325,000 Sold 147-char remark
Show marketing remark (147 chars)
Prime Location! Beautiful 2 bedroom coop, almost 1000sf, lots of closets, new kitchen, bath, bright and sunny, parquet floors. Near to everything.
-
2017-02-27historical 147-char remark
Show marketing remark (147 chars)
Prime Location! Beautiful 2 bedroom coop, almost 1000sf, lots of closets, new kitchen, bath, bright and sunny, parquet floors. Near to everything.
-
2017-01-17$349,000 Active 147-char remark
Show marketing remark (147 chars)
Prime Location! Beautiful 2 bedroom coop, almost 1000sf, lots of closets, new kitchen, bath, bright and sunny, parquet floors. Near to everything.
-
2005-02-12$259,000 74-char remark
Show marketing remark (74 chars)
100pct COOP, FULL 2 BDM, EIK WITH WINDOW, BATH WITH WINDOW, UTILITIES INCL
ⓘ Source: listings_history table (triggers on properties + properties_extension) + one-shot
backfill from property_details.listing_events for pre-trigger history.
Climate risk First Street
- Flood 8/10 Severe FEMA zone X (shaded) · 78% chance over 30 yrs
- Wildfire 1/10 Low
- Heat 7/10 Severe 7 d/yr ≥97°F today · 15 d/yr by 30 yrs out
- Wind 6/10 Major 72% chance of damaging wind over 30 yrs
- Air quality 4/10 Moderate 5 unhealthy d/yr today · 7 by 30 yrs out
Nearby sold comps map
Loading sold comps map…
Walkable amenities ~0.75 mi
Loading nearby amenities…
Taxation est. · year 1
- Rental income
- $44,457
- − Mortgage interest
- −$20,670
- − Property taxes
- −$5,535
- − Insurance
- −$2,642
- − Repairs & maintenance
- −$3,557
- − Management
- −$3,557
- − Depreciation
- −$10,735
- Taxable loss
- −$2,238
- Est. tax savings @ 24.0%
- +$537
- After-tax cash flow
- $4,259/yr
For passive investors: Depreciation is non-cash, so a rental often shows a tax loss while cash-flowing — sheltering income. Rental losses are passive: they offset passive income freely, and up to $25,000/yr can offset ordinary (W-2) income if you actively participate and your MAGI is under $100k (phasing out to $0 by $150k); unused losses carry forward. On sale, claimed depreciation is recaptured at up to 25%, and gains may owe capital-gains tax (a 1031 exchange can defer both). Figures are a year-1 estimate at your 24.0% rate — not tax advice; consult a CPA.
Schools (NCES district)
No district data.
Livability — New York
- Score
- 75/100
- State rank
- #268
- US rank
- #4188
Category grades
Schools grade is shown separately in the Schools card above.
Census & demographics
- Census place
- New York, NY
- County
- Kings County · 2,614,986 people
- City population
- 7,731,280
- Metro
- New York-Newark-Jersey City, NY-NJ-PA
- Population (ZIP)
- 78,558
- Household income
- $59,661
- Rent vs Own
- Severe rent burden
- 7823.0
Population outlook (Kings County) Hauer SSP2
- Today (2025)
- 2,847,441 people
- By 2030
- 2,937,006 · +3.1%
- By 2040
- 3,095,491 · +8.7%
- By 2050
- 3,228,968 · +13.4%
- By 2075
- 3,321,723 · +16.7%
- By 2100
- 3,111,387 · +9.3%
Race, ethnicity, and origin ACS 2023
- Neighborhood character
- Predominantly White (67%)
- Race & ethnicity
- White 67% Asian 15% Two or more races 9% Hispanic / Latino 9% Black 3%
- Hispanic origin (detail)
- Mexican 3% Puerto Rican 3%
- Common ancestry
- Scotch-Irish 15% Subsaharan African 12% Romanian 2%
- Foreign-born
- 63% · China, Canada, Vietnam
- Languages at home
- 24% English-only · Russian/Polish/Slavic 48% Chinese 7% Spanish 7%
Political lean MEDSL · Kings
- 2024 margin
- Solid D (+44.0) · D 72.0% · R 28.0%
- 2008→2024 swing
- -15.5pp toward R · 2008: 59.4pp · 2024: 44.0pp
- All cycles
- 2024: D+44.0 2020: D+54.8 2016: D+61.8 2012: D+63.9 2008: D+59.4
Not yet ingested
- Civics
- —
Market trends
- HPI YoY
- ▼ -181.73%
- Current HPI
- 303.6714
- Rent YoY
- ▲ 5.04%
- Metro
- New York-Newark-Jersey City, NY-NJ-PA
- State GDP YoY
- ▲ 2.60%
- F500 in state
- 92
Industry mix (Fortune 500 HQ in NY)
| Industry | F500 HQs | Revenue |
|---|---|---|
| Financial Services | 10 | $950B |
|
||
| Consumer Goods | 9 | $162B |
|
||
| Insurance | 4 | $225B |
|
||
| Telecommunications | 2 | $144B |
|
||
| Pharmaceuticals | 2 | $112B |
|
||
| Media / Entertainment | 2 | $69B |
|
||
Price history
+44.8% since first listed7 events — show timeline
- 2026-04-27 Price Changed $375,000 BNYMLS
- 2026-04-06 Price Changed $385,000 BNYMLS
- 2026-02-24 Listed $395,000 BNYMLS
- 2020-04-15 Sold (MLS) $325,000 BNYMLS
- 2017-02-27 Delisted — BNYMLS
- 2017-01-17 Listed $349,000 BNYMLS
- 2005-02-12 Listed $259,000 BNYMLS
Cash-flow waterfall
monthlySold comps — $/sqft
last 12 mo · ≤1 miLoading sold comps…