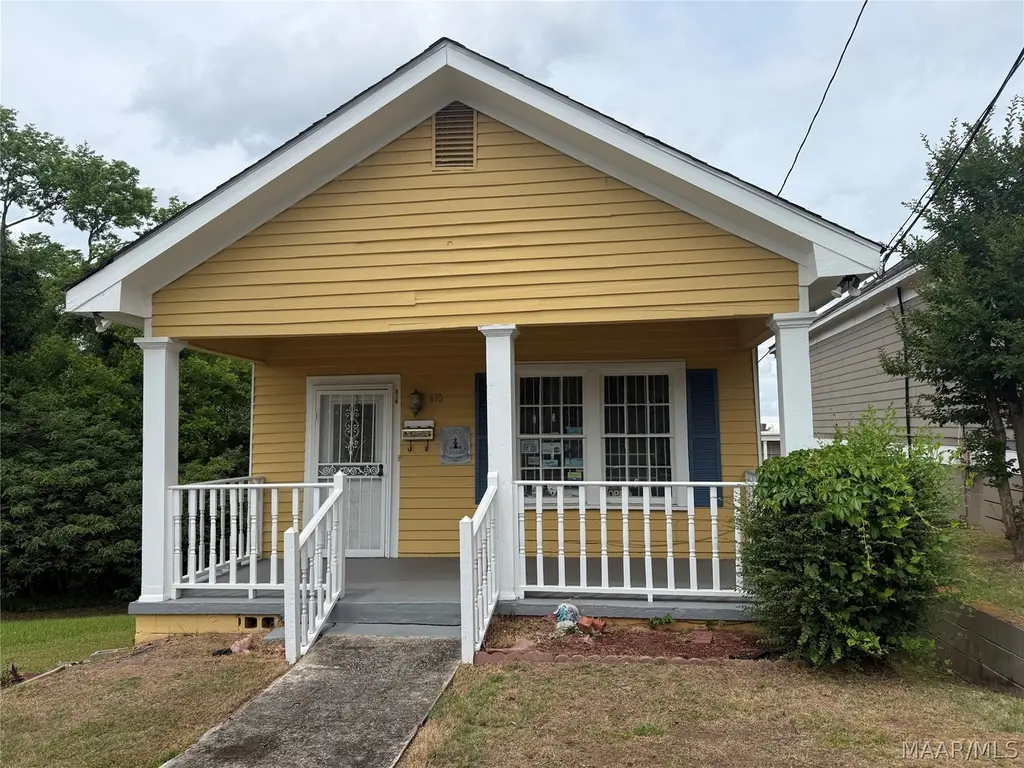
610 Clay St · Montgomery, AL
Flood risk No data
- FEMA flood zone
- —
- Chance of flooding over 30 yrs
- —
- Est. flood insurance / yr
- —
Fire risk No data
- Est. fire insurance / yr
- —
Heat risk No data
- Hot days now (above threshold)
- —
- Hot days in 30 yrs
- —
Wind risk No data
- Chance of severe wind over 30 yrs
- —
Air-quality risk No data
- Unhealthy air days now
- —
- Unhealthy air days in 30 yrs
- —
Risk factors via First Street. Map © Google.
Why this score? — see what drove the B- grade
The composite is a weighted blend of 9 inputs, each scored 0–100. Each bar is that input's sub-score; the figure is the points it added to the 100-point composite (weight × sub-score).
- Cash flow +30.0/30.0
- DSCR +10.0/10.0
- 1% rule +9.6/10.0
- ARV discount +7.5/15.0
- Livability +3.2/5.0
- Rent growth +2.5/5.0
- Condition / age +2.5/5.0
- Schools +1.7/10.0
- Appreciation +0.0/10.0
$100,000
🖨 Deal sheet 📄 Offer letter ✓ Due diligence
Listing remarks
The building will make a great home or office or both. Located in the Historic Cottage Hill downtown area. In close proximity to Maxwell AFB, the Riverfront and Montgomery Whitewater Park. A deck overlooks the Alabama River and also includes a basement. Great for Riverwalk development. Sold AS-IS.
Key facts
- 3,920 sq ft lot
- Parking
- Built 1940
Property features AI
Exterior
- Parking: Parking pad (2 pads)
- Utilities: Public water; Public sewer; Electricity available; Cable available; High-speed internet available
- Home design: Wood siding exterior
- Construction: Basement and slab foundation; Year built from public records
- Exterior features: Deck; City lot; Public road frontage
Interior
- Kitchen: Water heater (listed as appliance)
- Bedrooms: Bedroom on the first level
- Flooring: Wood
- Bathrooms: 1 full bathroom on the first level
- Heating & cooling: Central heating (electric); Central air conditioning (electric)
- Interior features: Finished basement; Wood flooring
Neighborhood map
What this means for you Summary
Snapshot
- This is a 2-bed/1.0-bath single-family listed at $100k.
Deal economics
- At list price, monthly cash flow is $553 ($7k/yr) — positive.
- The deal already cash-flows at list — no discount required.
- Meets the 1% rule at list price ($1k rent vs $100k).
- Recommended offer: $97k (3.0% below list) — sets the bar for market timing.
- Cap rate 12.9% vs local median 6.0% in Montgomery — top-decile yield for the area; either an underpriced asset or a hidden risk that comps aren't pricing in. Stress-test before assuming the spread holds.
Location & tenants
- Location reads 65/100 on livability (#138 in AL) — a middle-class / working-renter tenant base. Strengths: cost of living A+, housing A+; Watch: schools C-, employment D, crime F.
- Montgomery County (urban): math 9% / reading 31% proficiency, ranked #106 of 129 in AL (top 82%) — low school quality limits family demand, transient renter base, plan for 1-2y turnover; 70% free/reduced lunch — lower-income household profile, screen leases tightly.
- Market conditions: 53 active listings in the ZIP; 10 comparable units currently listed for rent nearby; rentals lingering (median 44d on market — plan ~5-8 weeks vacancy on turnover, expect pricing pressure); 60% of comp listings sitting > 30 days — soft ceiling on asking rent; lower-income renter base — watch delinquency; 460 units permitted in Montgomery County in 2024 (37 in 5+ unit buildings).
- At $1,461/mo this rent would consume 52% of the median local household income ($34k/yr) (locally 641% of renters already pay >50% of income on rent) — very limited rent-growth headroom before tenants either downsize or default.
Forward outlook
- Local home prices are declining (-3.0%/yr); year-one equity from $691 of loan paydown is wiped out by about $3k of value loss. Plan a longer hold.
- Montgomery County population projected to shrink 8% by 2050 — rents likely to lag national; underwrite the cash flow, not the appreciation.
- At projected returns (-3.0% appreciation + 3.0% rent growth), your $28k cash investment doubles in ~6 years — after that, you're playing with house money.
Negotiation context
- It's been on market 43 days — a 3% lower offer ($97k) is reasonable based on typical stale-listing flexibility.
Risks & watch-outs
- Watch-outs: built in 1940 — expect roof / HVAC / electrical / plumbing capex.
Questions for the listing agent
- It's been on market 43 days. Have you received any prior offers? Is the seller open to a 3% concession, seller financing, or rate buy-down credit?
- Built in 1940 — when were the roof, HVAC, electrical panel, plumbing, and water heater last replaced?
- Is there a deadline driving the sale (1031 exchange, divorce, estate, relocation)? That informs how much negotiation room exists.
- Crime grade is F in this area — have there been break-ins, vandalism, or insurance claims at this property in the last 3 years? What carrier currently insures it and at what premium?
- What's the average days-on-market for RENTAL listings here right now (not sales)? A rising rental-DOM trend means longer vacancies and softer asking-rent achievability than the comps imply.
- What's the recent tenant-quality profile in this submarket — average credit score on applications, eviction rate, late-payment / NSF rate, and stable-employment percentage? A property-management company in the area should have these aggregated.
- How much new for-sale + rental construction is in the pipeline within 1–3 miles? Heavy new supply typically softens prices + rents 12–24 months out; constrained supply supports both.
Investment metrics
- 1% rule
- 1.46% ✓
- Cap rate
- 12.93%
- Cash-on-cash
- 23.69%
- DSCR
- 2.05
- GRM
- 5.7
CMA / ARV
- ARV (median comp)
- $36,037
- List price
- $100,000
- Delta
- 177.49%
- Verdict
- OVERPRICED
- Comps
- 4 within 1.0 mi
Projected returns pro-forma
-3.0% appreciation · 3.0% rent growth · sell at horizon
- IRR
- 16.8%
- Equity multiple
- 1.68×
- Total profit
- $18,966
- Equity at exit
- $14,910
- IRR
- 25.3%
- Equity multiple
- 3.20×
- Total profit
- $61,711
- Equity at exit
- $8,646
Cash invested: $28,000 (down + closing). Projections, not guarantees.
Landlord ↔ Tenant lean methodology
- Overall (STATE)
- 90 Strongly Landlord-Friendly
- State Alabama
- 90 Strongly Landlord-Friendly · R+15
- County
- — inherits STATE
- City
- — inherits STATE
ZIP-level market 36104
- Active inventory
- 53
- Price-to-rent
- 5.7×
Monthly cashflow live
- Estimated rent
- $1,461 high interval (Pro) →
- Mortgage (P&I)
- −$524
- Tax from tax record
- −$35 /mo · $424/yr
- Insurance
- −$42
- HOA
- −$0
- Vacancy / Maint / Mgmt
- −$307
- Net cashflow
- $553
Break-even live
UW: 25.0% down · 7.5% · 30yr · 1.5% tax · 5.0% vac · 8.0% maint · 8.0% mgmt
Financing live
Cash to close
- Down payment
- $25,000
- Closing costs
- $3,000
- Reserves months
- —
- Total cash needed
- —
Loan-product check · same deal, 3 products live
Conventional
25% down · 7.5% · 30yr
- Down + closing
- —
- Monthly P&I
- —
- Monthly cashflow
- —
- DSCR
- —
- Eligible?
- —
Personal DTI + credit; lowest rate.
DSCR
20% down · 8.5% · 30yr
- Down + closing
- —
- Monthly P&I
- —
- Monthly cashflow
- —
- DSCR
- —
- Eligible?
- —
No personal income docs; deal must DSCR.
Hard money
10% down · 12.0% · 12mo
- Down + closing
- —
- Monthly P&I
- —
- Monthly cashflow
- —
- DSCR
- —
- Eligible?
- —
Short-term bridge; refi at stabilization.
Rent comps 10 comps
| Address | Beds | Baths | Sqft | Rent | $/sqft | DOM | Units | Dist |
|---|---|---|---|---|---|---|---|---|
| 605 Maxwell Blvd Montgomery, AL | 1.0–2.0 | 1.0–2.0 | 971 | $1,943 | $2.00 | 13d | 11 | 0.03mi |
| 545 Clay St Montgomery, AL | 2.0 | 2.0 | 1104 | $1,050 | $0.95 | 43d | 1 | 0.06mi |
| 501 Clayton St Unit 501A Montgomery, AL | 1.0 | 1.0 | 655 | $725 | $1.11 | 43d | 1 | 0.28mi |
| 207 Montgomery St Montgomery, AL | 1.0–2.0 | 1.0–2.0 | 890 | $1,785 | $2.01 | 13d | 4 | 0.49mi |
| 215 N Court St Unit 06 Montgomery, AL | 1.0 | 1.0 | 695 | $1,315 | $1.89 | 43d | 1 | 0.62mi |
| 215 N Court St Unit 04 Montgomery, AL | 1.0 | 1.0 | 927 | $1,570 | $1.69 | 43d | 1 | 0.62mi |
| 671 S Perry St Montgomery, AL | 2.0 | 1.0–2.0 | 525 | $1,725 | $3.29 | 21d | 1 | 0.93mi |
| 1301 S Perry St Unit A Montgomery, AL | 2.0 | 1.0 | 1100 | $950 | $0.86 | 13d | 1 | 1.36mi |
| 1314 S Hull St Unit 1316B Montgomery, AL | 1.0 | 1.0 | 866 | $700 | $0.81 | 43d | 1 | 1.45mi |
| 1316 S Hull St Unit B Montgomery, AL | 1.0 | 1.0 | 866 | $700 | $0.81 | 43d | 1 | 1.45mi |
Listing history 16 events
-
2026-06-18days on market $100,000 Active 43 DOM
-
2026-06-17days on market $100,000 Active 42 DOM
-
2026-06-16days on market $100,000 Active 41 DOM
-
2026-06-15days on market $100,000 Active 40 DOM
-
2026-06-14days on market $100,000 Active 38 DOM
-
2026-06-13days on market $100,000 Active 37 DOM
-
2026-06-10days on market $100,000 Active 35 DOM
-
2026-06-09days on market $100,000 Active 34 DOM
-
2026-06-08days on market $100,000 Active 33 DOM
-
2026-06-07days on market $100,000 Active 32 DOM
-
2026-06-03days on market $100,000 Active 28 DOM
-
2026-06-02days on market $100,000 Active 27 DOM
-
2026-06-01days on market $100,000 Active 26 DOM
-
2026-05-31days on market $100,000 Active 25 DOM
-
2026-05-30days on market $100,000 Active 24 DOM
-
2026-05-06$100,000 Active 298-char remark
ⓘ Source: listings_history table (triggers on properties + properties_extension) + one-shot
backfill from property_details.listing_events for pre-trigger history.
Tax reassessment forecast AL · Resets to sale price
- Current annual tax
- $424 · $35/mo
- Projected year-2 tax
- $424 · $35/mo
- Expected delta
- $0/yr ($0/mo · -0.0%)
ⓘ Screening estimate from a state-policy table — verify with the county assessor before closing.
Nearby sold comps map
Loading sold comps map…
Walkable amenities ~0.75 mi
Loading nearby amenities…
Taxation est. · year 1
- Rental income
- $17,531
- − Mortgage interest
- −$5,602
- − Property taxes
- −$424
- − Insurance
- −$500
- − Repairs & maintenance
- −$1,402
- − Management
- −$1,402
- − Depreciation
- −$2,909
- Taxable income
- $5,292
- Est. tax owed @ 24.0%
- −$1,270
- After-tax cash flow
- $5,363/yr
For passive investors: Depreciation is non-cash, so a rental often shows a tax loss while cash-flowing — sheltering income. Rental losses are passive: they offset passive income freely, and up to $25,000/yr can offset ordinary (W-2) income if you actively participate and your MAGI is under $100k (phasing out to $0 by $150k); unused losses carry forward. On sale, claimed depreciation is recaptured at up to 25%, and gains may owe capital-gains tax (a 1031 exchange can defer both). Figures are a year-1 estimate at your 24.0% rate — not tax advice; consult a CPA.
Schools (NCES district)
- District
- Montgomery County
- NCES district ID
- 0102430
- Math proficiency
- 9% ▼ -21.00%
- Reading proficiency
- 31% ▼ -1.00%
- Median HH income
- $43,902
- Composite
- 17.24/100
- National rank
- #9093
- State rank
- #106 of 129 in AL
Livability — Montgomery
- Score
- 65/100
- State rank
- #138
- US rank
- #13416
Category grades
Schools grade is shown separately in the Schools card above.
Census & demographics
- Census place
- Montgomery, AL
- County
- Montgomery County · 190,016 people
- City population
- 175,913
- Metro
- Montgomery, AL
- Population (ZIP)
- 10,535
- Household income
- $33,823
- Rent vs Own
- Severe rent burden
- 641.0
Population outlook (Montgomery County) Hauer SSP2
- Today (2025)
- 224,008 people
- By 2030
- 221,460 · -1.1%
- By 2040
- 214,179 · -4.4%
- By 2050
- 204,912 · -8.5%
- By 2075
- 177,821 · -20.6%
- By 2100
- 145,134 · -35.2%
Race, ethnicity, and origin ACS 2023
- Neighborhood character
- Predominantly Black (72%)
- Race & ethnicity
- Black 72% White 20% Two or more races 6% Hispanic / Latino 2%
- Common ancestry
- Swedish 2% Russian 1% Lithuanian 1%
- Foreign-born
- 2% · Canada
- Languages at home
- 97% English-only · Spanish 1% Other Indo-European 1%
Political lean MEDSL · Montgomery
- 2024 margin
- Solid D (+30.7) · D 64.8% · R 34.1% · Other 1.1%
- 2008→2024 swing
- +11.5pp toward D · 2008: 19.2pp · 2024: 30.7pp
- All cycles
- 2024: D+30.7 2020: D+31.5 2016: D+26.2 2012: D+24.3 2008: D+19.2
Not yet ingested
- Civics
- —
Market trends
- HPI YoY
- ▼ -101.13%
- Current HPI
- 27.2384
- Rent YoY
- —
- Metro
- Montgomery, AL
- State GDP YoY
- ▲ 2.94%
- F500 in state
- 4
Industry mix (Fortune 500 HQ in AL)
| Industry | F500 HQs | Revenue |
|---|---|---|
| Financial Services | 1 | $8B |
|
||
| Healthcare | 1 | $5B |
|
||
Price history
1 event — show timeline
- 2026-05-06 Listed $100,000 MAAR
Property tax history
+1.7%/yrLatest (2025): $424 · +14.7% YoY. Source: county tax records.
Cash-flow waterfall
monthlySold comps — $/sqft
last 12 mo · ≤1 miLoading sold comps…