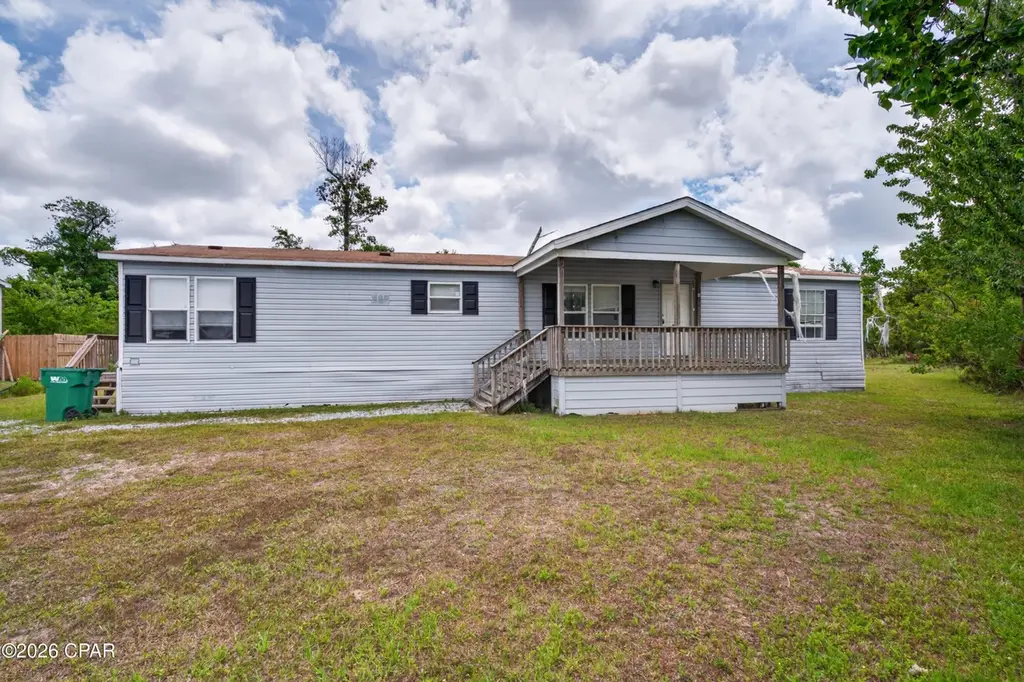
6240 Bryan Way · Callaway, FL
Flood risk 6/10 · Moderate
- FEMA flood zone
- A
- Chance of flooding over 30 yrs
- 0.68%
- Est. flood insurance / yr
- $1,009 – $1,996
Fire risk 7/10 · Major
- Est. fire insurance / yr
- $947 – $1,759
Heat risk 10/10 · Severe
- Hot days now (above 105°F)
- 7 days/yr
- Hot days in 30 yrs
- 21 days/yr
Wind risk 9/10 · Severe
- Chance of severe wind over 30 yrs
- 99.0%
Air-quality risk 1/10 · Minimal
- Unhealthy air days now
- 0 days/yr
- Unhealthy air days in 30 yrs
- 0 days/yr
Risk factors via First Street. Map © Google.
Why this score? — see what drove the B+ grade
The composite is a weighted blend of 9 inputs, each scored 0–100. Each bar is that input's sub-score; the figure is the points it added to the 100-point composite (weight × sub-score).
- Cash flow +30.0/30.0
- ARV discount +15.0/15.0
- 1% rule +10.0/10.0
- DSCR +10.0/10.0
- Schools +4.3/10.0
- Livability +3.2/5.0
- Rent growth +2.8/5.0
- Condition / age +2.5/5.0
- Appreciation +0.0/10.0
$115,000
🖨 Deal sheet 📄 Offer letter ✓ Due diligence
Listing remarks
BRING ALL OFFERS! Perfect opportunity for DIYers, investors, or first-time homebuyers looking to build instant equity! This spacious 3-bedroom, 2-bath mobile home is tucked away at the end of the street and backs up to a wooded area, offering extra privacy and a peaceful setting. With a little TLC and new flooring throughout, this home has incredible potential to shine. Enjoy outdoor living with two oversized decks, including a covered 10x16 front deck that's perfect for relaxing with your morning coffee or entertaining guests. The chain-link fenced backyard is ideal for pets, kids, or extra outdoor enjoyment. Inside, the spacious living room features sliding glass doors leading to the back
Key facts
- Two oversized decks
- Sliding glass doors
- Covered front deck
Tags
Property features AI
Exterior
- Utilities: Electricity available; Sewer available
- Home design: Double wide mobile home; Zoned for mobile homes
- Construction: Vinyl siding; Composition/shingle roof
- Exterior features: Covered and open porch; Porch; Shed(s); Located on a paved cul-de-sac
Interior
- Kitchen: Electric oven; Electric range
- Bedrooms: Two additional bedrooms on the first level; Primary bedroom on the first level
- Bathrooms: 2 full bathrooms
- Heating & cooling: Central heating (electric); Central air; Ceiling fans
- Interior features: Total of 6 rooms; Dining room; Living room; Primary bedroom
- Laundry & utility: Electric water heater
Neighborhood map
What this means for you Summary
Snapshot
- This is a 3-bed/2.0-bath manufactured listed at $115k.
Deal economics
- At list price, monthly cash flow is $491 ($6k/yr) — positive.
- The deal already cash-flows at list — no discount required.
- Meets the 1% rule at list price ($2k rent vs $115k).
- Recommended offer: $112k (3.0% below list) — sets the bar for market timing.
- Cap rate 12.7% vs local median 5.1% in Callaway — top-decile yield for the area; either an underpriced asset or a hidden risk that comps aren't pricing in. Stress-test before assuming the spread holds.
Location & tenants
- Location reads 64/100 on livability (#690 in FL) — a middle-class / working-renter tenant base. Strengths: cost of living A+, housing A+; Watch: employment D+, schools F, amenities F.
- Bay (suburban): math 51% / reading 51% proficiency, ranked #29 of 73 in FL (top 40%) — acceptable for families but not a draw, mixed tenant base, ~2y average lease.
- Market conditions: Rents rising (+1.1%/yr); 969 active listings in the ZIP; 20 comparable units currently listed for rent nearby; rentals at typical pace (median 21d on market — plan ~3-4 weeks tenant-placement turnaround); 2,473 units permitted in Bay County in 2024 (559 in 5+ unit buildings).
Forward outlook
- Local home prices are declining (-3.0%/yr); year-one equity from $795 of loan paydown is wiped out by about $3k of value loss. Plan a longer hold.
- Bay County population projected at +24% by 2050 — long-run rental-demand tailwind backs the buy-and-hold thesis.
- At projected returns (-3.0% appreciation + 1.1% rent growth), your $32k cash investment doubles in ~8 years — after that, you're playing with house money.
Negotiation context
- It's been on market 38 days — a 3% lower offer ($112k) is reasonable based on typical stale-listing flexibility.
- 10 sale attempts since 20y ago; this cycle's ask has dropped $35k (23%) from the opening price — seller is motivated, your offer sets the floor, not the list.
Risks & watch-outs
- Watch-outs: flood insurance adds $125/mo.
- Climate carrying-cost: in FEMA flood zone A (mandatory federal flood insurance); severe wind risk, 99% chance of damaging wind over 30y; major wildfire risk; extreme-heat days projected 7→21/yr by 2055 (HVAC capex compounding) — expect insurance premiums to compound above CPI over the hold.
Questions for the listing agent
- It's been on market 38 days. Have you received any prior offers? Is the seller open to a 3% concession, seller financing, or rate buy-down credit?
- What's the actual annual flood-insurance premium (NFIP or private), and is the property in a SFHA with mandatory coverage?
- Is there a deadline driving the sale (1031 exchange, divorce, estate, relocation)? That informs how much negotiation room exists.
- Schools are F-rated, which usually means shorter tenancies and higher turnover. Who's the typical renter profile here, and what's been the actual vacancy rate?
- What's the average days-on-market for RENTAL listings here right now (not sales)? A rising rental-DOM trend means longer vacancies and softer asking-rent achievability than the comps imply.
- What's the recent tenant-quality profile in this submarket — average credit score on applications, eviction rate, late-payment / NSF rate, and stable-employment percentage? A property-management company in the area should have these aggregated.
- How much new for-sale + rental construction is in the pipeline within 1–3 miles? Heavy new supply typically softens prices + rents 12–24 months out; constrained supply supports both.
Investment metrics
- 1% rule
- 1.58% ✓
- Cap rate
- 12.72%
- Cash-on-cash
- 22.96%
- DSCR
- 2.02
- GRM
- 5.3
CMA / ARV
- ARV (median comp)
- $163,097
- List price
- $115,000
- Delta
- -29.49%
- Verdict
- UNDERPRICED
- Comps
- 10 within 1.0 mi
Projected returns pro-forma
-3.0% appreciation · 1.12% rent growth · sell at horizon
- IRR
- 7.6%
- Equity multiple
- 1.29×
- Total profit
- $9,379
- Equity at exit
- $17,147
- IRR
- 15.1%
- Equity multiple
- 2.11×
- Total profit
- $35,590
- Equity at exit
- $9,943
Cash invested: $32,200 (down + closing). Projections, not guarantees.
Landlord ↔ Tenant lean methodology
- Overall (STATE)
- 87 Strongly Landlord-Friendly
- State Florida
- 87 Strongly Landlord-Friendly · R+3
- County
- — inherits STATE
- City
- — inherits STATE
ZIP-level market 32404
- Home prices YoY
- -16.1%
- Rents YoY
- 1.1%
- Active inventory
- 969
- Price-to-rent
- 5.3×
Monthly cashflow live
- Estimated rent
- $1,815 high interval (Pro) →
- Mortgage (P&I)
- −$603
- Tax from tax record
- −$167 /mo · $2,004/yr
- Insurance
- −$48
- Flood insurance flood zone
- −$125 /mo · $1,502/yr
- HOA
- −$0
- Vacancy / Maint / Mgmt
- −$381
- Net cashflow
- $491
Break-even live
UW: 25.0% down · 7.5% · 30yr · 1.5% tax · 5.0% vac · 8.0% maint · 8.0% mgmt
Financing live
Cash to close
- Down payment
- $28,750
- Closing costs
- $3,450
- Reserves months
- —
- Total cash needed
- —
Loan-product check · same deal, 3 products live
Conventional
25% down · 7.5% · 30yr
- Down + closing
- —
- Monthly P&I
- —
- Monthly cashflow
- —
- DSCR
- —
- Eligible?
- —
Personal DTI + credit; lowest rate.
DSCR
20% down · 8.5% · 30yr
- Down + closing
- —
- Monthly P&I
- —
- Monthly cashflow
- —
- DSCR
- —
- Eligible?
- —
No personal income docs; deal must DSCR.
Hard money
10% down · 12.0% · 12mo
- Down + closing
- —
- Monthly P&I
- —
- Monthly cashflow
- —
- DSCR
- —
- Eligible?
- —
Short-term bridge; refi at stabilization.
Rent comps 20 comps
| Address | Beds | Baths | Sqft | Rent | $/sqft | DOM | Units | Dist |
|---|---|---|---|---|---|---|---|---|
| 6121 Harvey St Unit 8 Panama City, FL | 2.0 | 1.5 | 1200 | $1,050 | $0.88 | 21d | 1 | 0.41mi |
| 5817 Jasmine Ct Panama City, FL | 4.0 | 2.5 | 1633 | $2,000 | $1.22 | 13d | 1 | 0.42mi |
| 6101 Harvey St #3 Panama City, FL | 2.0 | 1.5 | 1108 | $1,050 | $0.95 | 21d | 1 | 0.43mi |
| 229 Callaway Chase Ln Panama City, FL | 3.0 | 2.5 | 1200 | $1,650 | $1.38 | 13d | 1 | 0.51mi |
| 420 Raven Ln Panama City, FL | 3.0 | 2.0 | 1251 | $1,750 | $1.40 | 21d | 1 | 0.53mi |
| 163 Lauren Ln Panama City, FL | 4.0 | 2.0 | 1731 | $2,300 | $1.33 | 21d | 1 | 0.63mi |
| 175 N Berthe Ave Panama City, FL | 4.0 | 2.0 | 1498 | $2,195 | $1.47 | 13d | 1 | 0.69mi |
| 526 Camellia Ave Panama City, FL | 3.0 | 2.0 | 1375 | $1,950 | $1.42 | 21d | 1 | 0.72mi |
| 116 Christie Ln Panama City, FL | 3.0 | 2.0 | 1092 | $1,550 | $1.42 | 21d | 1 | 0.76mi |
| 114 S Kimbrel Ave Panama City, FL | 3.0 | 2.0 | 1400 | $1,850 | $1.32 | 21d | 1 | 0.91mi |
| 6328 Olokee St Panama City, FL | 3.0 | 2.0 | 1131 | $1,850 | $1.64 | 13d | 1 | 1.01mi |
| 5101 Willow St Panama City, FL | 3.0 | 2.0 | 1099 | $1,500 | $1.36 | 13d | 1 | 1.08mi |
| 263 Nelle Ave Panama City, FL | 3.0 | 2.0 | 1294 | $1,690 | $1.31 | 21d | 1 | 1.09mi |
| 129 Seneca Ave Panama City, FL | 3.0 | 2.0 | 1449 | $1,495 | $1.03 | 13d | 1 | 1.12mi |
| 208 North Highway 22 A Unit 33 Panama City, FL | 3.0 | 2.0 | 1080 | $1,350 | $1.25 | 21d | 1 | 1.15mi |
| 211 Sukoshi Dr Panama City, FL | 3.0 | 2.0 | 1512 | $1,900 | $1.26 | 21d | 1 | 1.33mi |
| 906 Kevin Ct Panama City, FL | 3.0 | 2.0 | 1266 | $1,795 | $1.42 | 21d | 1 | 1.33mi |
| 5813 Hickory St Panama City, FL | 3.0 | 2.0 | 1200 | $1,950 | $1.62 | 21d | 1 | 1.33mi |
| 4141 E 15th St Panama City, FL | 2.0–3.0 | 2.0 | 1082 | $1,825 | $1.69 | 13d | 9 | 1.37mi |
| 5717 Rebecca Ct Unit B Panama City, FL | 2.0 | 1.0 | 1612 | $1,350 | $0.84 | 21d | 1 | 1.48mi |
Listing history 50 events
-
2026-06-19days on market $115,000 Active 38 DOM
-
2026-06-18days on market $115,000 Active 37 DOM
-
2026-06-17days on market $115,000 Active 36 DOM
-
2026-06-16days on market $115,000 Active 35 DOM
-
2026-06-15days on market $115,000 Active 34 DOM
-
2026-06-14days on market $115,000 Active 32 DOM
-
2026-06-13days on market $115,000 Active 31 DOM
-
2026-06-10days on market $115,000 Active 29 DOM
-
2026-06-09days on market $115,000 Active 28 DOM
-
2026-06-08days on market $115,000 Active 27 DOM
-
2026-06-07days on market $115,000 Active 26 DOM
-
2026-06-05pricedays on market $115,000 Active 23 DOM
-
2026-06-03days on market $135,000 Active 22 DOM
-
2026-06-02days on market $135,000 Active 21 DOM
-
2026-06-01days on market $135,000 Active 20 DOM
-
2026-05-31days on market $135,000 Active 19 DOM
-
2026-05-30days on market $135,000 Active 18 DOM
-
2026-05-18price $135,000 1545-char remark
-
2026-04-30$150,000 Active 1545-char remark
-
2026-01-09historical
-
2025-12-17historical
-
2025-11-20price $144,990
-
2025-11-07$149,000 Active
-
2024-03-08soldstatus $170,000
-
2024-03-06soldstatus $170,000 Closed
-
2024-01-25status Pending
-
2023-12-12$175,000 Active
-
2023-11-30historical
-
2023-09-11$180,000 Active
-
2023-07-10soldstatus $161,000 Closed
-
2023-05-11historical Active Under Contract
-
2023-05-02price $160,000
-
2023-04-28price $174,000
-
2023-04-19price $179,000
-
2023-04-04price $185,000
-
2023-03-26$199,000 Active
-
2022-03-04soldstatus $60,000
-
2022-03-03soldstatus $60,000 Closed
-
2022-02-25status Pending
-
2021-12-09historical
-
2021-12-09historical
-
2021-11-24$69,900 Active
-
2011-12-12soldstatus $24,000
-
2011-08-25$36,000
-
2008-02-11soldstatus $90,000
-
2008-02-08soldstatus $90,000
-
2007-07-14$99,000
-
2006-09-01$117,000
-
2006-03-25$130,000
-
1996-07-01soldstatus $23,700
ⓘ Source: listings_history table (triggers on properties + properties_extension) + one-shot
backfill from property_details.listing_events for pre-trigger history.
Tax reassessment forecast FL · Resets to sale price
- Current annual tax
- $2,004 · $167/mo
- Projected year-2 tax
- $2,004 · $167/mo
- Expected delta
- $0/yr ($0/mo · 0.0%)
ⓘ Screening estimate from a state-policy table — verify with the county assessor before closing.
Climate risk First Street
- Flood 6/10 Major FEMA zone A · 68% chance over 30 yrs
- Wildfire 7/10 Severe
- Heat 10/10 Extreme 7 d/yr ≥105°F today · 21 d/yr by 30 yrs out
- Wind 9/10 Extreme 99% chance of damaging wind over 30 yrs
- Air quality 1/10 Low 0 unhealthy d/yr today · 0 by 30 yrs out
Nearby sold comps map
Loading sold comps map…
Walkable amenities ~0.75 mi
Loading nearby amenities…
Taxation est. · year 1
- Rental income
- $21,783
- − Mortgage interest
- −$6,442
- − Property taxes
- −$2,004
- − Insurance
- −$2,078
- − Repairs & maintenance
- −$1,743
- − Management
- −$1,743
- − Depreciation
- −$3,345
- Taxable income
- $4,430
- Est. tax owed @ 24.0%
- −$1,063
- After-tax cash flow
- $4,828/yr
For passive investors: Depreciation is non-cash, so a rental often shows a tax loss while cash-flowing — sheltering income. Rental losses are passive: they offset passive income freely, and up to $25,000/yr can offset ordinary (W-2) income if you actively participate and your MAGI is under $100k (phasing out to $0 by $150k); unused losses carry forward. On sale, claimed depreciation is recaptured at up to 25%, and gains may owe capital-gains tax (a 1031 exchange can defer both). Figures are a year-1 estimate at your 24.0% rate — not tax advice; consult a CPA.
Schools (NCES district)
- District
- Bay
- NCES district ID
- 1200090
- Math proficiency
- 51% ▼ -8.00%
- Reading proficiency
- 51% ▼ -7.00%
- Median HH income
- $47,740
- Composite
- 43.41/100
- National rank
- #3014
- State rank
- #29 of 73 in FL
Livability — Callaway
- Score
- 64/100
- State rank
- #690
- US rank
- #14384
Category grades
Schools grade is shown separately in the Schools card above.
Census & demographics
- Census place
- Callaway, FL
- County
- Bay County · 163,593 people
- Metro
- Panama City, FL
- Population (ZIP)
- 42,514
- Household income
- $74,708
- Rent vs Own
- Severe rent burden
- 1218.0
Population outlook (Bay County) Hauer SSP2
- Today (2025)
- 206,264 people
- By 2030
- 217,740 · +5.6%
- By 2040
- 238,738 · +15.7%
- By 2050
- 255,545 · +23.9%
- By 2075
- 288,295 · +39.8%
- By 2100
- 288,638 · +39.9%
Race, ethnicity, and origin ACS 2023
- Neighborhood character
- Predominantly White (69%)
- Race & ethnicity
- White 69% Black 12% Two or more races 10% Hispanic / Latino 9% Asian 3%
- Hispanic origin (detail)
- Mexican 2% Puerto Rican 3%
- Common ancestry
- Lithuanian 3% Slovak 2% Italian 2%
- Foreign-born
- 7% · Canada, Vietnam, Mexico
- Languages at home
- 90% English-only · Spanish 6% Vietnamese 1% Other Asian/Pacific 1%
Political lean MEDSL · Bay
- 2024 margin
- Solid R (+47.4) · D 25.8% · R 73.1% · Other 1.1%
- 2008→2024 swing
- -6.6pp toward R · 2008: -40.7pp · 2024: -47.4pp
- All cycles
- 2024: R+47.4 2020: R+43.5 2016: R+46.3 2012: R+43.6 2008: R+40.7
Not yet ingested
- Civics
- —
Market trends
- HPI YoY
- ▼ -50.59%
- Current HPI
- 263.7178
- Rent YoY
- ▲ 1.12%
- Metro
- Panama City, FL
- State GDP YoY
- ▲ 3.28%
- F500 in state
- 36
Industry mix (Fortune 500 HQ in FL)
| Industry | F500 HQs | Revenue |
|---|---|---|
| Industrial Technology | 2 | $29B |
|
||
| Insurance | 2 | $17B |
|
||
| Retail | 1 | $60B |
|
||
| Technology Distribution | 1 | $58B |
|
||
| Homebuilding | 1 | $35B |
|
||
| Technology Manufacturing | 1 | $35B |
|
||
Price history
+400.0% since first listed35 events — show timeline
- 2026-06-03 Price Changed $115,000 CPARMLS
- 2026-05-18 Price Changed $135,000 CPARMLS
- 2026-04-30 Listed $150,000 CPARMLS
- 2026-01-09 Listing Removed — CPARMLS
- 2025-12-17 Listing Removed — CPARMLS
- 2025-11-20 Price Changed $144,990 CPARMLS
- 2025-11-07 Listed $149,000 CPARMLS
- 2024-03-08 Sold (Public Records) $170,000 Public Records
- 2024-03-06 Sold (MLS) $170,000 CPARMLS
- 2024-01-25 Pending — CPARMLS
- 2023-12-12 Listed $175,000 CPARMLS
- 2023-11-30 Listing Removed — CPARMLS
- 2023-09-11 Listed $180,000 CPARMLS
- 2023-07-10 Sold (MLS) $161,000 CPARMLS
- 2023-05-11 Contingent — CPARMLS
- 2023-05-02 Price Changed $160,000 CPARMLS
- 2023-04-28 Price Changed $174,000 CPARMLS
- 2023-04-19 Price Changed $179,000 CPARMLS
- 2023-04-04 Price Changed $185,000 CPARMLS
- 2023-03-26 Listed $199,000 CPARMLS
- 2022-03-04 Sold (Public Records) $60,000 Public Records
- 2022-03-03 Sold (MLS) $60,000 CPARMLS
- 2022-02-25 Pending — CPARMLS
- 2021-12-09 Listing Removed — CPARMLS
- 2021-12-09 Listing Removed — CPARMLS
- 2021-11-24 Listed $69,900 CPARMLS
- 2011-12-12 Sold (MLS) $24,000 CPARMLS
- 2011-08-25 Listed $36,000 CPARMLS
- 2008-02-11 Sold (Public Records) $90,000 Public Records
- 2008-02-08 Sold (MLS) $90,000 CPARMLS
- 2007-07-14 Listed $99,000 CPARMLS
- 2006-09-01 Listed $117,000 CPARMLS
- 2006-03-25 Listed $130,000 CPARMLS
- 1996-07-01 Sold (Public Records) $23,700 Public Records
- 1995-08-01 Sold (Public Records) $23,000 Public Records
Property tax history
+12.5%/yrLatest (2025): $2,004 · +12.4% YoY. Source: county tax records.
Cash-flow waterfall
monthlySold comps — $/sqft
last 12 mo · ≤1 miLoading sold comps…