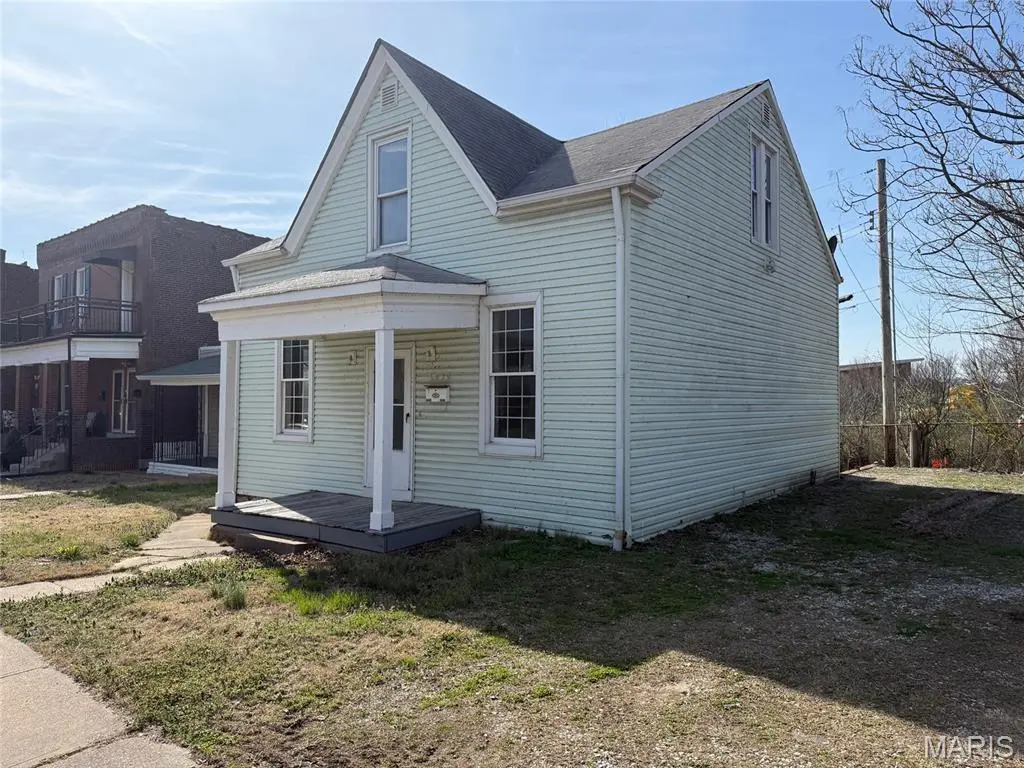
6429 Idaho Ave · St. Louis, MO
Flood risk 1/10 · Minimal
- FEMA flood zone
- X (unshaded)
- Chance of flooding over 30 yrs
- 0.0%
- Est. flood insurance / yr
- $473 – $860
Fire risk 1/10 · Minimal
- Est. fire insurance / yr
- $1,054 – $1,958
Heat risk 5/10 · Moderate
- Hot days now (above 109°F)
- 7 days/yr
- Hot days in 30 yrs
- 21 days/yr
Wind risk 2/10 · Minimal
- Chance of severe wind over 30 yrs
- 1.0%
Air-quality risk 3/10 · Minor
- Unhealthy air days now
- 3 days/yr
- Unhealthy air days in 30 yrs
- 4 days/yr
Risk factors via First Street. Map © Google.
Why this score? — see what drove the B grade
The composite is a weighted blend of 9 inputs, each scored 0–100. Each bar is that input's sub-score; the figure is the points it added to the 100-point composite (weight × sub-score).
- Cash flow +28.7/30.0
- ARV discount +15.0/15.0
- DSCR +10.0/10.0
- 1% rule +7.3/10.0
- Rent growth +3.3/5.0
- Livability +2.5/5.0
- Condition / age +2.5/5.0
- Schools +1.2/10.0
- Appreciation +0.0/10.0
$89,900
🖨 Deal sheet 📄 Offer letter ✓ Due diligence
Listing remarks MLS
Located in the heart of South St. Louis, 6429 Idaho Avenue presents a fantastic opportunity for investors or buyers looking to build equity. This classic two-story home offers a flexible layout with three bedrooms and two full bathrooms, including two bedrooms and one full bath on the upper level, plus an additional bedroom and full bath on the main floor—ideal for multi-generational living or added rental potential. With its solid structure and traditional charm, this property is ready for your vision and updates. Whether you’re planning a renovation for resale, a long-term rental, or a personalized primary residence, the layout provides a strong foundation to maximize value. The main level bedroom and bath add convenience and versatility, while the second floor offers a more private sleeping area. Situated on a quiet residential street with easy access to local amenities, schools, and major thoroughfares, this home combines location with opportunity. Bring your ideas and unlock the full potential of this promising investment property.
Key facts
- 1,986 sq ft lot
- Built 1896
- Listed 76 days
Neighborhood map
What this means for you Summary
Snapshot
- This is a 3-bed/1.0-bath single-family listed at $90k.
Deal economics
- At list price, monthly cash flow is $298 ($4k/yr) — positive.
- The deal already cash-flows at list — no discount required.
- Meets the 1% rule at list price ($1k rent vs $90k).
- Recommended offer: $85k (6.0% below list) — sets the bar for market timing.
- Cap rate 10.3% vs local median 5.0% in St. Louis — top-decile yield for the area; either an underpriced asset or a hidden risk that comps aren't pricing in. Stress-test before assuming the spread holds.
Location & tenants
- Location reads: area grade B — affects rentability + tenant quality, not the cash-flow math above.
- St. Louis City (urban): math 10% / reading 18% proficiency, ranked #312 of 324 in MO (top 96%) — low school quality limits family demand, transient renter base, plan for 1-2y turnover; 80% free/reduced lunch — lower-income household profile, screen leases tightly.
- Market conditions: Rents rising (+3.3%/yr); 125 active listings in the ZIP; 40 comparable units currently listed for rent nearby; rentals at typical pace (median 24d on market — plan ~3-4 weeks tenant-placement turnaround); 48% of comp listings sitting > 30 days — soft ceiling on asking rent; 294 units permitted in St. Louis city in 2024 (227 in 5+ unit buildings).
Forward outlook
- Local home prices are declining (-3.0%/yr); year-one equity from $622 of loan paydown is wiped out by about $3k of value loss. Plan a longer hold.
- St. Louis County population projected to shrink 6% by 2050 — rents likely to lag national; underwrite the cash flow, not the appreciation.
- At projected returns (-3.0% appreciation + 3.3% rent growth), your $25k cash investment doubles in ~9 years — after that, you're playing with house money.
Negotiation context
- It's been on market 76 days — a 6% lower offer ($85k) is reasonable based on typical stale-listing flexibility.
Risks & watch-outs
- Watch-outs: built in 1896 — expect roof / HVAC / electrical / plumbing capex.
- Climate carrying-cost: extreme-heat days projected 7→21/yr by 2055 (HVAC capex compounding) — expect insurance premiums to compound above CPI over the hold.
Questions for the listing agent
- It's been on market 76 days. Have you received any prior offers? Is the seller open to a 6% concession, seller financing, or rate buy-down credit?
- Built in 1896 — when were the roof, HVAC, electrical panel, plumbing, and water heater last replaced?
- Why hasn't it sold? Are there any deal-killer items the seller is aware of (foundation, flood, title, zoning, code violations)?
- Is there a deadline driving the sale (1031 exchange, divorce, estate, relocation)? That informs how much negotiation room exists.
- What's the average days-on-market for RENTAL listings here right now (not sales)? A rising rental-DOM trend means longer vacancies and softer asking-rent achievability than the comps imply.
- What's the recent tenant-quality profile in this submarket — average credit score on applications, eviction rate, late-payment / NSF rate, and stable-employment percentage? A property-management company in the area should have these aggregated.
- How much new for-sale + rental construction is in the pipeline within 1–3 miles? Heavy new supply typically softens prices + rents 12–24 months out; constrained supply supports both.
Investment metrics
- 1% rule
- 1.23% ✓
- Cap rate
- 10.27%
- Cash-on-cash
- 14.21%
- DSCR
- 1.63
- GRM
- 6.8
CMA / ARV
- ARV (median comp)
- $172,264
- List price
- $89,900
- Delta
- -47.81%
- Verdict
- UNDERPRICED
- Comps
- 20 within 1.0 mi
Show comp detail 12 sales within ~0.75 mi
| Address | Dist | Beds/Ba | Sqft | Sold | Price | $/sf | Match |
|---|---|---|---|---|---|---|---|
| 925 Iron | 0.20mi | 2/1.0 (-1) | 714 (-8%) | 0mo | $130,000 | $182 | 71 |
| 6608 Idaho Ave | 0.06mi | 2/1.0 (-1) | 858 (+10%) | 8mo | $44,900 | $52 | 70 |
| 6127 Alaska Ave | 0.26mi | 2/1.0 (-1) | 864 (+11%) | 0mo | $94,900 | $110 | 64 |
| 7116 Vermont Ave | 0.42mi | 2/1.0 (-1) | 759 (-3%) | 11mo | $129,900 | $171 | 62 |
| 6135 Idaho Ave | 0.23mi | 2/1.0 (-1) | 875 (+12%) | 4mo | $44,130 | $50 | 61 |
| 6209 Idaho Ave | 0.18mi | 2/2.0 (-1) | 865 (+11%) | 10mo | $149,000 | $172 | 56 |
| 3749 Roswell Ave | 0.70mi | 2/1.0 (-1) | 768 (-2%) | 8mo | $147,000 | $191 | 53 |
| 7100 Idaho Ave | 0.39mi | 2/1.0 (-1) | 728 (-7%) | 16mo | $119,900 | $165 | 52 |
| 125 Koeln Ave | 0.74mi | 2/1.0 (-1) | 833 (+7%) | 2mo | $110,000 | $132 | 48 |
| 7601 Alabama Ave | 0.73mi | 2/2.0 (-1) | 829 (+6%) | 14mo | $65,000 | $78 | 35 |
| 606 Fassen St | 0.64mi | 2/1.0 (-1) | 875 (+12%) | 14mo | $75,000 | $86 | 33 |
| 3718 Robert Ave | 0.71mi | 2/2.0 (-1) | 864 (+11%) | 15mo | $219,000 | $253 | 28 |
Match score weights: distance 35% · size 25% · config 20% · recency 20%. Top-matched comps best support the ARV.
Projected returns pro-forma
-3.0% appreciation · 3.27% rent growth · sell at horizon
- IRR
- 4.8%
- Equity multiple
- 1.19×
- Total profit
- $4,710
- Equity at exit
- $13,404
- IRR
- 14.5%
- Equity multiple
- 2.18×
- Total profit
- $29,740
- Equity at exit
- $7,773
Cash invested: $25,172 (down + closing). Projections, not guarantees.
Landlord ↔ Tenant lean methodology
- Overall (STATE)
- 81 Strongly Landlord-Friendly
- State Missouri
- 81 Strongly Landlord-Friendly · R+10
- County
- — inherits STATE
- City
- — inherits STATE
ZIP-level market 63111
- Rents YoY
- 3.3%
- Active inventory
- 125
- Price-to-rent
- 6.8×
Monthly cashflow live
- Estimated rent
- $1,103 high interval (Pro) →
- Mortgage (P&I)
- −$471
- Tax from tax record
- −$64 /mo · $768/yr
- Insurance
- −$37
- HOA
- −$0
- Vacancy / Maint / Mgmt
- −$232
- Net cashflow
- $298
Break-even live
UW: 25.0% down · 7.5% · 30yr · 1.5% tax · 5.0% vac · 8.0% maint · 8.0% mgmt
Financing live
Cash to close
- Down payment
- $22,475
- Closing costs
- $2,697
- Reserves months
- —
- Total cash needed
- —
Loan-product check · same deal, 3 products live
Conventional
25% down · 7.5% · 30yr
- Down + closing
- —
- Monthly P&I
- —
- Monthly cashflow
- —
- DSCR
- —
- Eligible?
- —
Personal DTI + credit; lowest rate.
DSCR
20% down · 8.5% · 30yr
- Down + closing
- —
- Monthly P&I
- —
- Monthly cashflow
- —
- DSCR
- —
- Eligible?
- —
No personal income docs; deal must DSCR.
Hard money
10% down · 12.0% · 12mo
- Down + closing
- —
- Monthly P&I
- —
- Monthly cashflow
- —
- DSCR
- —
- Eligible?
- —
Short-term bridge; refi at stabilization.
Rent comps 40 comps
| Address | Beds | Baths | Sqft | Rent | $/sqft | DOM | Units | Dist |
|---|---|---|---|---|---|---|---|---|
| 6436 Idaho Ave Saint Louis, MO | 2.0 | 1.0 | 1050 | $995 | $0.95 | 43d | 1 | 0.03mi |
| 3601 Holly Hills Blvd Apt 19 St. Louis, MO | 2.0 | 1.0 | 700 | $875 | $1.25 | 2d | 1 | 0.33mi |
| 128 Haven St Unit 2F St. Louis, MO | 2.0 | 1.0 | 900 | $950 | $1.06 | 10d | 1 | 0.40mi |
| 711 Wilmington Ave Unit NA St. Louis, MO | 2.0 | 1.0 | 1051 | $1,300 | $1.24 | 43d | 1 | 0.40mi |
| 712 Dover Pl Saint Louis, MO | 2.0 | 1.0 | 1100 | $900 | $0.82 | 43d | 1 | 0.44mi |
| 712 Dover Pl Unit 1FL St. Louis, MO | 2.0 | 1.0 | 1100 | $1,000 | $0.91 | 43d | 1 | 0.44mi |
| 7024 Pennsylvania Ave Unit F St. Louis, MO | 2.0 | 1.0 | 1081 | $930 | $0.86 | 16d | 1 | 0.51mi |
| 7417 Vermont Ave St. Louis, MO | 1.0–2.0 | 1.0–2.0 | 1144 | $1,600 | $1.40 | 1d | 8 | 0.58mi |
| 7417 Vermont Ave Unit 103 St. Louis, MO | 2.0 | 2.0 | 1069 | $1,500 | $1.40 | 14d | 1 | 0.59mi |
| 7109 Eugene Ave Saint Louis, MO | 3.0 | 2.0 | 1029 | $1,495 | $1.45 | 2d | 1 | 0.59mi |
| 125 Koeln Ave Saint Louis, MO | 2.0 | 1.0 | 833 | $1,499 | $1.80 | 43d | 1 | 0.71mi |
| 5707 Dewey Ave Unit 1F St. Louis, MO | 2.0 | 1.0 | 1000 | $1,050 | $1.05 | 14d | 1 | 0.71mi |
| 3815 Wilmington Ave Apt 2N St. Louis, MO | 2.0 | 1.0 | 800 | $1,095 | $1.37 | 43d | 1 | 0.72mi |
| 7614 Virginia Ave Unit 7614 St. Louis, MO | 2.0 | 1.0 | 750 | $750 | $1.00 | 23d | 1 | 0.74mi |
| 440 Eichelberger St Saint Louis, MO | 2.0 | 1.0 | 750 | $850 | $1.13 | 2d | 1 | 0.81mi |
| 5305 S Compton Ave St. Louis, MO | 2.0 | 1.0 | 750 | $825 | $1.10 | 43d | 1 | 0.81mi |
| 813 W Courtois St Apt C St. Louis, MO | 2.0 | 1.0 | 1000 | $895 | $0.90 | 43d | 1 | 0.82mi |
| 807 W Courtois St Apt D St. Louis, MO | 2.0 | 1.0 | 900 | $925 | $1.03 | 43d | 1 | 0.82mi |
| 5217 S Grand Blvd Saint Louis, MO | 2.0 | 1.0 | 870 | $1,125 | $1.29 | 14d | 1 | 0.86mi |
| 7851 Bandero Dr Saint Louis, MO | 1.0–2.0 | 1.0 | 800 | $1,100 | $1.38 | 11d | 1 | 0.89mi |
| 3824 Eiler St Saint Louis, MO | 2.0 | 1.0 | 1000 | $1,050 | $1.05 | 23d | 1 | 0.94mi |
| 5102 Wicklow Pl Saint Louis, MO | 2.0 | 1.5 | 928 | $1,350 | $1.45 | 23d | 1 | 0.95mi |
| 3243 Delor St Unit 3243 St. Louis, MO | 3.0 | 1.0 | 1100 | $1,250 | $1.14 | 21d | 1 | 1.01mi |
| 5111A S Broadway St St. Louis, MO | 2.0 | 1.0 | 800 | $825 | $1.03 | 23d | 1 | 1.02mi |
| 5109 S Broadway St Unit A St. Louis, MO | 2.0 | 1.0 | 800 | $825 | $1.03 | 23d | 1 | 1.03mi |
| 3324 Liberty St Saint Louis, MO | 2.0 | 1.0 | 1100 | $950 | $0.86 | 16d | 1 | 1.03mi |
| 3659 Delor St Unit 3659-1F St. Louis, MO | 2.0 | 1.5 | 900 | $1,115 | $1.24 | 43d | 1 | 1.04mi |
| 5027 S Broadway St Unit 5027 St. Louis, MO | 2.0 | 1.0 | 900 | $950 | $1.06 | 43d | 1 | 1.05mi |
| 3705 Delor St Unit 3705-1F St. Louis, MO | 2.0 | 1.5 | 900 | $1,225 | $1.36 | 43d | 1 | 1.05mi |
| 8125 Michigan Ave St. Louis, MO | 1.0–2.0 | 1.0–2.0 | 797 | $1,150 | $1.44 | 14d | 1 | 1.06mi |
| 7113 Leona St Saint Louis, MO | 3.0 | 1.0 | 864 | $1,765 | $2.04 | 43d | 1 | 1.07mi |
| 3717 Delor St Unit 37172-F St. Louis, MO | 2.0 | 1.5 | 900 | $1,115 | $1.24 | 23d | 1 | 1.07mi |
| 3661 Delor St Unit 3661-1F St. Louis, MO | 2.0 | 1.5 | 900 | $1,225 | $1.36 | 43d | 1 | 1.07mi |
| 3661 Delor St Unit 3661-2F St. Louis, MO | 2.0 | 1.5 | 900 | $1,115 | $1.24 | 43d | 1 | 1.07mi |
| 5009 S Broadway St Unit 5011A St. Louis, MO | 2.0 | 1.0 | 990 | $1,200 | $1.21 | 43d | 1 | 1.07mi |
| 3709 Delor St Unit 3709-1F St. Louis, MO | 2.0 | 1.5 | 900 | $1,225 | $1.36 | 43d | 1 | 1.08mi |
| 3711 Delor St Unit 3711-1F St. Louis, MO | 2.0 | 1.5 | 900 | $1,225 | $1.36 | 23d | 1 | 1.08mi |
| 3729 Delor St Unit 37292-F St. Louis, MO | 2.0 | 1.5 | 900 | $1,115 | $1.24 | 23d | 1 | 1.09mi |
| 3707a Delor St Unit 3707-2F St. Louis, MO | 2.0 | 1.5 | 900 | $1,115 | $1.24 | 43d | 1 | 1.09mi |
| 3737 Delor St Unit 3737-2F St. Louis, MO | 2.0 | 1.5 | 900 | $1,115 | $1.24 | 43d | 1 | 1.09mi |
Listing history 21 events
-
2026-06-18days on market $89,900 Active 76 DOM
-
2026-06-17days on market $89,900 Active 75 DOM
-
2026-06-16days on market $89,900 Active 74 DOM
-
2026-06-16price $89,900 Active 73 DOM
-
2026-06-15days on market $94,900 Active 73 DOM
-
2026-06-13days on market $94,900 Active 71 DOM
-
2026-06-09days on market $94,900 Active 67 DOM
-
2026-06-08days on market $94,900 Active 66 DOM
-
2026-06-08days on market $94,900 Active 65 DOM
-
2026-06-05days on market $94,900 Active 62 DOM
-
2026-06-03days on market $94,900 Active 61 DOM
-
2026-06-02days on market $94,900 Active 60 DOM
-
2026-06-01days on market $94,900 Active 59 DOM
-
2026-05-31days on market $94,900 Active 58 DOM
-
2026-04-21price $99,900 1066-char remark
Show marketing remark (1066 chars)
Located in the heart of South St. Louis, 6429 Idaho Avenue presents a fantastic opportunity for investors or buyers looking to build equity. This classic two-story home offers a flexible layout with three bedrooms and two full bathrooms, including two bedrooms and one full bath on the upper level, plus an additional bedroom and full bath on the main floor—ideal for multi-generational living or added rental potential. With its solid structure and traditional charm, this property is ready for your vision and updates. Whether you’re planning a renovation for resale, a long-term rental, or a personalized primary residence, the layout provides a strong foundation to maximize value. The main level bedroom and bath add convenience and versatility, while the second floor offers a more private sleeping area. Situated on a quiet residential street with easy access to local amenities, schools, and major thoroughfares, this home combines location with opportunity. Bring your ideas and unlock the full potential of this promising investment property.
-
2026-04-03$109,900 Active 1066-char remark
Show marketing remark (1066 chars)
Located in the heart of South St. Louis, 6429 Idaho Avenue presents a fantastic opportunity for investors or buyers looking to build equity. This classic two-story home offers a flexible layout with three bedrooms and two full bathrooms, including two bedrooms and one full bath on the upper level, plus an additional bedroom and full bath on the main floor—ideal for multi-generational living or added rental potential. With its solid structure and traditional charm, this property is ready for your vision and updates. Whether you’re planning a renovation for resale, a long-term rental, or a personalized primary residence, the layout provides a strong foundation to maximize value. The main level bedroom and bath add convenience and versatility, while the second floor offers a more private sleeping area. Situated on a quiet residential street with easy access to local amenities, schools, and major thoroughfares, this home combines location with opportunity. Bring your ideas and unlock the full potential of this promising investment property.
-
2024-03-20soldstatus $123,000
-
2007-07-10soldstatus $107,000
-
2007-01-04soldstatus $99,900
-
2006-06-07soldstatus $93,000
-
1991-07-03soldstatus
ⓘ Source: listings_history table (triggers on properties + properties_extension) + one-shot
backfill from property_details.listing_events for pre-trigger history.
Tax reassessment forecast MO · Resets to sale price
- Current annual tax
- $768 · $64/mo
- Projected year-2 tax
- $872 · $73/mo
- Expected delta
- +$104/yr (+$9/mo · 13.5%)
ⓘ Screening estimate from a state-policy table — verify with the county assessor before closing.
Climate risk First Street
- Flood 1/10 Low FEMA zone X (unshaded) · 0% chance over 30 yrs
- Wildfire 1/10 Low
- Heat 5/10 Major 7 d/yr ≥109°F today · 21 d/yr by 30 yrs out
- Wind 2/10 Low 100% chance of damaging wind over 30 yrs
- Air quality 3/10 Moderate 3 unhealthy d/yr today · 4 by 30 yrs out
Nearby sold comps map
Loading sold comps map…
Walkable amenities ~0.75 mi
Loading nearby amenities…
Taxation est. · year 1
- Rental income
- $13,231
- − Mortgage interest
- −$5,036
- − Property taxes
- −$768
- − Insurance
- −$450
- − Repairs & maintenance
- −$1,059
- − Management
- −$1,059
- − Depreciation
- −$2,615
- Taxable income
- $2,246
- Est. tax owed @ 24.0%
- −$539
- After-tax cash flow
- $3,039/yr
For passive investors: Depreciation is non-cash, so a rental often shows a tax loss while cash-flowing — sheltering income. Rental losses are passive: they offset passive income freely, and up to $25,000/yr can offset ordinary (W-2) income if you actively participate and your MAGI is under $100k (phasing out to $0 by $150k); unused losses carry forward. On sale, claimed depreciation is recaptured at up to 25%, and gains may owe capital-gains tax (a 1031 exchange can defer both). Figures are a year-1 estimate at your 24.0% rate — not tax advice; consult a CPA.
Schools (NCES district)
- District
- St. Louis City
- NCES district ID
- 2929280
- Math proficiency
- 10% ▼ -6.00%
- Reading proficiency
- 18% ▼ -3.00%
- Median HH income
- $35,685
- Composite
- 11.54/100
- National rank
- #9699
- State rank
- #312 of 324 in MO
Livability — St. Louis
No livability data for this city. (Only ~50 U.S. cities are tracked.)
Census & demographics
- Census place
- St. Louis, MO
- County
- Saint Louis City · 254,015 people
- City population
- 283,259
- Metro
- St. Louis, MO-IL
- Population (ZIP)
- 18,851
- Household income
- $47,039
- Rent vs Own
- Severe rent burden
- 1364.0
Population outlook (St. Louis County) Hauer SSP2
- Today (2025)
- 315,737 people
- By 2030
- 313,865 · -0.6%
- By 2040
- 305,439 · -3.3%
- By 2050
- 296,529 · -6.1%
- By 2075
- 271,028 · -14.2%
- By 2100
- 255,359 · -19.1%
Race, ethnicity, and origin ACS 2023
- Neighborhood character
- Diverse neighborhood (Simpson 0.65)
- Race & ethnicity
- Black 42% White 41% Two or more races 11% Hispanic / Latino 9% Asian 1%
- Hispanic origin (detail)
- Mexican 6%
- Common ancestry
- Lithuanian 3% Slovak 1% Romanian 1%
- Foreign-born
- 7% · Canada, India
- Languages at home
- 90% English-only · Spanish 7% Other Indo-European 1%
Political lean MEDSL · St. Louis
- 2024 margin
- Solid D (+64.7) · D 81.4% · R 16.7% · Other 2.0%
- 2008→2024 swing
- -3.5pp toward R · 2008: 68.2pp · 2024: 64.7pp
- All cycles
- 2024: D+64.7 2020: D+66.2 2016: D+63.7 2012: D+66.6 2008: D+68.2
Not yet ingested
- Civics
- —
Market trends
- HPI YoY
- ▼ -92.80%
- Current HPI
- 169.4644
- Rent YoY
- ▲ 3.27%
- Metro
- St. Louis, MO-IL
- State GDP YoY
- ▲ 1.84%
- F500 in state
- 20
Industry mix (Fortune 500 HQ in MO)
| Industry | F500 HQs | Revenue |
|---|---|---|
| Healthcare | 1 | $163B |
|
||
| Insurance | 1 | $21B |
|
||
| Industrial Technology | 1 | $17B |
|
||
| Retail | 1 | $16B |
|
||
| Industrial Distribution | 1 | $10B |
|
||
| Utilities | 1 | $9B |
|
||
Price history
+7.4% since first listed7 events — show timeline
- 2026-04-21 Price Changed $99,900 MARIS as Distributed by MLS Grid
- 2026-04-03 Listed $109,900 MARIS as Distributed by MLS Grid
- 2024-03-20 Sold (Public Records) $123,000 Public Records
- 2007-07-10 Sold (Public Records) $107,000 Public Records
- 2007-01-04 Sold (Public Records) $99,900 Public Records
- 2006-06-07 Sold (Public Records) $93,000 Public Records
- 1991-07-03 Sold (Public Records) — Public Records
Property tax history
+3.2%/yrLatest (2024): $768 · +5.0% YoY. Source: county tax records.
Cash-flow waterfall
monthlySold comps — $/sqft
last 12 mo · ≤1 miLoading sold comps…