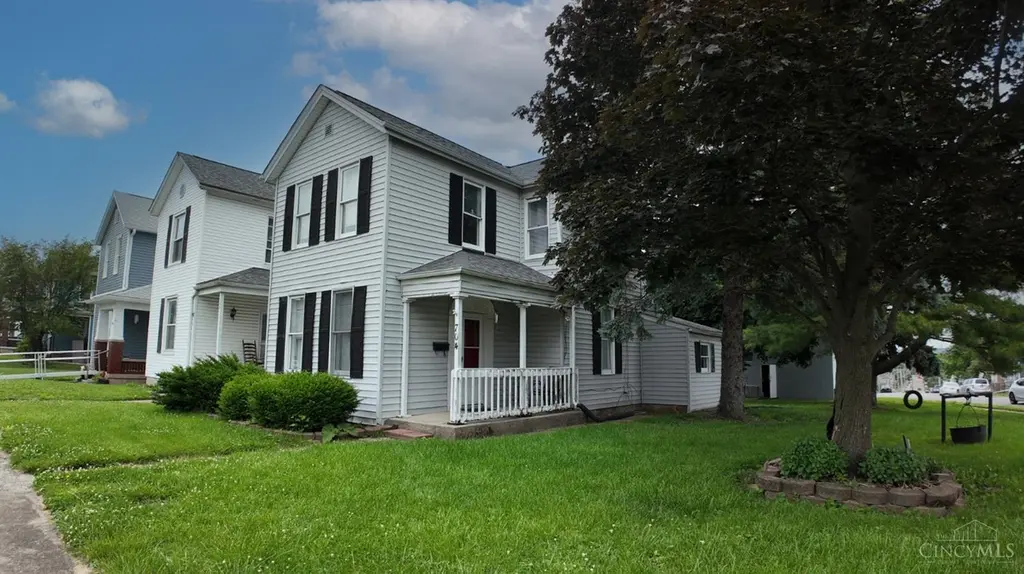
704 Prytania Ave · Hamilton, OH
Flood risk 1/10 · Minimal
- FEMA flood zone
- X (unshaded)
- Chance of flooding over 30 yrs
- 0.0%
- Est. flood insurance / yr
- $473 – $860
Fire risk 1/10 · Minimal
- Est. fire insurance / yr
- $713 – $1,323
Heat risk 4/10 · Minor
- Hot days now (above 104°F)
- 7 days/yr
- Hot days in 30 yrs
- 19 days/yr
Wind risk 2/10 · Minimal
- Chance of severe wind over 30 yrs
- 1.0%
Air-quality risk 3/10 · Minor
- Unhealthy air days now
- 2 days/yr
- Unhealthy air days in 30 yrs
- 3 days/yr
Risk factors via First Street. Map © Google.
Why this score? — see what drove the C grade
The composite is a weighted blend of 9 inputs, each scored 0–100. Each bar is that input's sub-score; the figure is the points it added to the 100-point composite (weight × sub-score).
- Cash flow +17.7/30.0
- ARV discount +15.0/15.0
- DSCR +5.5/10.0
- 1% rule +4.2/10.0
- Livability +3.7/5.0
- Schools +3.6/10.0
- Rent growth +3.4/5.0
- Condition / age +2.5/5.0
- Appreciation +0.0/10.0
$159,900
🖨 Deal sheet (PDF) 📄 Offer letter ✓ Due diligence
Listing remarks
Centrally located in Hamilton, this home puts you close to everything, and with a little bit of love, it has great potential. Enjoy being just minutes from Spooky Nook Sports Champion Mill, one of the largest indoor sports and entertainment complexes in the country. Dining and nightlife are right around the corner with top-rated spots like Agave & Rye and Billy Yanks on Main Street. This property has a wonderful oversized detached garage! Don't miss this opportunity for a great property in a great location!
Key facts
- Centrally located
- 4,792 sq ft lot
- 2 garage spots
Tags
Property features AI
Finance
- Other: Lease not considered
- HOA & community: No HOA
Exterior
- Parking: Detached oversized garage with 2 garage spaces; Off-street and on-street parking available
- Utilities: Public water; Public sewer; Natural gas
- Home design: Traditional style single-family home; Two levels
- Construction: Block and poured foundation
- Exterior features: Shingle roof; Aluminum and vinyl siding; Residential zoning
Interior
- Kitchen: Kitchen approximately 10 x 10
- Bedrooms: Two bedrooms total; Primary bedroom approximately 12 x 12 (second level); Second bedroom approximately 12 x 12 (second level)
- Bathrooms: One full bathroom on the main level
- Heating & cooling: Forced air heating (gas); Central air conditioning; Gas water heating
- Interior features: Total of 5 rooms; Crawl basement
Neighborhood map
What this means for you Summary
Snapshot
- This is a 2-bed/1.0-bath single-family listed at $160k.
Deal economics
- At list price, monthly cash flow is $129 ($2k/yr) — positive.
- The deal already cash-flows at list — no discount required.
- To meet the 1% rule (rent ≥ 1% of price), the offer needs to be $148k (7.7% below list).
- Recommended offer: $148k (7.7% below list) — sets the bar for 1% rule.
- Cap rate 7.3% vs local median 4.6% in Hamilton — top-decile yield for the area; either an underpriced asset or a hidden risk that comps aren't pricing in. Stress-test before assuming the spread holds.
Location & tenants
- Location reads 73/100 on livability (#332 in OH) — a middle-class / working-renter tenant base. Strengths: cost of living A+, housing A+, schools B; Watch: crime C-, amenities C-, employment D.
- Hamilton City (suburban): math 42% / reading 45% proficiency, ranked #517 of 656 in OH (top 79%) — families likely to look elsewhere, expect single-tenant / working-renter base with shorter leases; 63% free/reduced lunch — lower-income household profile, screen leases tightly.
- Market conditions: Rents rising (+3.7%/yr); 127 active listings in the ZIP; 18 comparable units currently listed for rent nearby; rentals leasing fast (median 5d on market — plan ~1-2 weeks tenant-placement turnaround); 1,163 units permitted in Butler County in 2024 (356 in 5+ unit buildings).
Forward outlook
- Local home prices are declining (-3.0%/yr); year-one equity from $1k of loan paydown is wiped out by about $5k of value loss. Plan a longer hold.
Negotiation context
- It's been on market 27 days — a 2% lower offer ($158k) is reasonable based on typical stale-listing flexibility.
Risks & watch-outs
- Watch-outs: built in 1930 — expect roof / HVAC / electrical / plumbing capex.
Questions for the listing agent
- Built in 1930 — when were the roof, HVAC, electrical panel, plumbing, and water heater last replaced?
- Is there a deadline driving the sale (1031 exchange, divorce, estate, relocation)? That informs how much negotiation room exists.
- Schools are B-rated — typically a magnet for longer-tenancy family renters. What's the average tenant stay here, and is there a school-zone premium baked into asking?
- What's the average days-on-market for RENTAL listings here right now (not sales)? A rising rental-DOM trend means longer vacancies and softer asking-rent achievability than the comps imply.
- What's the recent tenant-quality profile in this submarket — average credit score on applications, eviction rate, late-payment / NSF rate, and stable-employment percentage? A property-management company in the area should have these aggregated.
- How much new for-sale + rental construction is in the pipeline within 1–3 miles? Heavy new supply typically softens prices + rents 12–24 months out; constrained supply supports both.
Investment metrics
- 1% rule
- 0.92% ✗
- Cap rate
- 7.26%
- Cash-on-cash
- 3.47%
- DSCR
- 1.15
- GRM
- 9.0
CMA / ARV
- ARV (on-the-fly)
- $218,080
- Comps found
- 12
Show comp detail 12 sales within ~0.75 mi
| Address | Dist | Beds/Ba | Sqft | Sold | Price | $/sf | Match |
|---|---|---|---|---|---|---|---|
| 535 N D St | 0.16mi | 2/2.0 | 1,082 (-7%) | 0mo | $243,000 | $225 | 77 |
| 938 N F St | 0.31mi | 2/1.0 | 1,104 (-5%) | 3mo | $207,000 | $188 | 75 |
| 717 Cleveland Ave | 0.16mi | 3/1.0 (+1) | 1,050 (-10%) | 2mo | $173,000 | $165 | 70 |
| 918 Cleveland Ave | 0.22mi | 2/1.5 | 1,040 (-10%) | 2mo | $195,500 | $188 | 69 |
| 920 Webster Ave | 0.37mi | 3/1.0 (+1) | 1,216 (+5%) | 3mo | $206,000 | $169 | 67 |
| 519 Highland Pl | 0.20mi | 3/1.5 (+1) | 1,268 (+9%) | 3mo | $170,000 | $134 | 66 |
| 600 Haldimand Ave | 0.33mi | 3/1.0 (+1) | 1,000 (-14%) | 1mo | $200,000 | $200 | 56 |
| 309 N F St | 0.29mi | 3/1.0 (+1) | 988 (-15%) | 2mo | $215,000 | $218 | 55 |
| 39 Hermay Dr | 0.50mi | 2/1.5 | 1,330 (+15%) | 2mo | $249,900 | $188 | 49 |
| 805 Eaton Ave | 0.61mi | 3/1.5 (+1) | 1,280 (+10%) | 4mo | $189,000 | $148 | 44 |
| 150 Crowthers Dr | 0.65mi | 3/1.5 (+1) | 1,036 (-11%) | 2mo | $270,000 | $261 | 43 |
| 124 Gregory Ln | 0.65mi | 3/1.0 (+1) | 1,310 (+13%) | 2mo | $235,000 | $179 | 41 |
Match score weights: distance 35% · size 25% · config 20% · recency 20%. Top-matched comps best support the ARV.
Projected returns pro-forma
-3.0% appreciation · 3.69% rent growth · sell at horizon
- IRR
- -10.1%
- Equity multiple
- 0.63×
- Total profit
- $-16,657
- Equity at exit
- $23,842
- IRR
- 0.1%
- Equity multiple
- 1.01×
- Total profit
- $318
- Equity at exit
- $13,825
Cash invested: $44,772 (down + closing). Projections, not guarantees.
Landlord ↔ Tenant lean methodology
- Overall (STATE)
- 73 Landlord-Friendly
- State Ohio
- 73 Landlord-Friendly · R+6
- County
- — inherits STATE
- City
- — inherits STATE
ZIP-level market 45013
- Rents YoY
- 3.7%
- Active inventory
- 127
- Price-to-rent
- 9.0×
Monthly cashflow live
- Estimated rent
- $1,475 high interval (Pro) →
- Mortgage (P&I)
- −$839
- Tax from tax record
- −$131 /mo · $1,569/yr
- Insurance
- −$67
- HOA
- −$0
- Vacancy / Maint / Mgmt
- −$310
- Net cashflow
- $129
Break-even live
Sensitivity live
| Price | -10% $220 | -5% $175 | +0% $129 | +5% $84 | +10% $39 |
|---|---|---|---|---|---|
| Rent | -10% $13 | -5% $71 | +0% $129 | +5% $188 | +10% $246 |
| Rate | -1.0pp $210 | -0.5pp $170 | base $129 | +0.5pp $88 | +1.0pp $46 |
UW: 25.0% down · 7.5% · 30yr · 1.5% tax · 5.0% vac · 8.0% maint · 8.0% mgmt
Financing live
Cash to close
- Down payment
- $39,975
- Closing costs
- $4,797
- Reserves months
- —
- Total cash needed
- —
Loan-product check · same deal, 3 products live
Conventional
25% down · 7.5% · 30yr
- Down + closing
- —
- Monthly P&I
- —
- Monthly cashflow
- —
- DSCR
- —
- Eligible?
- —
Personal DTI + credit; lowest rate.
DSCR
20% down · 8.5% · 30yr
- Down + closing
- —
- Monthly P&I
- —
- Monthly cashflow
- —
- DSCR
- —
- Eligible?
- —
No personal income docs; deal must DSCR.
Hard money
10% down · 12.0% · 12mo
- Down + closing
- —
- Monthly P&I
- —
- Monthly cashflow
- —
- DSCR
- —
- Eligible?
- —
Short-term bridge; refi at stabilization.
Rent comps 18 comps
| Address | Beds | Baths | Sqft | Rent | $/sqft | DOM | Units | Dist |
|---|---|---|---|---|---|---|---|---|
| 901 Cleveland Ave Hamilton, OH | 3.0 | 1.5 | 1133 | $2,250 | $1.99 | 2d | 1 | 0.21mi |
| 547 Rhea Ave Hamilton, OH | 3.0 | 2.5 | 1412 | $2,300 | $1.63 | 44d | 1 | 0.39mi |
| 221 Eaton Ave Unit Up Hamilton, OH | 2.0 | 1.0 | 750 | $1,100 | $1.47 | 3d | 1 | 0.50mi |
| 217 Eaton Ave Unit Down Hamilton, OH | 1.0 | 1.0 | 1128 | $975 | $0.86 | 3d | 1 | 0.50mi |
| 432 Park Ave Hamilton, OH | 3.0 | 1.0 | 1276 | $1,300 | $1.02 | 3d | 1 | 0.54mi |
| 316 Main St Unit ROS-320 Hamilton, OH | 1.0 | 1.0 | 726 | $1,425 | $1.96 | 2d | 1 | 0.63mi |
| 316 Main St Unit ROS-113 Hamilton, OH | 1.0 | 1.0 | 800 | $1,350 | $1.69 | 20d | 1 | 0.63mi |
| 417 Franklin St Hamilton, OH | 3.0 | 1.0 | 1256 | $1,150 | $0.92 | 2d | 1 | 0.80mi |
| 661 Franklin St Unit Up Hamilton, OH | 1.0 | 1.0 | 700 | $1,000 | $1.43 | 3d | 1 | 0.80mi |
| 115 Dayton St Unit MAR-201 Hamilton, OH | 2.0 | 2.0 | 1040 | $1,775 | $1.71 | 4d | 1 | 0.80mi |
| 1023 Eaton Ave Hamilton, OH | 1.0–2.0 | 1.0 | 700 | $880 | $1.26 | 8d | 1 | 0.88mi |
| 906 Vine St Hamilton, OH | 3.0 | 2.0 | 1152 | $1,250 | $1.09 | 19d | 1 | 1.02mi |
| 1107 Hunt Ave Hamilton, OH | 2.0 | 1.0 | 704 | $1,095 | $1.56 | 2d | 1 | 1.11mi |
| 1151 NW Washington Blvd Hamilton, OH | 2.0 | 1.5 | 1046 | $1,200 | $1.15 | 2d | 1 | 1.15mi |
| 1025 Heaton St Hamilton, OH | 2.0 | 1.0 | 1436 | $1,025 | $0.71 | 24d | 1 | 1.28mi |
| 513 S 3rd St Unit 513 Hamilton, OH | 1.0 | 1.0 | 1000 | $850 | $0.85 | 11d | 1 | 1.30mi |
| 829 Maple Ave Apt 1 Hamilton, OH | 1.0 | 1.0 | 731 | $755 | $1.03 | 24d | 1 | 1.37mi |
| 829 Maple Ave Unit 3 Hamilton, OH | 3.0 | 1.0 | 1097 | $945 | $0.86 | 44d | 1 | 1.37mi |
Listing history 14 events
-
2026-06-18days on market $159,900 Active 27 DOM
-
2026-06-17days on market $159,900 Active 26 DOM
-
2026-06-16days on market $159,900 Active 25 DOM
-
2026-06-15days on market $159,900 Active 24 DOM
-
2026-06-13days on market $159,900 Active 22 DOM
-
2026-06-13days on market $159,900 Active 21 DOM
-
2026-06-09days on market $159,900 Active 18 DOM
-
2026-06-08pricedays on market $159,900 Active 17 DOM
-
2026-06-07days on market $169,900 Active 16 DOM
-
2026-06-03days on market $169,900 Active 12 DOM
-
2026-06-02days on market $169,900 Active 11 DOM
-
2026-06-01days on market $169,900 Active 10 DOM
-
2026-05-31days on market $169,900 Active 9 DOM
-
2026-05-22$169,900 Active
ⓘ Source: listings_history table (triggers on properties + properties_extension) + one-shot
backfill from property_details.listing_events for pre-trigger history.
Tax reassessment forecast OH · Partial reset (capped growth)
- Current annual tax
- $1,569 · $131/mo
- Projected year-2 tax
- $2,032 · $169/mo
- Expected delta
- +$463/yr (+$39/mo · 29.5%)
ⓘ Screening estimate from a state-policy table — verify with the county assessor before closing.
Climate risk First Street
- Flood 1/10 Low FEMA zone X (unshaded) · 0% chance over 30 yrs
- Wildfire 1/10 Low
- Heat 4/10 Moderate 7 d/yr ≥104°F today · 19 d/yr by 30 yrs out
- Wind 2/10 Low 100% chance of damaging wind over 30 yrs
- Air quality 3/10 Moderate 2 unhealthy d/yr today · 3 by 30 yrs out
Nearby sold comps map
Loading sold comps map…
Walkable amenities ~0.75 mi
Loading nearby amenities…
Taxation est. · year 1
- Rental income
- $17,702
- − Mortgage interest
- −$8,957
- − Property taxes
- −$1,569
- − Insurance
- −$800
- − Repairs & maintenance
- −$1,416
- − Management
- −$1,416
- − Depreciation
- −$4,652
- Taxable loss
- −$1,108
- Est. tax savings @ 24.0%
- +$266
- After-tax cash flow
- $1,819/yr
For passive investors: Depreciation is non-cash, so a rental often shows a tax loss while cash-flowing — sheltering income. Rental losses are passive: they offset passive income freely, and up to $25,000/yr can offset ordinary (W-2) income if you actively participate and your MAGI is under $100k (phasing out to $0 by $150k); unused losses carry forward. On sale, claimed depreciation is recaptured at up to 25%, and gains may owe capital-gains tax (a 1031 exchange can defer both). Figures are a year-1 estimate at your 24.0% rate — not tax advice; consult a CPA.
Schools (NCES district)
- District
- Hamilton City
- NCES district ID
- 3904410
- Math proficiency
- 42% ▼ -13.00%
- Reading proficiency
- 45% ▼ -10.00%
- Median HH income
- $40,488
- Composite
- 36.48/100
- National rank
- #4656
- State rank
- #517 of 656 in OH
Livability — Hamilton
- Score
- 73/100
- State rank
- #332
- US rank
- #5467
Category grades
Schools grade is shown separately in the Schools card above.
Census & demographics
- Census place
- Hamilton, OH
- County
- Butler County · 381,674 people
- City population
- 140,900
- Metro
- Cincinnati, OH-KY-IN
- Population (ZIP)
- 53,998
- Household income
- $73,633
- Rent vs Own
- Severe rent burden
- 1047.0
Population outlook (Butler County) Hauer SSP2
- Today (2025)
- 387,706 people
- By 2030
- 392,028 · +1.1%
- By 2040
- 395,307 · +2.0%
- By 2050
- 391,116 · +0.9%
- By 2075
- 378,642 · -2.3%
- By 2100
- 343,248 · -11.5%
Race, ethnicity, and origin ACS 2023
- Neighborhood character
- Predominantly White (88%)
- Race & ethnicity
- White 88% Two or more races 6% Hispanic / Latino 4% Black 3%
- Common ancestry
- Lithuanian 2% Romanian 2% Slovak 2%
- Foreign-born
- 2% · Canada
- Languages at home
- 97% English-only · Spanish 2%
Political lean MEDSL · Butler
- 2024 margin
- Strong R (+26.3) · D 36.4% · R 62.7%
- 2008→2024 swing
- -3.6pp toward R · 2008: -22.6pp · 2024: -26.3pp
- All cycles
- 2024: R+26.3 2020: R+24.0 2016: R+28.3 2012: R+26.2 2008: R+22.6
Not yet ingested
- Civics
- —
Market trends
- HPI YoY
- ▼ -210.85%
- Current HPI
- 237.0239
- Rent YoY
- ▲ 3.69%
- Metro
- Cincinnati, OH-KY-IN
- State GDP YoY
- ▲ 1.98%
- F500 in state
- 48
Industry mix (Fortune 500 HQ in OH)
| Industry | F500 HQs | Revenue |
|---|---|---|
| Insurance | 3 | $145B |
|
||
| Industrial Machinery | 3 | $49B |
|
||
| Financial Services | 3 | $24B |
|
||
| Consumer Goods | 2 | $93B |
|
||
| Aerospace / Defense | 2 | $47B |
|
||
| Utilities | 2 | $33B |
|
||
Price history
1 event — show timeline
- 2026-05-22 Listed $169,900 Cincy MLS
Property tax history
+2.8%/yrLatest (2025): $1,569 · +0.5% YoY. Source: county tax records.
Cash-flow waterfall
monthlySold comps — $/sqft
last 12 mo · ≤1 miLoading sold comps…