2719 Fm 524 · Van Vleck, TX
Flood risk 1/10 · Minimal
- FEMA flood zone
- X (unshaded)
- Chance of flooding over 30 yrs
- 0.0%
- Est. flood insurance / yr
- $507 – $1,088
Fire risk 4/10 · Minor
- Est. fire insurance / yr
- $1,222 – $2,270
Heat risk 9/10 · Severe
- Hot days now (above 109°F)
- 7 days/yr
- Hot days in 30 yrs
- 24 days/yr
Wind risk 9/10 · Severe
- Chance of severe wind over 30 yrs
- 99.0%
Air-quality risk 2/10 · Minimal
- Unhealthy air days now
- 1 days/yr
- Unhealthy air days in 30 yrs
- 1 days/yr
Risk factors via First Street. Map © Google.
Why this score? — see what drove the C+ grade
The composite is a weighted blend of 9 inputs, each scored 0–100. Each bar is that input's sub-score; the figure is the points it added to the 100-point composite (weight × sub-score).
- Cash flow +23.7/30.0
- Appreciation +10.0/10.0
- DSCR +7.6/10.0
- ARV discount +7.5/15.0
- 1% rule +6.2/10.0
- Schools +3.0/10.0
- Livability +2.8/5.0
- Rent growth +2.5/5.0
- Condition / age +1.0/5.0
$137,900
🖨 Deal sheet 📄 Offer letter ✓ Due diligence
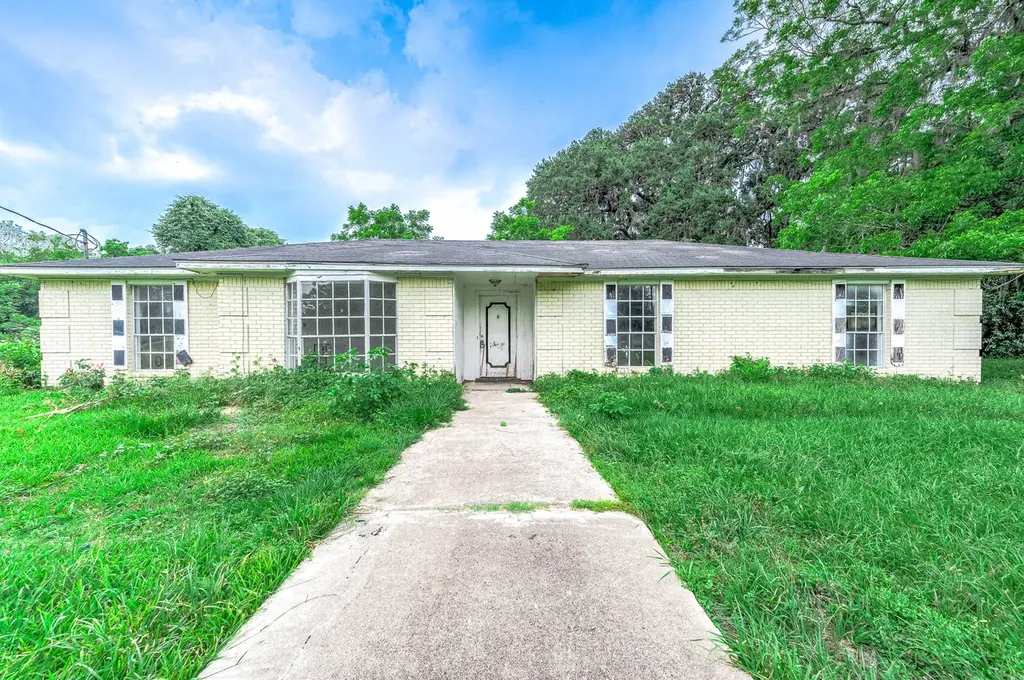
Listing remarks
Attention investors and homebuyers looking for a property with great potential! Situated on 1.5 acres, this 3-bedroom, 2-bath home also features an office and utility area. NO HOA!! While the home does need significant work and updates, it is priced below market value and offers endless possibilities for renovation, customization, or investment. Whether you are looking to remodel and create your dream home or add to your investment portfolio, this property is full of opportunity and is a must-see!
Key facts
- Office
- Utility area
- Customization
Tags
Property features AI
Finance
- Financial info: Lease not considered
Exterior
- Utilities: Well water; Septic tank sewer
- Home design: Residential property
- Construction: Brick construction; Built in 1973; Slab foundation; Composition roof
- Exterior features: Lot about 1.5 acres; Lot features: Other
Interior
- Bedrooms: Primary bedroom on the first level; Two additional bedrooms on the first level (each about 10 x 9)
- Bathrooms: Two full bathrooms, including a primary bathroom on the first level
- Heating & cooling: Central air conditioning; Gas cooling; Propane heating
- Interior features: Five total rooms; Seller disclosure available
Neighborhood map
What this means for you Summary
Snapshot
- This is a 3-bed/2.0-bath single-family listed at $138k. Condition is rated poor.
Deal economics
- At list price, monthly cash flow is $263 ($3k/yr) — positive.
- The deal already cash-flows at list — no discount required.
- Meets the 1% rule at list price ($2k rent vs $138k).
- Recommended offer: $134k (3.0% below list) — sets the bar for market timing.
Location & tenants
- Location reads 56/100 on livability (#1,294 in TX) — a working-class tenant base; expect higher turnover. Strengths: cost of living A+, crime A; Watch: employment D, amenities F, commute F.
- Columbia-Brazoria ISD (town): math 35% / reading 33% proficiency, ranked #513 of 826 in TX (top 62%) — families likely to look elsewhere, expect single-tenant / working-renter base with shorter leases.
- Zoned schools: West Columbia El (math 47% / reading 39%, grade F, #1,283 of 4,322 statewide, top 30%, 709 students, 60% FRL); West Brazos J H (math 34% / reading 32%, grade F, #930 of 1,662 statewide, top 57%, 676 students, 65% FRL); Columbia H S (math 13% / reading 28%, grade F, #1,389 of 1,632 statewide, top 86%, 889 students, 60% FRL).
- Market conditions: 113 active listings in the ZIP; 3,960 units permitted in Brazoria County in 2024 (593 in 5+ unit buildings).
Forward outlook
- In year one you build about $15k of equity ($953 loan paydown + $14k appreciation (10.0% local appreciation)).
- Brazoria County population projected at +44% by 2050 — long-run rental-demand tailwind backs the buy-and-hold thesis.
- At projected returns (10.0% appreciation + 3.0% rent growth), your $39k cash investment doubles in ~3 years — after that, you're playing with house money.
- By year 3, paydown + projected appreciation supports a ~$37k cash-out refi (75% LTV) — recoverable capital for the next deal without selling this one.
Negotiation context
- It's been on market 34 days — a 3% lower offer ($134k) is reasonable based on typical stale-listing flexibility.
Risks & watch-outs
- Climate carrying-cost: severe wind risk, 99% chance of damaging wind over 30y; extreme-heat days projected 7→24/yr by 2055 (HVAC capex compounding) — expect insurance premiums to compound above CPI over the hold.
Questions for the listing agent
- It's been on market 34 days. Have you received any prior offers? Is the seller open to a 3% concession, seller financing, or rate buy-down credit?
- Have any recent inspections been done? Can we get a copy of the seller's disclosures and any deferred-maintenance estimates?
- Built in 1973 — when were the roof, HVAC, electrical panel, plumbing, and water heater last replaced?
- Is there a deadline driving the sale (1031 exchange, divorce, estate, relocation)? That informs how much negotiation room exists.
- Schools are D-rated, which usually means shorter tenancies and higher turnover. Who's the typical renter profile here, and what's been the actual vacancy rate?
- What's the average days-on-market for RENTAL listings here right now (not sales)? A rising rental-DOM trend means longer vacancies and softer asking-rent achievability than the comps imply.
- What's the recent tenant-quality profile in this submarket — average credit score on applications, eviction rate, late-payment / NSF rate, and stable-employment percentage? A property-management company in the area should have these aggregated.
- How much new for-sale + rental construction is in the pipeline within 1–3 miles? Heavy new supply typically softens prices + rents 12–24 months out; constrained supply supports both.
Investment metrics
- 1% rule
- 1.12% ✓
- Cap rate
- 8.58%
- Cash-on-cash
- 8.16%
- DSCR
- 1.36
- GRM
- 7.5
CMA / ARV
- ARV (median comp)
- $360,946
- List price
- $137,900
- Delta
- -61.79%
- Verdict
- UNDERPRICED
- Comps
- 4 within 1.0 mi
Projected returns pro-forma
10.0% appreciation · 3.0% rent growth · sell at horizon
- IRR
- 30.2%
- Equity multiple
- 3.38×
- Total profit
- $91,859
- Equity at exit
- $124,231
- IRR
- 26.2%
- Equity multiple
- 7.67×
- Total profit
- $257,398
- Equity at exit
- $267,909
Cash invested: $38,612 (down + closing). Projections, not guarantees.
Landlord ↔ Tenant lean methodology
- Overall (STATE)
- 87 Strongly Landlord-Friendly
- State Texas
- 87 Strongly Landlord-Friendly · R+5
- County
- — inherits STATE
- City
- — inherits STATE
ZIP-level market 77480
- Home prices YoY
- 12.0%
- Active inventory
- 113
- Price-to-rent
- 7.5×
Monthly cashflow live
- Estimated rent
- $1,539 medium interval (Pro) →
- Mortgage (P&I)
- −$723
- Tax est. 1.5%
- −$172 /mo · $2,068/yr
- Insurance
- −$57
- HOA
- −$0
- Vacancy / Maint / Mgmt
- −$323
- Net cashflow
- $263
Break-even live
UW: 25.0% down · 7.5% · 30yr · 1.5% tax · 5.0% vac · 8.0% maint · 8.0% mgmt
Financing live
Cash to close
- Down payment
- $34,475
- Closing costs
- $4,137
- Reserves months
- —
- Total cash needed
- —
Loan-product check · same deal, 3 products live
Conventional
25% down · 7.5% · 30yr
- Down + closing
- —
- Monthly P&I
- —
- Monthly cashflow
- —
- DSCR
- —
- Eligible?
- —
Personal DTI + credit; lowest rate.
DSCR
20% down · 8.5% · 30yr
- Down + closing
- —
- Monthly P&I
- —
- Monthly cashflow
- —
- DSCR
- —
- Eligible?
- —
No personal income docs; deal must DSCR.
Hard money
10% down · 12.0% · 12mo
- Down + closing
- —
- Monthly P&I
- —
- Monthly cashflow
- —
- DSCR
- —
- Eligible?
- —
Short-term bridge; refi at stabilization.
Listing history 15 events
-
2026-06-18days on market $137,900 Active 34 DOM
-
2026-06-17days on market $137,900 Active 33 DOM
-
2026-06-16days on market $137,900 Active 32 DOM
-
2026-06-15days on market $137,900 Active 31 DOM
-
2026-06-13days on market $137,900 Active 29 DOM
-
2026-06-13days on market $137,900 Active 28 DOM
-
2026-06-09days on market $137,900 Active 25 DOM
-
2026-06-08days on market $137,900 Active 24 DOM
-
2026-06-07days on market $137,900 Active 23 DOM
-
2026-06-04days on market $137,900 Active 20 DOM
-
2026-06-03days on market $137,900 Active 19 DOM
-
2026-06-02days on market $137,900 Active 18 DOM
-
2026-06-01days on market $137,900 Active 17 DOM
-
2026-05-31days on market $137,900 Active 16 DOM
-
2026-05-15$137,900 Active 503-char remark
ⓘ Source: listings_history table (triggers on properties + properties_extension) + one-shot
backfill from property_details.listing_events for pre-trigger history.
Climate risk First Street
- Flood 1/10 Low FEMA zone X (unshaded) · 0% chance over 30 yrs
- Wildfire 4/10 Moderate
- Heat 9/10 Extreme 7 d/yr ≥109°F today · 24 d/yr by 30 yrs out
- Wind 9/10 Extreme 99% chance of damaging wind over 30 yrs
- Air quality 2/10 Low 1 unhealthy d/yr today · 1 by 30 yrs out
Nearby sold comps map
Loading sold comps map…
Walkable amenities ~0.75 mi
Loading nearby amenities…
Taxation est. · year 1
- Rental income
- $18,466
- − Mortgage interest
- −$7,725
- − Property taxes
- −$2,068
- − Insurance
- −$690
- − Repairs & maintenance
- −$1,477
- − Management
- −$1,477
- − Depreciation
- −$4,012
- Taxable income
- $1,018
- Est. tax owed @ 24.0%
- −$244
- After-tax cash flow
- $2,908/yr
For passive investors: Depreciation is non-cash, so a rental often shows a tax loss while cash-flowing — sheltering income. Rental losses are passive: they offset passive income freely, and up to $25,000/yr can offset ordinary (W-2) income if you actively participate and your MAGI is under $100k (phasing out to $0 by $150k); unused losses carry forward. On sale, claimed depreciation is recaptured at up to 25%, and gains may owe capital-gains tax (a 1031 exchange can defer both). Figures are a year-1 estimate at your 24.0% rate — not tax advice; consult a CPA.
Condition & rehab AI · 14 photos
This property requires extensive repairs and updates, including a new roof, exterior painting, HVAC system replacement, and landscaping. While it offers great potential, the current condition significantly impacts its value.
Repairs flagged
- Major roof — The roof is visibly damaged with missing shingles and requires full replacement.
- Major exterior walls — The exterior walls are in poor condition with peeling paint and visible damage.
- Major flooring — The flooring is in poor condition with visible damage and wear.
- Major interior walls — The interior walls are in poor condition with visible damage and peeling paint.
- Major HVAC system — The HVAC system is in poor condition with visible damage and missing components.
Value-add opportunities
- Resale roof replacement — A new roof will significantly improve the home's curb appeal and increase its resale value.
- Resale exterior painting — New paint will improve the home's curb appeal and increase its resale value.
- Both HVAC system replacement — A new HVAC system will improve the home's comfort and energy efficiency, benefiting both resale and rental value.
- Both landscaping — A well-maintained landscape will improve the home's curb appeal and increase its resale and rental value.
Renovation cost estimate screening
| Repair item | Severity | Est. cost |
|---|---|---|
| roof · The roof is visibly damaged with missing shingles and requires full replacement. | Major | $15,000–50,000 |
| exterior walls · The exterior walls are in poor condition with peeling paint and visible damage. | Major | $15,000–50,000 |
| flooring · The flooring is in poor condition with visible damage and wear. | Major | $15,000–50,000 |
| interior walls · The interior walls are in poor condition with visible damage and peeling paint. | Major | $15,000–50,000 |
| HVAC system · The HVAC system is in poor condition with visible damage and missing components. | Major | $15,000–50,000 |
| Total estimated repair cost · 5 items | $75,000–250,000 |
Value-add ROI direction
- Resale roof replacement — A new roof will significantly improve the home's curb appeal and increase its resale value. ↑
- Resale exterior painting — New paint will improve the home's curb appeal and increase its resale value. ↑
- Both HVAC system replacement — A new HVAC system will improve the home's comfort and energy efficiency, benefiting both resale and rental value. ↑
- Both landscaping — A well-maintained landscape will improve the home's curb appeal and increase its resale and rental value. ↑
ⓘ Cost ranges are severity-bucket heuristics (US national rule-of-thumb). Get contractor quotes + a written scope before underwriting a rehab budget.
Schools (NCES district)
- District
- Columbia-Brazoria ISD
- NCES district ID
- 4814670
- Math proficiency
- 35% ▼ -4.00%
- Reading proficiency
- 33% ▼ -1.00%
- Median HH income
- $57,256
- Composite
- 30.23/100
- National rank
- #6297
- State rank
- #513 of 826 in TX
Livability — Van Vleck
- Score
- 56/100
- State rank
- #1294
- US rank
- #22487
Category grades
Schools grade is shown separately in the Schools card above.
Census & demographics
- Population (ZIP)
- 8,252
Population outlook (Brazoria County) Hauer SSP2
- Today (2025)
- 420,414 people
- By 2030
- 457,585 · +8.8%
- By 2040
- 532,232 · +26.6%
- By 2050
- 605,399 · +44.0%
- By 2075
- 779,358 · +85.4%
- By 2100
- 883,759 · +110.2%
Race, ethnicity, and origin ACS 2023
- Neighborhood character
- Predominantly White (71%)
- Race & ethnicity
- White 71% Hispanic / Latino 17% Black 8% Two or more races 7% Asian 1%
- Hispanic origin (detail)
- Mexican 16%
- Common ancestry
- Italian 3% Slovak 3% Iranian 1%
- Foreign-born
- 4% · Canada, China
- Languages at home
- 90% English-only · Spanish 9% Tagalog/Filipino 1%
Political lean MEDSL · Brazoria
- 2024 margin
- R (+19.7) · D 39.5% · R 59.2% · Other 1.3%
- 2008→2024 swing
- +9.9pp toward D · 2008: -29.6pp · 2024: -19.7pp
- All cycles
- 2024: R+19.7 2020: R+18.2 2016: R+24.6 2012: R+34.2 2008: R+29.6
Not yet ingested
- Civics
- —
Market trends
- HPI YoY
- ▲ 35.27%
- Current HPI
- 328.8657
- Rent YoY
- —
- Metro
- —
- State GDP YoY
- ▲ 3.95%
- F500 in state
- 110
Industry mix (Fortune 500 HQ in TX)
| Industry | F500 HQs | Revenue |
|---|---|---|
| Energy | 16 | $1,198B |
|
||
| Technology | 5 | $198B |
|
||
| Engineering / Construction | 4 | $72B |
|
||
| Energy Services | 3 | $60B |
|
||
| Utilities | 3 | $41B |
|
||
| Healthcare | 2 | $330B |
|
||
Price history
1 event — show timeline
- 2026-05-15 Listed $137,900 HARMLS
Cash-flow waterfall
monthlySold comps — $/sqft
last 12 mo · ≤1 miLoading sold comps…