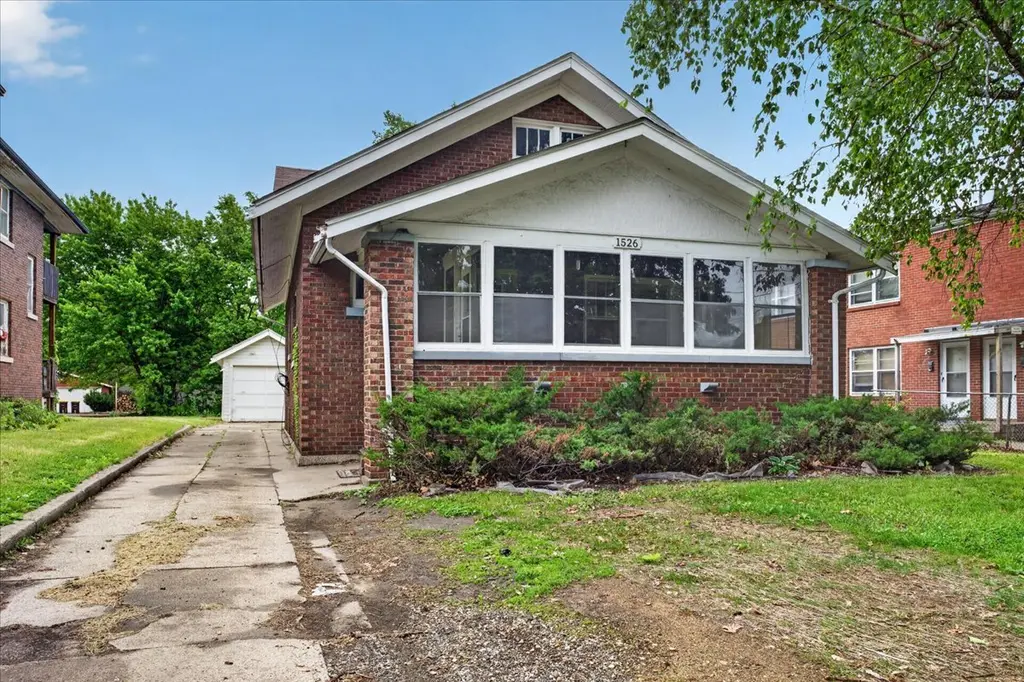
1526 10th St · Rockford, IL
Flood risk 1/10 · Minimal
- FEMA flood zone
- X (unshaded)
- Chance of flooding over 30 yrs
- 0.0%
- Est. flood insurance / yr
- $473 – $860
Fire risk 1/10 · Minimal
- Est. fire insurance / yr
- $804 – $1,492
Heat risk 3/10 · Minor
- Hot days now (above 101°F)
- 7 days/yr
- Hot days in 30 yrs
- 15 days/yr
Wind risk 2/10 · Minimal
- Chance of severe wind over 30 yrs
- —
Air-quality risk 2/10 · Minimal
- Unhealthy air days now
- 1 days/yr
- Unhealthy air days in 30 yrs
- 2 days/yr
Risk factors via First Street. Map © Google.
Why this score? — see what drove the C grade
The composite is a weighted blend of 9 inputs, each scored 0–100. Each bar is that input's sub-score; the figure is the points it added to the 100-point composite (weight × sub-score).
- Cash flow +23.8/30.0
- ARV discount +8.4/15.0
- DSCR +7.7/10.0
- 1% rule +5.8/10.0
- Rent growth +4.9/5.0
- Livability +3.1/5.0
- Condition / age +2.5/5.0
- Schools +1.2/10.0
- Appreciation +0.0/10.0
$104,000
🖨 Deal sheet (PDF) 📄 Offer letter ✓ Due diligence
Listing remarks MLS
Located just off Broadway on 10th Street, this charming bungalow offers character and comfort throughout. Features include 2 bedrooms, 1 full bathroom, hardwood floors, and beautiful original woodwork. The enclosed front porch provides additional living space perfect for relaxing or entertaining. Spacious kitchen includes updated flooring and a tile backsplash. One bedroom features an attached walk-in closet for added storage. Rear entrance leads to a partially fenced backyard and detached 1-car garage. Unfinished basement offers excellent storage space and additional potential. Convenient location close to shopping, dining, and everyday amenities.
Key facts
- Updated flooring
- Tile backsplash
- Enclosed front porch
Tags
Property features AI
Exterior
- Parking: Detached 1-car garage
- Utilities: Public water; Public sewer
- Home design: Single-family residential house
- Construction: Brick construction
- Exterior features: Shingle roof; Lot approximately 0.18 acre
Interior
- Kitchen: Gas cooktop; Refrigerator
- Bathrooms: One full bathroom (main level)
- Heating & cooling: Forced air heating (natural gas); Central air conditioning
- Interior features: Gas cooktop; Refrigerator; Gas water heater; Full basement
Neighborhood map
What this means for you Summary
Snapshot
- This is a 2-bed/1.0-bath single-family listed at $104k.
Deal economics
- At list price, monthly cash flow is $200 ($2k/yr) — positive.
- The deal already cash-flows at list — no discount required.
- Meets the 1% rule at list price ($1k rent vs $104k).
- Cap rate 8.6% vs local median 6.1% in Rockford — top-decile yield for the area; either an underpriced asset or a hidden risk that comps aren't pricing in. Stress-test before assuming the spread holds.
Location & tenants
- Location reads 62/100 on livability (#876 in IL) — a middle-class / working-renter tenant base. Strengths: cost of living A+, housing A+, health & safety A+; Watch: crime F, amenities F, commute F.
- Rockford SD 205 (urban): math 12% / reading 16% proficiency, ranked #533 of 620 in IL (top 86%) — low school quality limits family demand, transient renter base, plan for 1-2y turnover; 73% free/reduced lunch — lower-income household profile, screen leases tightly.
- Zoned schools: Constance Lane Elementary School (math 2% / reading 2%, grade F, #1,927 of 2,056 statewide, top 100%, 573 students, 0% FRL); Abraham Lincoln Middle School (math 3% / reading 7%, grade F, #636 of 665 statewide, top 98%, 699 students, 0% FRL); Jefferson High School (math 3% / reading 9%, grade F, #608 of 693 statewide, top 88%, 2,114 students, 0% FRL) — zoned schools average 0% FRL vs 73% district-wide (73 pts lower); this property's tenant base skews higher-income than the district average.
- Market conditions: Rents rising fast (+9.7%/yr); 67 active listings in the ZIP; 29 comparable units currently listed for rent nearby; rentals lingering (median 45d on market — plan ~5-8 weeks vacancy on turnover, expect pricing pressure); 69% of comp listings sitting > 30 days — soft ceiling on asking rent; lower-income renter base — watch delinquency; 285 units permitted in Winnebago County in 2024 (0 in 5+ unit buildings).
- This rent runs 40% of the median local income ($34k/yr) — at the standard rent-burdened threshold; future hikes will face affordability resistance.
Forward outlook
- Local home prices are declining (-3.0%/yr); year-one equity from $719 of loan paydown is wiped out by about $3k of value loss. Plan a longer hold.
- Winnebago County population projected at -20% by 2050 — secular population decline; favor cash flow + early exit over multi-decade hold.
- At projected returns (-3.0% appreciation + 8.0% rent growth), your $29k cash investment doubles in ~8 years — after that, you're playing with house money.
Negotiation context
- Only 3 days on market — expect competitive offers; lowballing is unlikely to land.
- 5 sale attempts since 16y ago with the ask held roughly flat each time — persistent listings suggest the price (not the market) is what's stuck; bring a comps-based counter.
- Current owner paid $20k; list at $104k implies a 420% gain — meaningful room to come down on a strong offer.
Risks & watch-outs
- Watch-outs: built in 1921 — expect roof / HVAC / electrical / plumbing capex.
Questions for the listing agent
- Built in 1921 — when were the roof, HVAC, electrical panel, plumbing, and water heater last replaced?
- Is there a deadline driving the sale (1031 exchange, divorce, estate, relocation)? That informs how much negotiation room exists.
- Schools are F-rated, which usually means shorter tenancies and higher turnover. Who's the typical renter profile here, and what's been the actual vacancy rate?
- Crime grade is F in this area — have there been break-ins, vandalism, or insurance claims at this property in the last 3 years? What carrier currently insures it and at what premium?
- What's the average days-on-market for RENTAL listings here right now (not sales)? A rising rental-DOM trend means longer vacancies and softer asking-rent achievability than the comps imply.
- What's the recent tenant-quality profile in this submarket — average credit score on applications, eviction rate, late-payment / NSF rate, and stable-employment percentage? A property-management company in the area should have these aggregated.
- How much new for-sale + rental construction is in the pipeline within 1–3 miles? Heavy new supply typically softens prices + rents 12–24 months out; constrained supply supports both.
Investment metrics
- 1% rule
- 1.08% ✓
- Cap rate
- 8.60%
- Cash-on-cash
- 8.25%
- DSCR
- 1.37
- GRM
- 7.7
CMA / ARV
- ARV (on-the-fly)
- $106,080
- Comps found
- 12
Show comp detail 12 sales within ~0.75 mi
| Address | Dist | Beds/Ba | Sqft | Sold | Price | $/sf | Match |
|---|---|---|---|---|---|---|---|
| 1526 10th St | 0.00mi | 2/1.0 | 1,040 (0%) | 0mo | $104,000 | $100 | 100 |
| 2019 15th Ave | 0.57mi | 2/1.0 | 1,032 (-1%) | 3mo | $96,000 | $93 | 70 |
| 1212 10th Ave | 0.38mi | 3/1.0 (+1) | 1,064 (+2%) | 4mo | $125,000 | $117 | 70 |
| 1522 18th Ave | 0.27mi | 3/1.5 (+1) | 1,128 (+8%) | 2mo | $80,000 | $71 | 65 |
| 1622 10th Ave | 0.44mi | 3/1.0 (+1) | 1,014 (-2%) | 8mo | $110,000 | $108 | 64 |
| 1348 Woodruff Ave | 0.45mi | 2/1.5 | 1,078 (+4%) | 9mo | $41,000 | $38 | 63 |
| 918 11th St | 0.46mi | 2/1.5 | 1,134 (+9%) | 8mo | $85,000 | $75 | 54 |
| 2220 15th Ave | 0.75mi | 2/2.0 | 990 (-5%) | 2mo | $160,000 | $162 | 51 |
| 2223 13th Ave | 0.74mi | 3/1.5 (+1) | 1,001 (-4%) | 7mo | $150,000 | $150 | 46 |
| 2120 S 6th St | 0.58mi | 3/1.0 (+1) | 1,176 (+13%) | 5mo | $120,000 | $102 | 42 |
| 2106 S 5th St | 0.62mi | 3/1.0 (+1) | 1,183 (+14%) | 10mo | $85,000 | $72 | 35 |
| 1644 6th Ave | 0.70mi | 3/2.5 (+1) | 1,190 (+14%) | 7mo | $145,000 | $122 | 26 |
Match score weights: distance 35% · size 25% · config 20% · recency 20%. Top-matched comps best support the ARV.
Projected returns pro-forma
-3.0% appreciation · 8.0% rent growth · sell at horizon
- IRR
- 1.6%
- Equity multiple
- 1.06×
- Total profit
- $1,819
- Equity at exit
- $15,507
- IRR
- 15.5%
- Equity multiple
- 2.54×
- Total profit
- $44,955
- Equity at exit
- $8,992
Cash invested: $29,120 (down + closing). Projections, not guarantees.
Landlord ↔ Tenant lean methodology
- Overall (STATE)
- 43 Moderately Tenant-Leaning
- State Illinois
- 43 Moderately Tenant-Leaning · D+7
- County
- — inherits STATE
- City
- — inherits STATE
ZIP-level market 61104
- Home prices YoY
- -21.4%
- Rents YoY
- 9.7%
- Active inventory
- 67
- Price-to-rent
- 7.7×
Monthly cashflow live
- Estimated rent
- $1,121 high interval (Pro) →
- Mortgage (P&I)
- −$545
- Tax from tax record
- −$97 /mo · $1,161/yr
- Insurance
- −$43
- HOA
- −$0
- Vacancy / Maint / Mgmt
- −$235
- Net cashflow
- $200
Break-even live
Sensitivity live
| Price | -10% $259 | -5% $230 | +0% $200 | +5% $171 | +10% $141 |
|---|---|---|---|---|---|
| Rent | -10% $112 | -5% $156 | +0% $200 | +5% $244 | +10% $289 |
| Rate | -1.0pp $253 | -0.5pp $227 | base $200 | +0.5pp $173 | +1.0pp $146 |
UW: 25.0% down · 7.5% · 30yr · 1.5% tax · 5.0% vac · 8.0% maint · 8.0% mgmt
Financing live
Cash to close
- Down payment
- $26,000
- Closing costs
- $3,120
- Reserves months
- —
- Total cash needed
- —
Loan-product check · same deal, 3 products live
Conventional
25% down · 7.5% · 30yr
- Down + closing
- —
- Monthly P&I
- —
- Monthly cashflow
- —
- DSCR
- —
- Eligible?
- —
Personal DTI + credit; lowest rate.
DSCR
20% down · 8.5% · 30yr
- Down + closing
- —
- Monthly P&I
- —
- Monthly cashflow
- —
- DSCR
- —
- Eligible?
- —
No personal income docs; deal must DSCR.
Hard money
10% down · 12.0% · 12mo
- Down + closing
- —
- Monthly P&I
- —
- Monthly cashflow
- —
- DSCR
- —
- Eligible?
- —
Short-term bridge; refi at stabilization.
Rent comps 29 comps
| Address | Beds | Baths | Sqft | Rent | $/sqft | DOM | Units | Dist |
|---|---|---|---|---|---|---|---|---|
| 1524 Broadway Unit 1526-8 Rockford, IL | 1.0 | 1.0 | 700 | $850 | $1.21 | 44d | 1 | 0.13mi |
| 1530 Broadway Unit 1532-1 Rockford, IL | 1.0 | 1.0 | 700 | $875 | $1.25 | 22d | 1 | 0.14mi |
| 1519 17th Ave Rockford, IL | 3.0 | 2.0 | 1500 | $1,600 | $1.07 | 14d | 1 | 0.25mi |
| 1119 9th Ave Unit 1W Rockford, IL | 3.0 | 1.0 | 1155 | $1,600 | $1.39 | 44d | 1 | 0.44mi |
| 1310 Home Pl Unit 1 Rockford, IL | 1.0 | 1.0 | 831 | $700 | $0.84 | 44d | 1 | 0.48mi |
| 914 18th Ave Rockford, IL | 2.0 | 1.0 | 1123 | $900 | $0.80 | 44d | 1 | 0.50mi |
| 810 15th Ave Unit 810-3 Rockford, IL | 2.0 | 1.0 | 1000 | $995 | $0.99 | 22d | 1 | 0.50mi |
| 810 15th Ave Unit 810-1 Rockford, IL | 2.0 | 1.0 | 1000 | $995 | $0.99 | 44d | 1 | 0.50mi |
| 1211 21st Pl Rockford, IL | 2.0 | 1.0 | 1040 | $1,350 | $1.30 | 44d | 1 | 0.62mi |
| 1209 21st Pl Rockford, IL | 2.0 | 1.0 | 1040 | $1,350 | $1.30 | 44d | 1 | 0.62mi |
| 2217 8th St Rockford, IL | 3.0 | 1.0 | 1260 | $1,500 | $1.19 | 44d | 1 | 0.63mi |
| 1420 22nd Ave Rockford, IL | 2.0 | 1.0 | 950 | $1,200 | $1.26 | 44d | 1 | 0.64mi |
| 1418 22nd Ave Rockford, IL | 2.0 | 1.0 | 950 | $1,200 | $1.26 | 44d | 1 | 0.64mi |
| 611 15th Ave Unit 2 Rockford, IL | 2.0 | 1.0 | 806 | $1,350 | $1.67 | 44d | 1 | 0.70mi |
| 2010 Kishwaukee St Unit 20102-N Rockford, IL | 1.0 | 1.0 | 1000 | $875 | $0.88 | 44d | 1 | 0.71mi |
| 1202 18th St Unit 3 Rockford, IL | 3.0 | 1.0 | 1500 | $1,700 | $1.13 | 14d | 1 | 0.72mi |
| 1609 E State St Unit 201 Rockford, IL | 1.0 | 1.0 | 796 | $1,800 | $2.26 | 22d | 1 | 1.05mi |
| 604 Saint Louis Ave Unit 604-102A Rockford, IL | 1.0 | 1.0 | 775 | $950 | $1.23 | 44d | 1 | 1.06mi |
| 1416 E State St Rockford, IL | 2.0 | 1.0–2.0 | 825 | $1,445 | $1.75 | 14d | 3 | 1.07mi |
| 150 N 9th St Unit 150-7 Rockford, IL | 1.0 | 1.0 | 725 | $925 | $1.28 | 44d | 1 | 1.10mi |
| 2021 2nd Ave Rockford, IL | 2.0 | 1.0 | 1250 | $1,000 | $0.80 | 14d | 1 | 1.10mi |
| 1138 Revell Ave Rockford, IL | 2.0 | 1.0 | 900 | $800 | $0.89 | 44d | 1 | 1.13mi |
| 1118 Revell Ave Unit 11182-R Rockford, IL | 1.0 | 1.0 | 775 | $895 | $1.15 | 44d | 1 | 1.14mi |
| 222 N 5th St Unit 222-103 Rockford, IL | 1.0 | 1.0 | 750 | $875 | $1.17 | 44d | 1 | 1.15mi |
| 1112 Crosby St Rockford, IL | 2.0 | 1.0 | 1000 | $1,050 | $1.05 | 22d | 1 | 1.22mi |
| 314 N Longwood St Rockford, IL | 2.0 | 1.0 | 1060 | $1,100 | $1.04 | 44d | 1 | 1.25mi |
| 2208 Christina St Rockford, IL | 2.0 | 1.0 | 700 | $1,300 | $1.86 | 22d | 1 | 1.30mi |
| 2846 Lapey St Rockford, IL | 1.0 | 1.0 | 700 | $800 | $1.14 | 44d | 1 | 1.34mi |
| 607 N 2nd St Unit 607-6 Rockford, IL | 2.0 | 1.0 | 875 | $950 | $1.09 | 44d | 1 | 1.47mi |
Listing history 14 events
-
2026-05-20$104,000 Active
Show marketing remark (656 chars)
Located just off Broadway on 10th Street, this charming bungalow offers character and comfort throughout. Features include 2 bedrooms, 1 full bathroom, hardwood floors, and beautiful original woodwork. The enclosed front porch provides additional living space perfect for relaxing or entertaining. Spacious kitchen includes updated flooring and a tile backsplash. One bedroom features an attached walk-in closet for added storage. Rear entrance leads to a partially fenced backyard and detached 1-car garage. Unfinished basement offers excellent storage space and additional potential. Convenient location close to shopping, dining, and everyday amenities.
-
2026-05-20$104,000 Active 656-char remark
Show marketing remark (656 chars)
Located just off Broadway on 10th Street, this charming bungalow offers character and comfort throughout. Features include 2 bedrooms, 1 full bathroom, hardwood floors, and beautiful original woodwork. The enclosed front porch provides additional living space perfect for relaxing or entertaining. Spacious kitchen includes updated flooring and a tile backsplash. One bedroom features an attached walk-in closet for added storage. Rear entrance leads to a partially fenced backyard and detached 1-car garage. Unfinished basement offers excellent storage space and additional potential. Convenient location close to shopping, dining, and everyday amenities.
-
2022-08-05price $995
-
2011-06-13soldstatus $20,000 Closed Sale 175-char remark
Show marketing remark (175 chars)
*3 EMEMPTIONS. CLASSIC BRICK KITCHEN. LARGE REAR YARD W/FENCING ON ONE SIDE. NICE CARING NEIGHBORS. NEAR MEDICAL FFACILITIES. WASHER & FREEZER IN BSMT STAY. HOME WARRANTY.
-
2011-06-10status Pending 175-char remark
Show marketing remark (175 chars)
*3 EMEMPTIONS. CLASSIC BRICK KITCHEN. LARGE REAR YARD W/FENCING ON ONE SIDE. NICE CARING NEIGHBORS. NEAR MEDICAL FFACILITIES. WASHER & FREEZER IN BSMT STAY. HOME WARRANTY.
-
2011-06-03price $25,000 Price Change 175-char remark
Show marketing remark (175 chars)
*3 EMEMPTIONS. CLASSIC BRICK KITCHEN. LARGE REAR YARD W/FENCING ON ONE SIDE. NICE CARING NEIGHBORS. NEAR MEDICAL FFACILITIES. WASHER & FREEZER IN BSMT STAY. HOME WARRANTY.
-
2011-04-27price $35,000 Price Change 175-char remark
Show marketing remark (175 chars)
*3 EMEMPTIONS. CLASSIC BRICK KITCHEN. LARGE REAR YARD W/FENCING ON ONE SIDE. NICE CARING NEIGHBORS. NEAR MEDICAL FFACILITIES. WASHER & FREEZER IN BSMT STAY. HOME WARRANTY.
-
2011-04-27status Price Change 175-char remark
Show marketing remark (175 chars)
*3 EMEMPTIONS. CLASSIC BRICK KITCHEN. LARGE REAR YARD W/FENCING ON ONE SIDE. NICE CARING NEIGHBORS. NEAR MEDICAL FFACILITIES. WASHER & FREEZER IN BSMT STAY. HOME WARRANTY.
-
2011-04-08historical 175-char remark
Show marketing remark (175 chars)
*3 EMEMPTIONS. CLASSIC BRICK KITCHEN. LARGE REAR YARD W/FENCING ON ONE SIDE. NICE CARING NEIGHBORS. NEAR MEDICAL FFACILITIES. WASHER & FREEZER IN BSMT STAY. HOME WARRANTY.
-
2011-01-21price $40,000 Price Change 175-char remark
Show marketing remark (175 chars)
*3 EMEMPTIONS. CLASSIC BRICK KITCHEN. LARGE REAR YARD W/FENCING ON ONE SIDE. NICE CARING NEIGHBORS. NEAR MEDICAL FFACILITIES. WASHER & FREEZER IN BSMT STAY. HOME WARRANTY.
-
2010-11-24price $45,000 Price Change 175-char remark
Show marketing remark (175 chars)
*3 EMEMPTIONS. CLASSIC BRICK KITCHEN. LARGE REAR YARD W/FENCING ON ONE SIDE. NICE CARING NEIGHBORS. NEAR MEDICAL FFACILITIES. WASHER & FREEZER IN BSMT STAY. HOME WARRANTY.
-
2010-10-25status Active 175-char remark
Show marketing remark (175 chars)
*3 EMEMPTIONS. CLASSIC BRICK KITCHEN. LARGE REAR YARD W/FENCING ON ONE SIDE. NICE CARING NEIGHBORS. NEAR MEDICAL FFACILITIES. WASHER & FREEZER IN BSMT STAY. HOME WARRANTY.
-
2010-10-25historical 175-char remark
Show marketing remark (175 chars)
*3 EMEMPTIONS. CLASSIC BRICK KITCHEN. LARGE REAR YARD W/FENCING ON ONE SIDE. NICE CARING NEIGHBORS. NEAR MEDICAL FFACILITIES. WASHER & FREEZER IN BSMT STAY. HOME WARRANTY.
-
2010-10-14$50,000 New 175-char remark
Show marketing remark (175 chars)
*3 EMEMPTIONS. CLASSIC BRICK KITCHEN. LARGE REAR YARD W/FENCING ON ONE SIDE. NICE CARING NEIGHBORS. NEAR MEDICAL FFACILITIES. WASHER & FREEZER IN BSMT STAY. HOME WARRANTY.
ⓘ Source: listings_history table (triggers on properties + properties_extension) + one-shot
backfill from property_details.listing_events for pre-trigger history.
Tax reassessment forecast IL · Partial reset (capped growth)
- Current annual tax
- $1,161 · $97/mo
- Projected year-2 tax
- $1,761 · $147/mo
- Expected delta
- +$600/yr (+$50/mo · 51.6%)
ⓘ Screening estimate from a state-policy table — verify with the county assessor before closing.
Climate risk First Street
- Flood 1/10 Low FEMA zone X (unshaded) · 0% chance over 30 yrs
- Wildfire 1/10 Low
- Heat 3/10 Moderate 7 d/yr ≥101°F today · 15 d/yr by 30 yrs out
- Wind 2/10 Low
- Air quality 2/10 Low 1 unhealthy d/yr today · 2 by 30 yrs out
Nearby sold comps map
Loading sold comps map…
Walkable amenities ~0.75 mi
Loading nearby amenities…
Taxation est. · year 1
- Rental income
- $13,454
- − Mortgage interest
- −$5,826
- − Property taxes
- −$1,161
- − Insurance
- −$520
- − Repairs & maintenance
- −$1,076
- − Management
- −$1,076
- − Depreciation
- −$3,025
- Taxable income
- $769
- Est. tax owed @ 24.0%
- −$184
- After-tax cash flow
- $2,218/yr
For passive investors: Depreciation is non-cash, so a rental often shows a tax loss while cash-flowing — sheltering income. Rental losses are passive: they offset passive income freely, and up to $25,000/yr can offset ordinary (W-2) income if you actively participate and your MAGI is under $100k (phasing out to $0 by $150k); unused losses carry forward. On sale, claimed depreciation is recaptured at up to 25%, and gains may owe capital-gains tax (a 1031 exchange can defer both). Figures are a year-1 estimate at your 24.0% rate — not tax advice; consult a CPA.
Schools (NCES district)
- District
- Rockford SD 205
- NCES district ID
- 1734510
- Math proficiency
- 12% ▼ -2.00%
- Reading proficiency
- 16% ▼ -3.00%
- Median HH income
- $42,533
- Composite
- 12.21/100
- National rank
- #9649
- State rank
- #533 of 620 in IL
Livability — Rockford
- Score
- 62/100
- State rank
- #876
- US rank
- #17035
Category grades
Schools grade is shown separately in the Schools card above.
Census & demographics
- Census place
- Rockford, IL
- County
- Winnebago County · 147,297 people
- City population
- 147,297
- Metro
- Rockford, IL
- Population (ZIP)
- 17,222
- Household income
- $33,772
- Rent vs Own
- Severe rent burden
- 1406.0
Population outlook (Winnebago County) Hauer SSP2
- Today (2025)
- 271,080 people
- By 2030
- 260,684 · -3.8%
- By 2040
- 238,405 · -12.1%
- By 2050
- 216,129 · -20.3%
- By 2075
- 172,882 · -36.2%
- By 2100
- 135,336 · -50.1%
Race, ethnicity, and origin ACS 2023
- Neighborhood character
- Highly diverse neighborhood (Simpson 0.70)
- Race & ethnicity
- White 41% Hispanic / Latino 26% Black 25% Two or more races 13% Asian 4%
- Hispanic origin (detail)
- Mexican 22% Puerto Rican 2%
- Common ancestry
- Romanian 2% Portuguese 2% Lithuanian 2%
- Foreign-born
- 16% · Canada, South Korea, Philippines
- Languages at home
- 74% English-only · Spanish 18% Other Asian/Pacific 3% Russian/Polish/Slavic 1%
Political lean MEDSL · Winnebago
- 2024 margin
- Toss-up / Even · D 49.5% · R 49.0% · Other 1.5%
- 2008→2024 swing
- -12.2pp toward R · 2008: 12.8pp · 2024: 0.6pp
- All cycles
- 2024: D+0.6 2020: D+2.5 2016: R+1.2 2012: D+5.7 2008: D+12.8
Not yet ingested
- Civics
- —
Market trends
- HPI YoY
- ▼ -63.40%
- Current HPI
- 233.0219
- Rent YoY
- ▲ 9.67%
- Metro
- Rockford, IL
- State GDP YoY
- ▲ 1.59%
- F500 in state
- 60
Industry mix (Fortune 500 HQ in IL)
| Industry | F500 HQs | Revenue |
|---|---|---|
| Insurance | 4 | $201B |
|
||
| Consumer Goods | 4 | $87B |
|
||
| Industrial Machinery | 3 | $64B |
|
||
| Healthcare | 2 | $55B |
|
||
| Retail / Pharmacy | 1 | $148B |
|
||
| Agriculture / Food | 1 | $86B |
|
||
Price history
+108.0% since first listed14 events — show timeline
- 2026-05-20 Listed $104,000 MRED as Distributed by MLS Grid
- 2026-05-20 Listed $104,000 NWIAR
- 2022-08-05 Price Changed $995 RENT.
- 2011-06-13 Sold (MLS) $20,000 MRED as Distributed by MLS Grid
- 2011-06-10 Pending — MRED as Distributed by MLS Grid
- 2011-06-03 Price Changed $25,000 MRED as Distributed by MLS Grid
- 2011-04-27 Relisted — MRED as Distributed by MLS Grid
- 2011-04-27 Price Changed $35,000 MRED as Distributed by MLS Grid
- 2011-04-08 Listing Removed — MRED as Distributed by MLS Grid
- 2011-01-21 Price Changed $40,000 MRED as Distributed by MLS Grid
- 2010-11-24 Price Changed $45,000 MRED as Distributed by MLS Grid
- 2010-10-25 Relisted — MRED as Distributed by MLS Grid
- 2010-10-25 Listing Removed — MRED as Distributed by MLS Grid
- 2010-10-14 Listed $50,000 MRED as Distributed by MLS Grid
Property tax history
+1.9%/yrLatest (2024): $1,161 · +10.8% YoY. Source: county tax records.
Cash-flow waterfall
monthlySold comps — $/sqft
last 12 mo · ≤1 miLoading sold comps…