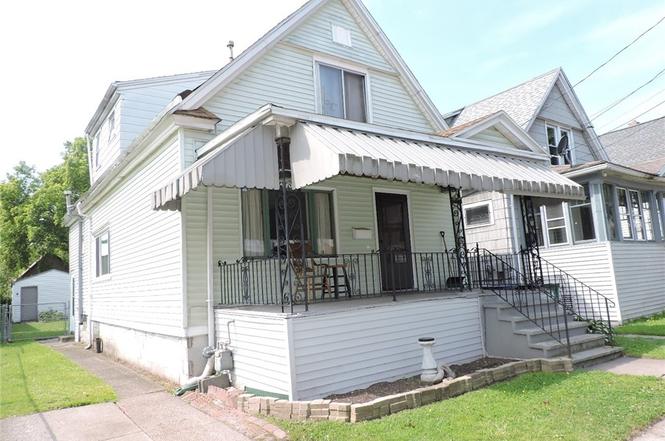
125 Ludington St · Buffalo, NY
Flood risk 3/10 · Minor
- FEMA flood zone
- X (unshaded)
- Chance of flooding over 30 yrs
- 0.2%
- Est. flood insurance / yr
- $473 – $860
Fire risk 1/10 · Minimal
- Est. fire insurance / yr
- $691 – $1,283
Heat risk 3/10 · Minor
- Hot days now (above 92°F)
- 7 days/yr
- Hot days in 30 yrs
- 15 days/yr
Wind risk 1/10 · Minimal
- Chance of severe wind over 30 yrs
- —
Air-quality risk 3/10 · Minor
- Unhealthy air days now
- 2 days/yr
- Unhealthy air days in 30 yrs
- 3 days/yr
Risk factors via First Street. Map © Google.
Why this score? — see what drove the C+ grade
The composite is a weighted blend of 9 inputs, each scored 0–100. Each bar is that input's sub-score; the figure is the points it added to the 100-point composite (weight × sub-score).
- Cash flow +22.1/30.0
- ARV discount +9.3/15.0
- Appreciation +9.0/10.0
- DSCR +7.1/10.0
- 1% rule +4.5/10.0
- Livability +3.9/5.0
- Schools +3.3/10.0
- Rent growth +2.5/5.0
- Condition / age +2.5/5.0
$149,900
🖨 Deal sheet 📄 Offer letter ✓ Due diligence
Listing remarks MLS
Come see this 3 bedroom 1 bath old style home with all its charm! Come sit on the covered porch and entertain in the fully fenced yard. 2 additional rooms upstairs could be 2 more bedrooms/office or more storage. Tons of storage available! Newer furnace with a transferable warranty, carpets (4 years), HWT (5 years), 1/2 of the roof reshingled in 2017: most windows have been replaced; glass block windows in basement; original trim, 12x14 shed; all appliances stay including freezer, washer and dryer. This home has more to offer than meets the eye. Come and book your appointment today!
Key facts
- Large eat-in kitchen
- Bonus room
- Storage shed
Tags
Property features AI
Exterior
- Parking: No garage
- Utilities: Public water connected; Sewer connected; Electric service with circuit breakers
- Home design: Single-story listed (interior includes second-level rooms/loft); Vinyl siding; Resale condition; City street frontage; Rectangular residential lot (approx. 28 x 120)
- Construction: Asphalt roof; Stone foundation; Copper plumbing; Existing (previously built)
- Exterior features: Concrete driveway; Fully fenced yard; Open porch; Shed(s) and additional storage
Interior
- Kitchen: Refrigerator; Eat-in kitchen layout
- Bedrooms: Two main-level bedrooms; Additional bedrooms on second level including a loft area
- Flooring: Hardwood; Laminate; Varies
- Bathrooms: One full bathroom (main level)
- Heating & cooling: Gas forced-air heating; Central air conditioning
- Interior features: Eat-in kitchen; Separate/formal living room; Living/dining room combination; Loft; Bedroom on main level; Partial basement
- Laundry & utility: Washer located in basement; Gas water heater
Neighborhood map
What this means for you Summary
Snapshot
- This is a 4-bed/1.0-bath single-family listed at $150k.
Deal economics
- At list price, monthly cash flow is $242 ($3k/yr) — positive.
- The deal already cash-flows at list — no discount required.
- To meet the 1% rule (rent ≥ 1% of price), the offer needs to be $142k (5.0% below list).
- Recommended offer: $142k (5.0% below list) — sets the bar for 1% rule.
Location & tenants
- Location reads 77/100 on livability (#195 in NY, #3,011 nationally) — a middle-class / working-renter tenant base. Strengths: commute A+, housing A+, health & safety A+; Watch: crime F, employment D-.
- Buffalo City School District (urban): math 41% / reading 40% proficiency, ranked #535 of 590 in NY (top 91%) — families likely to look elsewhere, expect single-tenant / working-renter base with shorter leases; 75% free/reduced lunch — lower-income household profile, screen leases tightly.
- Market conditions: 169 active listings in the ZIP; 3 comparable units currently listed for rent nearby; rentals at typical pace (median 24d on market — plan ~3-4 weeks tenant-placement turnaround); 1,244 units permitted in Erie County in 2024 (563 in 5+ unit buildings).
- This rent runs 34% of the median local income ($50k/yr) — at the standard rent-burdened threshold; future hikes will face affordability resistance.
Forward outlook
- In year one you build about $13k of equity ($1k loan paydown + $12k appreciation (8.1% local appreciation)).
- At projected returns (8.1% appreciation + 3.0% rent growth), your $42k cash investment doubles in ~3 years — after that, you're playing with house money.
- By year 3, paydown + projected appreciation supports a ~$33k cash-out refi (75% LTV) — recoverable capital for the next deal without selling this one.
Negotiation context
- Only 7 days on market — expect competitive offers; lowballing is unlikely to land.
- 4 sale attempts since 8y ago with the ask held roughly flat each time — persistent listings suggest the price (not the market) is what's stuck; bring a comps-based counter.
- Current owner paid $70k; list at $150k implies a 115% gain — meaningful room to come down on a strong offer.
Risks & watch-outs
- Watch-outs: built in 1910 — expect roof / HVAC / electrical / plumbing capex.
Questions for the listing agent
- Built in 1910 — when were the roof, HVAC, electrical panel, plumbing, and water heater last replaced?
- Is there a deadline driving the sale (1031 exchange, divorce, estate, relocation)? That informs how much negotiation room exists.
- Crime grade is F in this area — have there been break-ins, vandalism, or insurance claims at this property in the last 3 years? What carrier currently insures it and at what premium?
- What's the average days-on-market for RENTAL listings here right now (not sales)? A rising rental-DOM trend means longer vacancies and softer asking-rent achievability than the comps imply.
- What's the recent tenant-quality profile in this submarket — average credit score on applications, eviction rate, late-payment / NSF rate, and stable-employment percentage? A property-management company in the area should have these aggregated.
- How much new for-sale + rental construction is in the pipeline within 1–3 miles? Heavy new supply typically softens prices + rents 12–24 months out; constrained supply supports both.
Investment metrics
- 1% rule
- 0.95% ✗
- Cap rate
- 8.23%
- Cash-on-cash
- 6.93%
- DSCR
- 1.31
- GRM
- 8.8
CMA / ARV
- ARV (on-the-fly)
- $156,288
- Comps found
- 12
Show comp detail 12 sales within ~0.75 mi
| Address | Dist | Beds/Ba | Sqft | Sold | Price | $/sf | Match |
|---|---|---|---|---|---|---|---|
| 86 Moreland St | 0.26mi | 4/1.0 | 1,069 (+1%) | 12mo | $82,000 | $77 | 76 |
| 29 Bogardus St | 0.22mi | 3/1.0 (-1) | 1,092 (+3%) | 10mo | $150,000 | $137 | 70 |
| 324 Ideal St | 0.45mi | 4/2.0 | 1,092 (+3%) | 6mo | $195,000 | $179 | 64 |
| 74 Vanderbilt St | 0.39mi | 3/1.0 (-1) | 1,136 (+8%) | 3mo | $105,000 | $92 | 62 |
| 31 Schiller St | 0.43mi | 3/1.0 (-1) | 1,037 (-2%) | 13mo | $90,000 | $87 | 61 |
| 105 Regent St | 0.28mi | 3/2.0 (-1) | 1,138 (+8%) | 6mo | $110,000 | $97 | 60 |
| 379 N Ogden St Unit E | 0.69mi | 3/1.0 (-1) | 1,083 (+3%) | 3mo | $160,000 | $148 | 56 |
| 67 Gold St | 0.23mi | 3/2.0 (-1) | 1,183 (+12%) | 8mo | $103,500 | $87 | 54 |
| 391 Greene St | 0.58mi | 3/1.0 (-1) | 1,144 (+8%) | 2mo | $200,000 | $175 | 52 |
| 302 N Pleasant Pkwy | 0.71mi | 3/1.0 (-1) | 1,000 (-5%) | 7mo | $185,000 | $185 | 47 |
| 185 Wagner Ave | 0.68mi | 3/1.5 (-1) | 971 (-8%) | 12mo | $197,500 | $203 | 38 |
| 212 Wagner Ave | 0.69mi | 3/1.0 (-1) | 1,166 (+10%) | 12mo | $205,000 | $176 | 36 |
Match score weights: distance 35% · size 25% · config 20% · recency 20%. Top-matched comps best support the ARV.
Projected returns pro-forma
8.06% appreciation · 3.0% rent growth · sell at horizon
- IRR
- 25.4%
- Equity multiple
- 2.85×
- Total profit
- $77,671
- Equity at exit
- $114,479
- IRR
- 22.9%
- Equity multiple
- 6.09×
- Total profit
- $213,760
- Equity at exit
- $227,810
Cash invested: $41,972 (down + closing). Projections, not guarantees.
Landlord ↔ Tenant lean methodology
- Overall (STATE)
- 15 Strongly Tenant-Friendly
- State New York
- 15 Strongly Tenant-Friendly · D+10
- County
- — inherits STATE
- City
- — inherits STATE
ZIP-level market 14206
- Home prices YoY
- 1.8%
- Active inventory
- 169
- Price-to-rent
- 8.8×
Monthly cashflow live
- Estimated rent
- $1,424 medium interval (Pro) →
- Mortgage (P&I)
- −$786
- Tax from tax record
- −$34 /mo · $413/yr
- Insurance
- −$62
- HOA
- −$0
- Vacancy / Maint / Mgmt
- −$299
- Net cashflow
- $242
Break-even live
UW: 25.0% down · 7.5% · 30yr · 1.5% tax · 5.0% vac · 8.0% maint · 8.0% mgmt
Financing live
Cash to close
- Down payment
- $37,475
- Closing costs
- $4,497
- Reserves months
- —
- Total cash needed
- —
Loan-product check · same deal, 3 products live
Conventional
25% down · 7.5% · 30yr
- Down + closing
- —
- Monthly P&I
- —
- Monthly cashflow
- —
- DSCR
- —
- Eligible?
- —
Personal DTI + credit; lowest rate.
DSCR
20% down · 8.5% · 30yr
- Down + closing
- —
- Monthly P&I
- —
- Monthly cashflow
- —
- DSCR
- —
- Eligible?
- —
No personal income docs; deal must DSCR.
Hard money
10% down · 12.0% · 12mo
- Down + closing
- —
- Monthly P&I
- —
- Monthly cashflow
- —
- DSCR
- —
- Eligible?
- —
Short-term bridge; refi at stabilization.
Rent comps 3 comps
| Address | Beds | Baths | Sqft | Rent | $/sqft | DOM | Units | Dist |
|---|---|---|---|---|---|---|---|---|
| 1150 Bailey Ave Buffalo, NY | 4.0 | 1.5 | 1100 | $1,200 | $1.09 | 23d | 1 | 0.30mi |
| 1777 Broadway Unit 2 Buffalo, NY | 3.0 | 1.0 | 1300 | $1,200 | $0.92 | 43d | 1 | 0.71mi |
| 14 Rutland Ave Buffalo, NY | 4.0 | 1.0 | 1430 | $2,200 | $1.54 | 10d | 1 | 1.31mi |
Listing history 7 events
-
2026-06-18days on market $149,900 Active 7 DOM
-
2026-06-17days on market $149,900 Active 6 DOM
-
2026-06-16days on market $149,900 Active 5 DOM
-
2026-06-15days on market $149,900 Active 4 DOM
-
2026-06-13days on market $149,900 Active 2 DOM
-
2026-06-13remarks 699-char remark
-
2026-06-13$149,900 Active 1 DOM
ⓘ Source: listings_history table (triggers on properties + properties_extension) + one-shot
backfill from property_details.listing_events for pre-trigger history.
Tax reassessment forecast NY · Partial reset (capped growth)
- Current annual tax
- $413 · $34/mo
- Projected year-2 tax
- $1,473 · $123/mo
- Expected delta
- +$1,060/yr (+$88/mo · 256.9%)
ⓘ Screening estimate from a state-policy table — verify with the county assessor before closing.
Climate risk First Street
- Flood 3/10 Moderate FEMA zone X (unshaded) · 20% chance over 30 yrs
- Wildfire 1/10 Low
- Heat 3/10 Moderate 7 d/yr ≥92°F today · 15 d/yr by 30 yrs out
- Wind 1/10 Low
- Air quality 3/10 Moderate 2 unhealthy d/yr today · 3 by 30 yrs out
Nearby sold comps map
Loading sold comps map…
Walkable amenities ~0.75 mi
Loading nearby amenities…
Taxation est. · year 1
- Rental income
- $17,093
- − Mortgage interest
- −$8,397
- − Property taxes
- −$413
- − Insurance
- −$750
- − Repairs & maintenance
- −$1,367
- − Management
- −$1,367
- − Depreciation
- −$4,361
- Taxable income
- $438
- Est. tax owed @ 24.0%
- −$105
- After-tax cash flow
- $2,803/yr
For passive investors: Depreciation is non-cash, so a rental often shows a tax loss while cash-flowing — sheltering income. Rental losses are passive: they offset passive income freely, and up to $25,000/yr can offset ordinary (W-2) income if you actively participate and your MAGI is under $100k (phasing out to $0 by $150k); unused losses carry forward. On sale, claimed depreciation is recaptured at up to 25%, and gains may owe capital-gains tax (a 1031 exchange can defer both). Figures are a year-1 estimate at your 24.0% rate — not tax advice; consult a CPA.
Schools (NCES district)
- District
- Buffalo City School District
- NCES district ID
- 3605850
- Math proficiency
- 41% ▲ 11.00%
- Reading proficiency
- 40% ▲ 7.00%
- Median HH income
- $31,665
- Composite
- 33.17/100
- National rank
- #5544
- State rank
- #535 of 590 in NY
Livability — Buffalo
- Score
- 77/100
- State rank
- #195
- US rank
- #3011
Category grades
Schools grade is shown separately in the Schools card above.
Census & demographics
- Census place
- Buffalo, NY
- County
- Erie County · 714,559 people
- City population
- 440,021
- Metro
- Buffalo-Cheektowaga, NY
- Population (ZIP)
- 21,631
- Household income
- $50,450
- Rent vs Own
- Severe rent burden
- 841.0
Population outlook (Erie County) Hauer SSP2
- Today (2025)
- 933,037 people
- By 2030
- 935,181 · +0.2%
- By 2040
- 928,531 · -0.5%
- By 2050
- 905,725 · -2.9%
- By 2075
- 834,037 · -10.6%
- By 2100
- 708,033 · -24.1%
Race, ethnicity, and origin ACS 2023
- Neighborhood character
- Majority White (65%)
- Race & ethnicity
- White 65% Hispanic / Latino 13% Black 12% Two or more races 8% Asian 4%
- Hispanic origin (detail)
- Mexican 2% Puerto Rican 10%
- Common ancestry
- Romanian 25% Lithuanian 1% Italian 1%
- Foreign-born
- 6% · Canada, China
- Languages at home
- 88% English-only · Spanish 5% Other Indo-European 3% Arabic 2%
Political lean MEDSL · Erie
- 2024 margin
- Lean D (+9.7) · D 54.8% · R 45.2%
- 2008→2024 swing
- -7.9pp toward R · 2008: 17.5pp · 2024: 9.7pp
- All cycles
- 2024: D+9.7 2020: D+14.7 2016: D+4.8 2012: D+15.6 2008: D+17.5
Not yet ingested
- Civics
- —
Market trends
- HPI YoY
- ▲ 8.06%
- Current HPI
- 457.3935
- Rent YoY
- —
- Metro
- Buffalo-Cheektowaga, NY
- State GDP YoY
- ▲ 2.60%
- F500 in state
- 92
Industry mix (Fortune 500 HQ in NY)
| Industry | F500 HQs | Revenue |
|---|---|---|
| Financial Services | 10 | $950B |
|
||
| Consumer Goods | 9 | $162B |
|
||
| Insurance | 4 | $225B |
|
||
| Telecommunications | 2 | $144B |
|
||
| Pharmaceuticals | 2 | $112B |
|
||
| Media / Entertainment | 2 | $69B |
|
||
Price history
+115.7% since first listed11 events — show timeline
- 2026-06-11 Listed $149,900 WNYREIS
- 2018-10-05 Sold (Public Records) $69,800 Public Records
- 2018-10-05 Sold (MLS) $69,800 WNYREIS
- 2018-09-24 Pending — WNYREIS
- 2018-08-06 Pending — WNYREIS
- 2018-07-17 Relisted — WNYREIS
- 2018-07-13 Pending — WNYREIS
- 2018-07-06 Relisted — WNYREIS
- 2018-05-29 Pending — WNYREIS
- 2018-05-22 Pending — WNYREIS
- 2018-05-11 Listed $69,500 WNYREIS
Property tax history
+4.0%/yrLatest (2025): $413 · +44.4% YoY. Source: county tax records.
Cash-flow waterfall
monthlySold comps — $/sqft
last 12 mo · ≤1 miLoading sold comps…