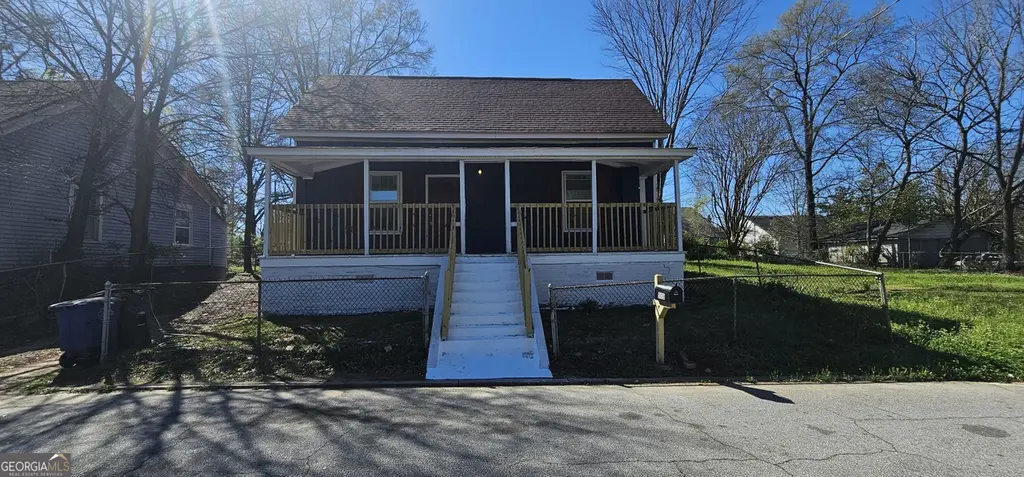
508 Wheeler St · Griffin, GA
Flood risk 1/10 · Minimal
- FEMA flood zone
- X (unshaded)
- Chance of flooding over 30 yrs
- 0.0%
- Est. flood insurance / yr
- $507 – $1,088
Fire risk 3/10 · Minor
- Est. fire insurance / yr
- $963 – $1,789
Heat risk 6/10 · Moderate
- Hot days now (above 104°F)
- 7 days/yr
- Hot days in 30 yrs
- 18 days/yr
Wind risk 6/10 · Moderate
- Chance of severe wind over 30 yrs
- 39.0%
Air-quality risk 4/10 · Minor
- Unhealthy air days now
- 4 days/yr
- Unhealthy air days in 30 yrs
- 5 days/yr
Risk factors via First Street. Map © Google.
Why this score? — see what drove the D grade
The composite is a weighted blend of 9 inputs, each scored 0–100. Each bar is that input's sub-score; the figure is the points it added to the 100-point composite (weight × sub-score).
- Cash flow +14.8/30.0
- ARV discount +8.0/15.0
- DSCR +4.5/10.0
- Rent growth +3.3/5.0
- 1% rule +3.0/10.0
- Livability +2.7/5.0
- Condition / age +2.5/5.0
- Schools +1.4/10.0
- Appreciation +0.0/10.0
$139,900
🖨 Deal sheet 📄 Offer letter ✓ Due diligence
Listing remarks MLS
NEW RENOVATION, COME SEE IT TODAY. This single family 2-bedroom, 1 bath home has been fully updated and move in ready at an incredible price! Everything brand new from top to bottom! Including brand new roof, new interior doors, bathroom upgrades, interior/exterior paint, and beautiful hardwood floors. The kitchen features new stainless-steel appliances, new kitchen cabinets, and granite countertops. There's even a large shed in the backyard for extra storage. The fully fenced back yard offers privacy and a carport is in the rear to park your vehicle.
Key facts
- Brand new roof
- Bathroom upgrades
- New kitchen cabinets
Tags
Neighborhood map
What this means for you Summary
Snapshot
- This is a 2-bed/1.0-bath single-family listed at $140k.
Deal economics
- At list price, monthly cash flow is $39 ($473/yr) — positive.
- The deal already cash-flows at list — no discount required.
- To meet the 1% rule (rent ≥ 1% of price), the offer needs to be $113k (19.6% below list).
- Recommended offer: $113k (19.6% below list) — sets the bar for 1% rule.
- Cap rate 6.6% vs local median 4.3% in Griffin — top-decile yield for the area; either an underpriced asset or a hidden risk that comps aren't pricing in. Stress-test before assuming the spread holds.
Location & tenants
- Location reads 54/100 on livability (#529 in GA) — a working-class tenant base; expect higher turnover. Strengths: cost of living A+, housing A+; Watch: schools F, crime F, amenities F.
- Griffin-Spalding County (suburban): math 13% / reading 19% proficiency, ranked #151 of 174 in GA (top 87%) — low school quality limits family demand, transient renter base, plan for 1-2y turnover; 68% free/reduced lunch — lower-income household profile, screen leases tightly.
- Market conditions: Rents rising (+3.3%/yr); 427 active listings in the ZIP; 40 comparable units currently listed for rent nearby; rentals at typical pace (median 25d on market — plan ~3-4 weeks tenant-placement turnaround); 342 units permitted in Spalding County in 2024 (0 in 5+ unit buildings).
Forward outlook
- Local home prices are declining (-3.0%/yr); year-one equity from $967 of loan paydown is wiped out by about $4k of value loss. Plan a longer hold.
- Spalding County population projected at -15% by 2050 — secular population decline; favor cash flow + early exit over multi-decade hold.
Negotiation context
- It's been on market 83 days — a 6% lower offer ($132k) is reasonable based on typical stale-listing flexibility.
- Current owner paid $78k; list at $140k implies a 79% gain — meaningful room to come down on a strong offer.
Risks & watch-outs
- Watch-outs: built in 1922 — expect roof / HVAC / electrical / plumbing capex.
- Climate carrying-cost: major wind risk, 39% chance of damaging wind over 30y; extreme-heat days projected 7→18/yr by 2055 (HVAC capex compounding) — expect insurance premiums to compound above CPI over the hold.
Questions for the listing agent
- It's been on market 83 days. Have you received any prior offers? Is the seller open to a 20% concession, seller financing, or rate buy-down credit?
- Built in 1922 — when were the roof, HVAC, electrical panel, plumbing, and water heater last replaced?
- Why hasn't it sold? Are there any deal-killer items the seller is aware of (foundation, flood, title, zoning, code violations)?
- Is there a deadline driving the sale (1031 exchange, divorce, estate, relocation)? That informs how much negotiation room exists.
- Schools are F-rated, which usually means shorter tenancies and higher turnover. Who's the typical renter profile here, and what's been the actual vacancy rate?
- Crime grade is F in this area — have there been break-ins, vandalism, or insurance claims at this property in the last 3 years? What carrier currently insures it and at what premium?
- The area grade is low — what's the realistic commute time and amenity access for the typical tenant pool here? Any planned neighborhood developments (good or bad) we should know about?
- What's the average days-on-market for RENTAL listings here right now (not sales)? A rising rental-DOM trend means longer vacancies and softer asking-rent achievability than the comps imply.
- What's the recent tenant-quality profile in this submarket — average credit score on applications, eviction rate, late-payment / NSF rate, and stable-employment percentage? A property-management company in the area should have these aggregated.
- How much new for-sale + rental construction is in the pipeline within 1–3 miles? Heavy new supply typically softens prices + rents 12–24 months out; constrained supply supports both.
Investment metrics
- 1% rule
- 0.80% ✗
- Cap rate
- 6.63%
- Cash-on-cash
- 1.21%
- DSCR
- 1.05
- GRM
- 10.4
CMA / ARV
- ARV (median comp)
- $141,354
- List price
- $139,900
- Delta
- -1.03%
- Verdict
- FAIR
- Comps
- 20 within 1.0 mi
Show comp detail 12 sales within ~0.75 mi
| Address | Dist | Beds/Ba | Sqft | Sold | Price | $/sf | Match |
|---|---|---|---|---|---|---|---|
| 435 W Cherry St | 0.07mi | 2/1.0 | 1,020 (+6%) | 5mo | $60,000 | $59 | 83 |
| 735 W Solomon St | 0.53mi | 2/1.0 | 910 (-6%) | 16mo | $90,000 | $99 | 52 |
| 1110 Lyndon Ave | 0.63mi | 2/1.0 | 1,008 (+5%) | 13mo | $130,000 | $129 | 52 |
| 607 N Hill St | 0.41mi | 3/1.0 (+1) | 1,104 (+14%) | 2mo | $75,000 | $68 | 50 |
| 1117 Lake Ave | 0.64mi | 2/1.0 | 891 (-8%) | 9mo | $165,000 | $185 | 50 |
| 1123 Drewery Ave | 0.68mi | 2/1.0 | 1,064 (+10%) | 1mo | $145,000 | $136 | 50 |
| 22 Chestnut St | 0.74mi | 2/1.0 | 988 (+2%) | 14mo | $70,000 | $71 | 50 |
| 319 E Broadway St | 0.65mi | 2/2.0 | 1,044 (+8%) | 4mo | $110,000 | $105 | 49 |
| 213 W Central Ave | 0.32mi | 3/1.0 (+1) | 1,064 (+10%) | 17mo | $162,000 | $152 | 49 |
| 926 N 9th St | 0.56mi | 2/1.0 | 896 (-7%) | 20mo | $57,400 | $64 | 45 |
| 317 N 10th St | 0.22mi | 3/2.0 (+1) | 1,101 (+14%) | 17mo | $159,900 | $145 | 43 |
| 229 Willow St | 0.66mi | 2/1.0 | 1,108 (+15%) | 9mo | $70,000 | $63 | 37 |
Match score weights: distance 35% · size 25% · config 20% · recency 20%. Top-matched comps best support the ARV.
Projected returns pro-forma
-3.0% appreciation · 3.34% rent growth · sell at horizon
- IRR
- -14.1%
- Equity multiple
- 0.49×
- Total profit
- $-19,830
- Equity at exit
- $20,860
- IRR
- -4.9%
- Equity multiple
- 0.68×
- Total profit
- $-12,665
- Equity at exit
- $12,096
Cash invested: $39,172 (down + closing). Projections, not guarantees.
Landlord ↔ Tenant lean methodology
- Overall (STATE)
- 90 Strongly Landlord-Friendly
- State Georgia
- 90 Strongly Landlord-Friendly · R+3
- County
- — inherits STATE
- City
- — inherits STATE
ZIP-level market 30223
- Rents YoY
- 3.3%
- Active inventory
- 427
- Price-to-rent
- 10.4×
Monthly cashflow live
- Estimated rent
- $1,125 high interval (Pro) →
- Mortgage (P&I)
- −$734
- Tax from tax record
- −$58 /mo · $691/yr
- Insurance
- −$58
- HOA
- −$0
- Vacancy / Maint / Mgmt
- −$236
- Net cashflow
- $39
Break-even live
UW: 25.0% down · 7.5% · 30yr · 1.5% tax · 5.0% vac · 8.0% maint · 8.0% mgmt
Financing live
Cash to close
- Down payment
- $34,975
- Closing costs
- $4,197
- Reserves months
- —
- Total cash needed
- —
Loan-product check · same deal, 3 products live
Conventional
25% down · 7.5% · 30yr
- Down + closing
- —
- Monthly P&I
- —
- Monthly cashflow
- —
- DSCR
- —
- Eligible?
- —
Personal DTI + credit; lowest rate.
DSCR
20% down · 8.5% · 30yr
- Down + closing
- —
- Monthly P&I
- —
- Monthly cashflow
- —
- DSCR
- —
- Eligible?
- —
No personal income docs; deal must DSCR.
Hard money
10% down · 12.0% · 12mo
- Down + closing
- —
- Monthly P&I
- —
- Monthly cashflow
- —
- DSCR
- —
- Eligible?
- —
Short-term bridge; refi at stabilization.
Rent comps 40 comps
| Address | Beds | Baths | Sqft | Rent | $/sqft | DOM | Units | Dist |
|---|---|---|---|---|---|---|---|---|
| 503 Wheeler St Griffin, GA | 2.0 | 1.0 | 1028 | $1,250 | $1.22 | 44d | 1 | 0.03mi |
| 502 W Broadway St Griffin, GA | 1.0–2.0 | 1.0–2.0 | 1133 | $1,745 | $1.54 | 1d | 17 | 0.16mi |
| 315 W Chappell St Unit 317 Griffin, GA | 2.0 | 1.0 | 980 | $900 | $0.92 | 24d | 1 | 0.19mi |
| 205 W Cherry St Griffin, GA | 2.0 | 1.0 | 972 | $950 | $0.98 | 3d | 1 | 0.21mi |
| 708 Ellis St Griffin, GA | 2.0 | 1.0 | 768 | $1,000 | $1.30 | 3d | 1 | 0.23mi |
| 217 W Central Ave Unit B Griffin, GA | 2.0 | 1.0 | 750 | $995 | $1.33 | 5d | 1 | 0.28mi |
| 731 Williams St Unit A Griffin, GA | 1.0 | 1.0 | 770 | $800 | $1.04 | 44d | 1 | 0.28mi |
| 413 N Hill St Unit B Griffin, GA | 2.0 | 1.0 | 792 | $875 | $1.10 | 4d | 1 | 0.28mi |
| 353 N 13th St Unit 353 Griffin, GA | 2.0 | 1.0 | 1059 | $950 | $0.90 | 24d | 1 | 0.30mi |
| 716 Ray St Griffin, GA | 2.0 | 1.0 | 788 | $1,300 | $1.65 | 44d | 1 | 0.32mi |
| 212 Alabama St Griffin, GA | 2.0 | 1.0 | 728 | $995 | $1.37 | 44d | 1 | 0.32mi |
| 813 W Quilly St Griffin, GA | 2.0 | 1.0 | 838 | $1,200 | $1.43 | 4d | 1 | 0.33mi |
| 405 N 15th St Unit A Griffin, GA | 1.0 | 1.0 | 586 | $650 | $1.11 | 3d | 1 | 0.45mi |
| 804 N 8th St Griffin, GA | 2.0 | 1.0 | 600 | $750 | $1.25 | 1d | 30 | 0.46mi |
| 816 Lane St Griffin, GA | 3.0 | 2.0 | 1120 | $1,300 | $1.16 | 44d | 1 | 0.48mi |
| 317 N 4th St Griffin, GA | 2.0 | 1.0 | 760 | $1,000 | $1.32 | 24d | 1 | 0.61mi |
| 117 Blanton Ave Unit A Griffin, GA | 2.0 | 1.0 | 718 | $975 | $1.36 | 24d | 1 | 0.61mi |
| 724 W Taylor St Griffin, GA | 1.0 | 1.0 | 650 | $900 | $1.38 | 44d | 1 | 0.64mi |
| 416 W Poplar St Griffin, GA | 1.0–2.0 | 1.0 | 925 | $1,436 | $1.55 | 1d | 4 | 0.64mi |
| 614 W Poplar St Griffin, GA | 3.0 | 1.0 | 1100 | $1,100 | $1.00 | 22d | 1 | 0.66mi |
| 616 W Poplar St Unit 1 Griffin, GA | 1.0 | 1.0 | 900 | $595 | $0.66 | 22d | 1 | 0.67mi |
| 422 Meriwether St Unit 2 Griffin, GA | 3.0 | 2.0 | 1100 | $1,250 | $1.14 | 13d | 1 | 0.68mi |
| 521 Meriwether St Apt C Griffin, GA | 2.0 | 1.0 | 800 | $1,150 | $1.44 | 44d | 1 | 0.70mi |
| 521 Meriwether St Unit C Triplex Griffin, GA | 2.0 | 1.0 | 800 | $1,200 | $1.50 | 44d | 1 | 0.70mi |
| 521 Meriwether St Unit A Triplex Griffin, GA | 2.0 | 1.0 | 850 | $1,250 | $1.47 | 44d | 1 | 0.70mi |
| 415 N 18th St Unit 417 D Griffin, GA | 2.0 | 1.0 | 865 | $1,050 | $1.21 | 44d | 1 | 0.73mi |
| 419 N 18th St Unit F Griffin, GA | 2.0 | 1.0 | 865 | $1,050 | $1.21 | 24d | 1 | 0.73mi |
| 419 N 18th St Griffin, GA | 2.0 | 1.0 | 865 | $1,050 | $1.21 | 18d | 1 | 0.73mi |
| 738 W Poplar St Unit 4 Griffin, GA | 1.0 | 1.0 | 755 | $600 | $0.79 | 10d | 1 | 0.73mi |
| 214 Kentucky Ave Unit D Griffin, GA | 2.0 | 1.0 | 700 | $1,050 | $1.50 | 5d | 1 | 0.74mi |
| 358 N 19th St Griffin, GA | 2.0 | 1.0 | 936 | $1,025 | $1.10 | 2d | 1 | 0.74mi |
| 617 Meriwether St Griffin, GA | 1.0–2.0 | 1.0 | 745 | $1,481 | $1.99 | 1d | 4 | 0.75mi |
| 356 N 19th St Griffin, GA | 2.0 | 1.5 | 896 | $995 | $1.11 | 1d | 1 | 0.76mi |
| 311 S 5th St Unit A Griffin, GA | 2.0 | 1.0 | 975 | $1,350 | $1.38 | 44d | 1 | 0.82mi |
| 1128 W College St Unit A-1 Model Unit Griffin, GA | 2.0 | 1.0 | 900 | $1,250 | $1.39 | 44d | 1 | 0.83mi |
| 215 Hillside Cir Griffin, GA | 2.0 | 1.0 | 1002 | $975 | $0.97 | 24d | 1 | 0.99mi |
| 207 Hillside Cir Griffin, GA | 3.0 | 1.0 | 1054 | $1,100 | $1.04 | 22d | 1 | 1.00mi |
| 1048 W College Street Ext Griffin, GA | 1.0 | 1.0 | 606 | $750 | $1.24 | 24d | 1 | 1.03mi |
| 1313 Ridgeview Dr Griffin, GA | 3.0 | 1.0 | 840 | $1,050 | $1.25 | 24d | 1 | 1.08mi |
| 812 E Tinsley St Unit 814 Griffin, GA | 2.0 | 1.0 | 800 | $975 | $1.22 | 44d | 1 | 1.12mi |
Listing history 16 events
-
2026-06-18days on market $139,900 Active 83 DOM
-
2026-06-17days on market $139,900 Active 82 DOM
-
2026-06-16days on market $139,900 Active 81 DOM
-
2026-06-15days on market $139,900 Active 80 DOM
-
2026-06-13days on market $139,900 Active 78 DOM
-
2026-06-09days on market $139,900 Active 74 DOM
-
2026-06-08days on market $139,900 Active 73 DOM
-
2026-06-07days on market $139,900 Active 72 DOM
-
2026-06-04days on market $139,900 Active 69 DOM
-
2026-06-03days on market $139,900 Active 68 DOM
-
2026-06-02days on market $139,900 Active 67 DOM
-
2026-06-01days on market $139,900 Active 66 DOM
-
2026-05-31days on market $139,900 Active 65 DOM
-
2026-03-26$139,900 New 559-char remark
Show marketing remark (559 chars)
NEW RENOVATION, COME SEE IT TODAY. This single family 2-bedroom, 1 bath home has been fully updated and move in ready at an incredible price! Everything brand new from top to bottom! Including brand new roof, new interior doors, bathroom upgrades, interior/exterior paint, and beautiful hardwood floors. The kitchen features new stainless-steel appliances, new kitchen cabinets, and granite countertops. There's even a large shed in the backyard for extra storage. The fully fenced back yard offers privacy and a carport is in the rear to park your vehicle.
-
2025-10-02soldstatus $78,000
-
2025-09-19soldstatus $51,500
ⓘ Source: listings_history table (triggers on properties + properties_extension) + one-shot
backfill from property_details.listing_events for pre-trigger history.
Tax reassessment forecast GA · Resets to sale price
- Current annual tax
- $691 · $58/mo
- Projected year-2 tax
- $1,287 · $107/mo
- Expected delta
- +$596/yr (+$50/mo · 86.3%)
ⓘ Screening estimate from a state-policy table — verify with the county assessor before closing.
Climate risk First Street
- Flood 1/10 Low FEMA zone X (unshaded) · 0% chance over 30 yrs
- Wildfire 3/10 Moderate
- Heat 6/10 Major 7 d/yr ≥104°F today · 18 d/yr by 30 yrs out
- Wind 6/10 Major 39% chance of damaging wind over 30 yrs
- Air quality 4/10 Moderate 4 unhealthy d/yr today · 5 by 30 yrs out
Nearby sold comps map
Loading sold comps map…
Walkable amenities ~0.75 mi
Loading nearby amenities…
Taxation est. · year 1
- Rental income
- $13,503
- − Mortgage interest
- −$7,837
- − Property taxes
- −$691
- − Insurance
- −$700
- − Repairs & maintenance
- −$1,080
- − Management
- −$1,080
- − Depreciation
- −$4,070
- Taxable loss
- −$1,955
- Est. tax savings @ 24.0%
- +$469
- After-tax cash flow
- $942/yr
For passive investors: Depreciation is non-cash, so a rental often shows a tax loss while cash-flowing — sheltering income. Rental losses are passive: they offset passive income freely, and up to $25,000/yr can offset ordinary (W-2) income if you actively participate and your MAGI is under $100k (phasing out to $0 by $150k); unused losses carry forward. On sale, claimed depreciation is recaptured at up to 25%, and gains may owe capital-gains tax (a 1031 exchange can defer both). Figures are a year-1 estimate at your 24.0% rate — not tax advice; consult a CPA.
Schools (NCES district)
- District
- Griffin-Spalding County
- NCES district ID
- 1302520
- Math proficiency
- 13% ▼ -13.00%
- Reading proficiency
- 19% ▼ -12.00%
- Median HH income
- $40,895
- Composite
- 13.71/100
- National rank
- #9496
- State rank
- #151 of 174 in GA
Livability — Griffin
- Score
- 54/100
- State rank
- #529
- US rank
- #23746
Category grades
Schools grade is shown separately in the Schools card above.
Census & demographics
- Census place
- Griffin, GA
- County
- Spalding County · 66,676 people
- City population
- 28,414
- Metro
- Atlanta-Sandy Springs-Alpharetta, GA
- Population (ZIP)
- 38,262
- Household income
- $59,054
- Rent vs Own
- Severe rent burden
- 1297.0
Population outlook (Spalding County) Hauer SSP2
- Today (2025)
- 63,015 people
- By 2030
- 61,689 · -2.1%
- By 2040
- 57,932 · -8.1%
- By 2050
- 53,474 · -15.1%
- By 2075
- 43,228 · -31.4%
- By 2100
- 32,290 · -48.8%
Race, ethnicity, and origin ACS 2023
- Neighborhood character
- Diverse neighborhood (Simpson 0.59)
- Race & ethnicity
- White 50% Black 38% Hispanic / Latino 7% Two or more races 5% Asian 1%
- Hispanic origin (detail)
- Mexican 5%
- Common ancestry
- Slovak 1% Serbian 1%
- Foreign-born
- 4% · Canada, South Korea
- Languages at home
- 92% English-only · Spanish 6% Korean 1%
Political lean MEDSL · Spalding
- 2024 margin
- R (+16.7) · D 41.4% · R 58.1%
- 2008→2024 swing
- +2.1pp toward D · 2008: -18.8pp · 2024: -16.7pp
- All cycles
- 2024: R+16.7 2020: R+20.8 2016: R+24.2 2012: R+20.0 2008: R+18.8
Not yet ingested
- Civics
- —
Market trends
- HPI YoY
- ▼ -142.92%
- Current HPI
- 225.7933
- Rent YoY
- ▲ 3.34%
- Metro
- Atlanta-Sandy Springs-Alpharetta, GA
- State GDP YoY
- ▲ 2.66%
- F500 in state
- 28
Industry mix (Fortune 500 HQ in GA)
| Industry | F500 HQs | Revenue |
|---|---|---|
| Paper / Packaging | 2 | $29B |
|
||
| Retail | 1 | $160B |
|
||
| Transportation / Logistics | 1 | $91B |
|
||
| Airlines | 1 | $62B |
|
||
| Consumer Goods | 1 | $47B |
|
||
| Utilities | 1 | $25B |
|
||
Price history
+171.7% since first listed3 events — show timeline
- 2026-03-26 Listed $139,900 GAMLS
- 2025-10-02 Sold (Public Records) $78,000 Public Records
- 2025-09-19 Sold (Public Records) $51,500 Public Records
Property tax history
+3.4%/yrLatest (2025): $691 · -2.2% YoY. Source: county tax records.
Cash-flow waterfall
monthlySold comps — $/sqft
last 12 mo · ≤1 miLoading sold comps…