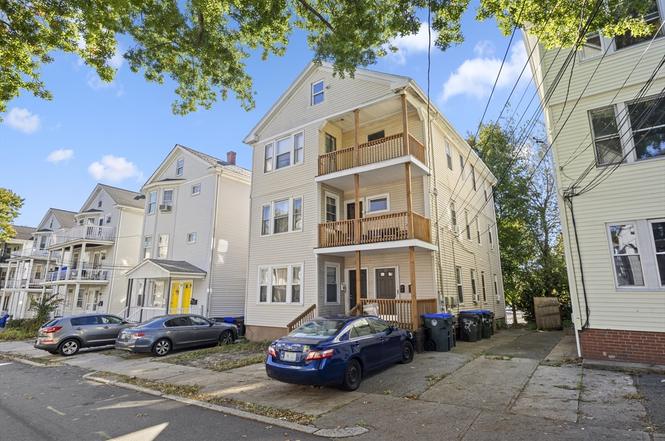
 Triplex
23 Richter St · Providence, RI
Flood risk 1/10 · Minimal
- FEMA flood zone
- X (unshaded)
- Chance of flooding over 30 yrs
- 0.0%
- Est. flood insurance / yr
- $473 – $860
Fire risk 1/10 · Minimal
- Est. fire insurance / yr
- $835 – $1,551
Heat risk 5/10 · Moderate
- Hot days now (above 97°F)
- 7 days/yr
- Hot days in 30 yrs
- 15 days/yr
Wind risk 6/10 · Moderate
- Chance of severe wind over 30 yrs
- 70.0%
Air-quality risk 2/10 · Minimal
- Unhealthy air days now
- 1 days/yr
- Unhealthy air days in 30 yrs
- 2 days/yr
Risk factors via First Street. Map © Google.
Why this score? — see what drove the C grade
The composite is a weighted blend of 9 inputs, each scored 0–100. Each bar is that input's sub-score; the figure is the points it added to the 100-point composite (weight × sub-score).
- Cash flow +25.3/30.0
- DSCR +8.3/10.0
- ARV discount +7.5/15.0
- 1% rule +6.3/10.0
- Livability +4.2/5.0
- Rent growth +3.9/5.0
- Condition / age +2.5/5.0
- Schools +1.0/10.0
- Appreciation +0.0/10.0
$649,900
🖨 Deal sheet 📄 Offer letter ✓ Due diligence
Multi-family units
County records classify this as Multi-Family (2-4 Unit). Listing-text estimate: 3 units. confirmed
Listing remarks MLS
Excellent Owner-Occupant or Investment Opportunity! Well-maintained 3-family featuring three 2-bedroom, 1-bath units. The first-floor unit has been recently updated with newer appliances, while the second and third-floor units are occupied by long-term tenants. Conveniently located near shopping, restaurants, downtown Providence, major highways, hospitals, and local universities. A great opportunity for investors or owner-occupants seeking income and long-term value.
Key facts
- 3,049 sq ft lot
- 3 parking spots
- Built 1930
Property features AI
Finance
- Other: Total building area 3,198 (unit breakdown not specified); Lot about 0.07 acres
- HOA & community: Not a senior community
Exterior
- Parking: Paved driveway with off-street open parking; 3 open parking spaces (3 total parking spaces)
- Utilities: Public sewer; Public water; 100 Amp electrical service
- Home design: 3-family building (3 units up/down); 3 stories total; 3 levels; Building faces not specified
- Construction: Brick/mortar foundation; Built year from public records (actual year not specified); Lead paint present
- Exterior features: Porch; Garden; City view; Publicly maintained road
Interior
- Kitchen: Kitchen included (appliances not specified)
- Bedrooms: Three separate units (each with bedroom counts not specified)
- Bathrooms: 3 full bathrooms
- Interior features: Living room; Dining room; Kitchen; 18 total rooms
- Laundry & utility: No specific laundry or utility appliances listed
Neighborhood map
What this means for you Summary
Snapshot
- This is a 3 × 2-bed/1.0-bath units multifamily listed at $650k.
Deal economics
- At list price, monthly cash flow is $1k ($18k/yr) — positive. Per door: $489/mo.
- The deal already cash-flows at list — no discount required.
- Meets the 1% rule at list price ($7k rent vs $650k).
- Cap rate 9.0% vs local median 4.2% in Providence — top-decile yield for the area; either an underpriced asset or a hidden risk that comps aren't pricing in. Stress-test before assuming the spread holds.
Location & tenants
- Location reads 84/100 on livability (#2 in RI, #794 nationally) — a professional / high-income tenant draw. Strengths: amenities A+, commute A+, housing A+; Watch: employment C-, schools F.
- Providence (urban): math 8% / reading 16% proficiency, ranked #34 of 39 in RI (top 87%) — low school quality limits family demand, transient renter base, plan for 1-2y turnover; 79% free/reduced lunch — lower-income household profile, screen leases tightly.
- Market conditions: Rents rising fast (+5.5%/yr); 161 active listings in the ZIP; 776 units permitted in Providence County in 2024 (229 in 5+ unit buildings).
- At $7,342/mo this rent would consume 121% of the median local household income ($73k/yr) (locally 1561% of renters already pay >50% of income on rent) — very limited rent-growth headroom before tenants either downsize or default.
Forward outlook
- Local home prices are declining (-3.0%/yr); year-one equity from $4k of loan paydown is wiped out by about $19k of value loss. Plan a longer hold.
- Providence County population projected at +5% by 2050 — modest demand growth; plan on rents tracking national, not racing it.
- At projected returns (-3.0% appreciation + 5.5% rent growth), your $182k cash investment doubles in ~9 years — after that, you're playing with house money.
Negotiation context
- Only 5 days on market — expect competitive offers; lowballing is unlikely to land.
- 10 sale attempts since 29y ago with the ask held roughly flat each time — persistent listings suggest the price (not the market) is what's stuck; bring a comps-based counter.
- Current owner paid $85k; list at $650k implies a 665% gain — meaningful room to come down on a strong offer.
Risks & watch-outs
- Watch-outs: built in 1930 — expect roof / HVAC / electrical / plumbing capex.
- Climate carrying-cost: major wind risk, 70% chance of damaging wind over 30y; extreme-heat days projected 7→15/yr by 2055 (HVAC capex compounding) — expect insurance premiums to compound above CPI over the hold.
Questions for the listing agent
- Can we see the unit-by-unit rent roll, current vacancy, and any below-market leases? What's the average tenancy length?
- What capital expenditures (roof, boiler, parking lot, exteriors) have been made in the last 5 years, and what's planned in the next 2?
- Built in 1930 — when were the roof, HVAC, electrical panel, plumbing, and water heater last replaced?
- Is there a deadline driving the sale (1031 exchange, divorce, estate, relocation)? That informs how much negotiation room exists.
- Schools are F-rated, which usually means shorter tenancies and higher turnover. Who's the typical renter profile here, and what's been the actual vacancy rate?
- What's the average days-on-market for RENTAL listings here right now (not sales)? A rising rental-DOM trend means longer vacancies and softer asking-rent achievability than the comps imply.
- What's the recent tenant-quality profile in this submarket — average credit score on applications, eviction rate, late-payment / NSF rate, and stable-employment percentage? A property-management company in the area should have these aggregated.
- How much new apartment / multifamily construction is in the pipeline within 1–3 miles? Heavy new supply (>2% of stock underway) typically softens rents 12–24 months out; light construction supports rent growth.
Investment metrics
- 1% rule
- 1.13% ✓
- Cap rate
- 9.00%
- Cash-on-cash
- 9.68%
- DSCR
- 1.43
- GRM
- 7.4
CMA / ARV
No comps found within radius.
Projected returns pro-forma
-3.0% appreciation · 5.46% rent growth · sell at horizon
- IRR
- 1.0%
- Equity multiple
- 1.04×
- Total profit
- $6,780
- Equity at exit
- $96,902
- IRR
- 12.9%
- Equity multiple
- 2.14×
- Total profit
- $206,656
- Equity at exit
- $56,191
Cash invested: $181,972 (down + closing). Projections, not guarantees.
Landlord ↔ Tenant lean methodology
- Overall (STATE)
- 31 Tenant-Leaning
- State Rhode Island
- 31 Tenant-Leaning · D+8
- County
- — inherits STATE
- City
- — inherits STATE
ZIP-level market 02908
- Home prices YoY
- -27.1%
- Rents YoY
- 5.5%
- Active inventory
- 161
- Price-to-rent
- 22.1×
Monthly cashflow live
- Estimated rent
- $7,342 high interval (Pro) →
- Mortgage (P&I)
- −$3,408
- Tax from tax record
- −$654 /mo · $7,846/yr
- Insurance
- −$271
- HOA
- −$0
- Vacancy / Maint / Mgmt
- −$1,542
- Net cashflow
- $1,467
Break-even live
3-unit breakdown (identical units grouped — click to expand)
| Units | Beds | Baths | Est. rent |
|---|---|---|---|
| 3× units | 2 | 1 | $7,341 |
| #1 | 2 | 1 | $2,447 |
| #2 | 2 | 1 | $2,447 |
| #3 | 2 | 1 | $2,447 |
| Total (3 units) | $7,342 | ||
UW: 25.0% down · 7.5% · 30yr · 1.5% tax · 5.0% vac · 8.0% maint · 8.0% mgmt
Financing live
Cash to close
- Down payment
- $162,475
- Closing costs
- $19,497
- Reserves months
- —
- Total cash needed
- —
Loan-product check · same deal, 3 products live
Conventional
25% down · 7.5% · 30yr
- Down + closing
- —
- Monthly P&I
- —
- Monthly cashflow
- —
- DSCR
- —
- Eligible?
- —
Personal DTI + credit; lowest rate.
DSCR
20% down · 8.5% · 30yr
- Down + closing
- —
- Monthly P&I
- —
- Monthly cashflow
- —
- DSCR
- —
- Eligible?
- —
No personal income docs; deal must DSCR.
Hard money
10% down · 12.0% · 12mo
- Down + closing
- —
- Monthly P&I
- —
- Monthly cashflow
- —
- DSCR
- —
- Eligible?
- —
Short-term bridge; refi at stabilization.
Listing history 6 events
-
2026-06-18days on market $649,900 Active 5 DOM
-
2026-06-17statusdays on market $649,900 Active 4 DOM
-
2026-06-16days on market $649,900 New 3 DOM
-
2026-06-15days on market $649,900 New 2 DOM
-
2026-06-13remarks 169-char remark
Show marketing remark (471 chars)
Excellent Owner-Occupant or Investment Opportunity! Well-maintained 3-family featuring three 2-bedroom, 1-bath units. The first-floor unit has been recently updated with newer appliances, while the second and third-floor units are occupied by long-term tenants. Conveniently located near shopping, restaurants, downtown Providence, major highways, hospitals, and local universities. A great opportunity for investors or owner-occupants seeking income and long-term value.
-
2026-06-13$649,900 New 1 DOM
Show marketing remark (471 chars)
Excellent Owner-Occupant or Investment Opportunity! Well-maintained 3-family featuring three 2-bedroom, 1-bath units. The first-floor unit has been recently updated with newer appliances, while the second and third-floor units are occupied by long-term tenants. Conveniently located near shopping, restaurants, downtown Providence, major highways, hospitals, and local universities. A great opportunity for investors or owner-occupants seeking income and long-term value.
ⓘ Source: listings_history table (triggers on properties + properties_extension) + one-shot
backfill from property_details.listing_events for pre-trigger history.
Tax reassessment forecast RI · Partial reset (capped growth)
- Current annual tax
- $7,846 · $654/mo
- Projected year-2 tax
- $9,220 · $768/mo
- Expected delta
- +$1,374/yr (+$114/mo · 17.5%)
ⓘ Screening estimate from a state-policy table — verify with the county assessor before closing.
Climate risk First Street
- Flood 1/10 Low FEMA zone X (unshaded) · 0% chance over 30 yrs
- Wildfire 1/10 Low
- Heat 5/10 Major 7 d/yr ≥97°F today · 15 d/yr by 30 yrs out
- Wind 6/10 Major 70% chance of damaging wind over 30 yrs
- Air quality 2/10 Low 1 unhealthy d/yr today · 2 by 30 yrs out
Nearby sold comps map
Loading sold comps map…
Walkable amenities ~0.75 mi
Loading nearby amenities…
Taxation est. · year 1
- Rental income
- $88,104
- − Mortgage interest
- −$36,405
- − Property taxes
- −$7,846
- − Insurance
- −$3,250
- − Repairs & maintenance
- −$7,048
- − Management
- −$7,048
- − Depreciation
- −$18,906
- Taxable income
- $7,601
- Est. tax owed @ 24.0%
- −$1,824
- After-tax cash flow
- $15,785/yr
For passive investors: Depreciation is non-cash, so a rental often shows a tax loss while cash-flowing — sheltering income. Rental losses are passive: they offset passive income freely, and up to $25,000/yr can offset ordinary (W-2) income if you actively participate and your MAGI is under $100k (phasing out to $0 by $150k); unused losses carry forward. On sale, claimed depreciation is recaptured at up to 25%, and gains may owe capital-gains tax (a 1031 exchange can defer both). Figures are a year-1 estimate at your 24.0% rate — not tax advice; consult a CPA.
Schools (NCES district)
- District
- Providence
- NCES district ID
- 4400900
- Math proficiency
- 8% ▼ -4.00%
- Reading proficiency
- 16% ▼ -2.00%
- Median HH income
- $38,197
- Composite
- 10.12/100
- National rank
- #9803
- State rank
- #34 of 39 in RI
Livability — Providence
- Score
- 84/100
- State rank
- #2
- US rank
- #794
Category grades
Schools grade is shown separately in the Schools card above.
Census & demographics
- Census place
- Providence, RI
- County
- Providence County · 548,917 people
- City population
- 212,734
- Metro
- Providence-Warwick, RI-MA
- Population (ZIP)
- 39,500
- Household income
- $73,081
- Rent vs Own
- Severe rent burden
- 1561.0
Population outlook (Providence County) Hauer SSP2
- Today (2025)
- 653,469 people
- By 2030
- 660,819 · +1.1%
- By 2040
- 672,747 · +3.0%
- By 2050
- 683,741 · +4.6%
- By 2075
- 720,435 · +10.2%
- By 2100
- 741,582 · +13.5%
Race, ethnicity, and origin ACS 2023
- Neighborhood character
- Diverse neighborhood (Simpson 0.68)
- Race & ethnicity
- Hispanic / Latino 43% White 33% Two or more races 22% Black 15% Asian 4%
- Hispanic origin (detail)
- Mexican 4% Puerto Rican 5% Dominican 16%
- Common ancestry
- Swiss 4% Hispanic 3% Russian 3%
- Foreign-born
- 33% · Canada, China, South Korea
- Languages at home
- 53% English-only · Spanish 36% French/Haitian/Cajun 4% Other Indo-European 2%
Political lean MEDSL · Providence
- 2024 margin
- D (+14.4) · D 56.1% · R 41.7% · Other 2.2%
- 2008→2024 swing
- -20.0pp toward R · 2008: 34.4pp · 2024: 14.4pp
- All cycles
- 2024: D+14.4 2020: D+22.9 2016: D+21.2 2012: D+34.9 2008: D+34.4
Not yet ingested
- Civics
- —
Market trends
- HPI YoY
- ▼ -151.12%
- Current HPI
- 407.0502
- Rent YoY
- ▲ 5.46%
- Metro
- Providence-Warwick, RI-MA
- State GDP YoY
- ▲ 2.25%
- F500 in state
- 10
Industry mix (Fortune 500 HQ in RI)
| Industry | F500 HQs | Revenue |
|---|---|---|
| Healthcare | 1 | $373B |
|
||
| Food Distribution | 1 | $31B |
|
||
| Aerospace / Defense | 1 | $14B |
|
||
| Financial Services | 1 | $8B |
|
||
| Consumer Goods | 1 | $4B |
|
||
Price history
+985.0% since first listed27 events — show timeline
- 2026-06-13 Listed $649,900 MLS PIN
- 2026-06-13 Listed $649,900 RIS
- 2026-05-01 Listing Removed — RIS
- 2026-03-29 Listed $599,900 RIS
- 2026-03-15 Listing Removed — RIS
- 2026-03-12 Price Changed $629,899 RIS
- 2026-01-08 Listed $629,900 RIS
- 2026-01-01 Price Changed $629,900 RIS
- 2025-12-29 Listing Removed — RIS
- 2025-12-20 Price Changed $648,900 RIS
- 2025-11-18 Listing Removed — RIS
- 2025-11-18 Listed $649,900 RIS
- 2025-10-01 Listed $674,900 RIS
- 2019-09-20 Price Changed $44,927 RIS
- 2016-11-08 Price Changed $279,900 RIS
- 2013-12-19 Price Changed $115,000 RIS
- 2009-04-27 Sold (Public Records) $85,000 Public Records
- 2009-04-24 Sold (MLS) $85,000 RIS
- 2009-01-22 Listing Removed — RIS
- 2008-05-26 Listed $210,000 RIS
- 2006-08-06 Listing Removed — RIS
- 2005-08-08 Listed $290,000 RIS
- 1999-02-02 Sold (MLS) $40,000 RIS
- 1998-11-11 Listing Removed — RIS
- 1998-08-06 Listed $49,927 RIS
- 1998-03-27 Listing Removed — RIS
- 1997-09-29 Listed $59,900 RIS
Property tax history
+3.0%/yrLatest (2025): $7,846 · +23.6% YoY. Source: county tax records.
Cash-flow waterfall
monthlySold comps — $/sqft
last 12 mo · ≤1 miLoading sold comps…