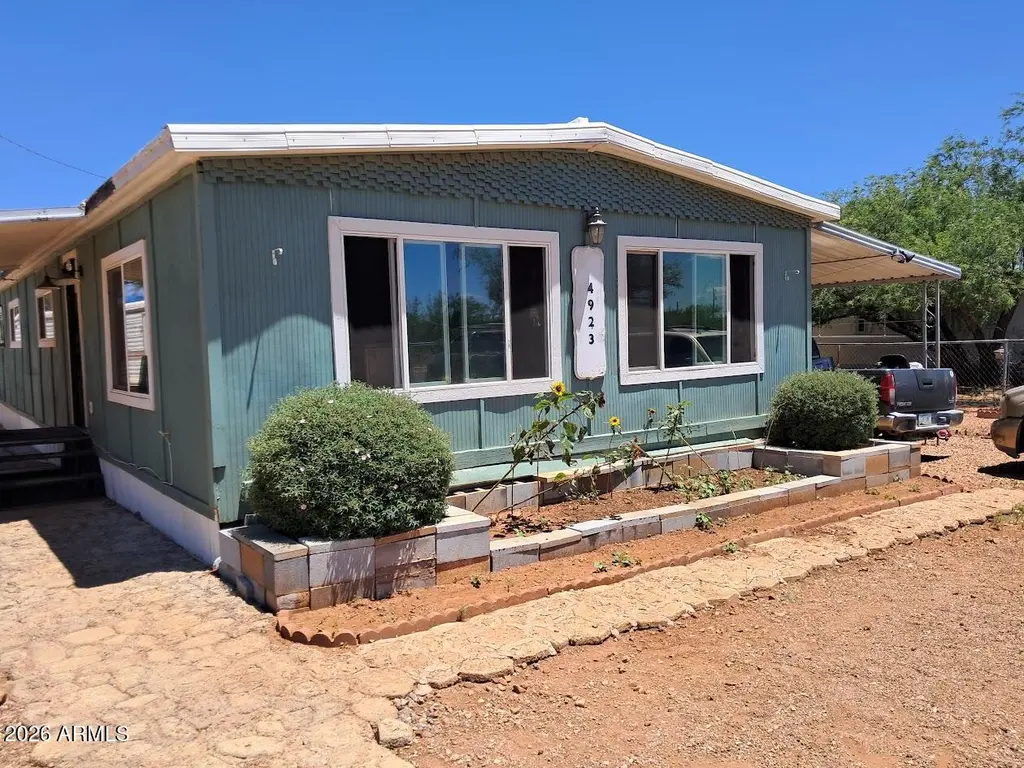
4923 E Bevers St · Sierra Vista Southeast, AZ
Flood risk 1/10 · Minimal
- FEMA flood zone
- X (unshaded)
- Chance of flooding over 30 yrs
- 0.0%
- Est. flood insurance / yr
- $507 – $1,088
Fire risk 7/10 · Major
- Est. fire insurance / yr
- $610 – $1,132
Heat risk 5/10 · Moderate
- Hot days now (above 97°F)
- 7 days/yr
- Hot days in 30 yrs
- 20 days/yr
Wind risk 1/10 · Minimal
- Chance of severe wind over 30 yrs
- —
Air-quality risk 1/10 · Minimal
- Unhealthy air days now
- 0 days/yr
- Unhealthy air days in 30 yrs
- 0 days/yr
Risk factors via First Street. Map © Google.
Why this score? — see what drove the B grade
The composite is a weighted blend of 9 inputs, each scored 0–100. Each bar is that input's sub-score; the figure is the points it added to the 100-point composite (weight × sub-score).
- Cash flow +30.0/30.0
- ARV discount +15.0/15.0
- DSCR +10.0/10.0
- 1% rule +8.4/10.0
- Livability +3.2/5.0
- Schools +2.9/10.0
- Rent growth +2.5/5.0
- Condition / age +2.5/5.0
- Appreciation +0.0/10.0
$130,000
🖨 Deal sheet (PDF) 📄 Offer letter ✓ Due diligence
Listing remarks MLS
This investment property is being sold in ''As is'' condition. Plenty of potential with a majority of the work already being done. This property has New windows, doors, and is ready for your design. Please ask for a list of additional materials included in this sell.
Key facts
- Fully fence
- Gravel landscaping
- 9,541 sq ft lot
Tags
Property features AI
Finance
- HOA & community: No association fees
Exterior
- Parking: 1 covered parking space; 1 carport space
- Utilities: Sewer connected; Private water company
- Home design: Single-family residence; Fee simple ownership; Property listed as fixer
- Construction: Wood siding and wood frame construction with steel frame elements; Painted exterior; Built-up / rolled (hot mop) roof
- Exterior features: Gravel/stone front and back yard; City-maintained road access
Interior
- Kitchen: Eat-in kitchen
- Bedrooms: Up to 3 bedrooms
- Flooring: Carpet; Tile
- Bathrooms: 1 full bathroom; 1 half bathroom
- Heating & cooling: Mini-split heating and cooling
- Interior features: Eat-in kitchen; Master bedroom with 3/4 bath
Neighborhood map
What this means for you Summary
Snapshot
- This is a 3-bed/1.5-bath manufactured listed at $130k.
Deal economics
- At list price, monthly cash flow is $603 ($7k/yr) — positive.
- The deal already cash-flows at list — no discount required.
- Meets the 1% rule at list price ($2k rent vs $130k).
- Recommended offer: $128k (1.5% below list) — sets the bar for market timing.
- Cap rate 11.9% vs local median 4.5% in Sierra Vista Southeast — top-decile yield for the area; either an underpriced asset or a hidden risk that comps aren't pricing in. Stress-test before assuming the spread holds.
Location & tenants
- Location reads 63/100 on livability (#113 in AZ) — a middle-class / working-renter tenant base. Strengths: cost of living A+, housing A+, employment B+; Watch: crime C-, amenities F, commute F.
- Sierra Vista Unified District (4175) (urban): math 27% / reading 39% proficiency, ranked #93 of 249 in AZ (top 37%) — families likely to look elsewhere, expect single-tenant / working-renter base with shorter leases.
- Zoned schools: Huachuca Mountain Elementary School (math 38% / reading 52%, grade D-, #334 of 1,109 statewide, top 30%, 416 students, 34% FRL); Joyce Clark Middle School (math 26% / reading 39%, grade F, #70 of 218 statewide, top 32%, 670 students, 46% FRL); Buena High School (math 19% / reading 29%, grade F, #202 of 381 statewide, top 54%, 1,836 students, 32% FRL) — zoned schools at 37% FRL track the district average.
- Market conditions: Rents flat; 180 active listings in the ZIP; 3 comparable units currently listed for rent nearby; rentals lingering (median 46d on market — plan ~5-8 weeks vacancy on turnover, expect pricing pressure); 100% of comp listings sitting > 30 days — soft ceiling on asking rent; 437 units permitted in Cochise County in 2024 (6 in 5+ unit buildings).
- This rent runs 34% of the median local income ($62k/yr) — at the standard rent-burdened threshold; future hikes will face affordability resistance.
Forward outlook
- Local home prices are declining (-3.0%/yr); year-one equity from $899 of loan paydown is wiped out by about $4k of value loss. Plan a longer hold.
- Cochise County population projected at -30% by 2050 — secular population decline; favor cash flow + early exit over multi-decade hold.
- At projected returns (-3.0% appreciation + 0.0% rent growth), your $36k cash investment doubles in ~8 years — after that, you're playing with house money.
Negotiation context
- It's been on market 30 days — a 2% lower offer ($128k) is reasonable based on typical stale-listing flexibility.
- 4 sale attempts since 5y ago with the ask held roughly flat each time — persistent listings suggest the price (not the market) is what's stuck; bring a comps-based counter.
- Current owner paid $36k; list at $130k implies a 261% gain — meaningful room to come down on a strong offer.
Risks & watch-outs
- Climate carrying-cost: major wildfire risk; extreme-heat days projected 7→20/yr by 2055 (HVAC capex compounding) — expect insurance premiums to compound above CPI over the hold.
Questions for the listing agent
- Built in 1973 — when were the roof, HVAC, electrical panel, plumbing, and water heater last replaced?
- Is there a deadline driving the sale (1031 exchange, divorce, estate, relocation)? That informs how much negotiation room exists.
- Schools are D-rated, which usually means shorter tenancies and higher turnover. Who's the typical renter profile here, and what's been the actual vacancy rate?
- What's the average days-on-market for RENTAL listings here right now (not sales)? A rising rental-DOM trend means longer vacancies and softer asking-rent achievability than the comps imply.
- What's the recent tenant-quality profile in this submarket — average credit score on applications, eviction rate, late-payment / NSF rate, and stable-employment percentage? A property-management company in the area should have these aggregated.
- How much new for-sale + rental construction is in the pipeline within 1–3 miles? Heavy new supply typically softens prices + rents 12–24 months out; constrained supply supports both.
Investment metrics
- 1% rule
- 1.34% ✓
- Cap rate
- 11.86%
- Cash-on-cash
- 19.88%
- DSCR
- 1.88
- GRM
- 6.2
CMA / ARV
- ARV (on-the-fly)
- $178,560
- Comps found
- 9
Show comp detail 9 sales within ~0.75 mi
| Address | Dist | Beds/Ba | Sqft | Sold | Price | $/sf | Match |
|---|---|---|---|---|---|---|---|
| 5085 E Clearview Ave | 0.23mi | 3/2.0 | 1,374 (-5%) | 6mo | $200,000 | $146 | 75 |
| 4846 E San Mateo St | 0.30mi | 3/2.0 | 1,475 (+2%) | 10mo | $235,000 | $159 | 72 |
| 4210 S Santa Lucia Ave S | 0.43mi | 3/2.0 | 1,456 (+1%) | 9mo | $230,000 | $158 | 69 |
| 3781 E Holly Pl | 0.71mi | 2/2.0 (-1) | 1,457 (+1%) | 1mo | $145,000 | $100 | 58 |
| 4912 S Tumbleweed Pl | 0.65mi | 2/2.0 (-1) | 1,442 (+0%) | 11mo | $179,500 | $124 | 53 |
| 4540 S San Pedro Ave | 0.29mi | 2/2.0 (-1) | 1,300 (-10%) | 13mo | $208,000 | $160 | 52 |
| 3843 S Ironwood Cir | 0.67mi | 4/2.0 (+1) | 1,459 (+1%) | 13mo | $179,900 | $123 | 49 |
| 4906 S Tumbleweed Pl | 0.68mi | 2/2.0 (-1) | 1,512 (+5%) | 6mo | $131,900 | $87 | 48 |
| 3807 S Ironwood Cir | 0.72mi | 4/1.5 (+1) | 1,602 (+11%) | 7mo | $149,900 | $94 | 37 |
Match score weights: distance 35% · size 25% · config 20% · recency 20%. Top-matched comps best support the ARV.
Projected returns pro-forma
-3.0% appreciation · 0.0% rent growth · sell at horizon
- IRR
- 8.8%
- Equity multiple
- 1.34×
- Total profit
- $12,204
- Equity at exit
- $19,383
- IRR
- 15.6%
- Equity multiple
- 2.10×
- Total profit
- $40,210
- Equity at exit
- $11,240
Cash invested: $36,400 (down + closing). Projections, not guarantees.
Landlord ↔ Tenant lean methodology
- Overall (STATE)
- 87 Strongly Landlord-Friendly
- State Arizona
- 87 Strongly Landlord-Friendly · R+3
- County
- — inherits STATE
- City
- — inherits STATE
ZIP-level market 85635
- Home prices YoY
- -32.3%
- Rents YoY
- 0.0%
- Active inventory
- 180
- Price-to-rent
- 6.2×
Monthly cashflow live
- Estimated rent
- $1,736 medium interval (Pro) →
- Mortgage (P&I)
- −$682
- Tax from tax record
- −$32 /mo · $386/yr
- Insurance
- −$54
- HOA
- −$0
- Vacancy / Maint / Mgmt
- −$364
- Net cashflow
- $603
Break-even live
Sensitivity live
| Price | -10% $677 | -5% $640 | +0% $603 | +5% $566 | +10% $529 |
|---|---|---|---|---|---|
| Rent | -10% $466 | -5% $535 | +0% $603 | +5% $672 | +10% $740 |
| Rate | -1.0pp $669 | -0.5pp $636 | base $603 | +0.5pp $569 | +1.0pp $535 |
UW: 25.0% down · 7.5% · 30yr · 1.5% tax · 5.0% vac · 8.0% maint · 8.0% mgmt
Financing live
Cash to close
- Down payment
- $32,500
- Closing costs
- $3,900
- Reserves months
- —
- Total cash needed
- —
Loan-product check · same deal, 3 products live
Conventional
25% down · 7.5% · 30yr
- Down + closing
- —
- Monthly P&I
- —
- Monthly cashflow
- —
- DSCR
- —
- Eligible?
- —
Personal DTI + credit; lowest rate.
DSCR
20% down · 8.5% · 30yr
- Down + closing
- —
- Monthly P&I
- —
- Monthly cashflow
- —
- DSCR
- —
- Eligible?
- —
No personal income docs; deal must DSCR.
Hard money
10% down · 12.0% · 12mo
- Down + closing
- —
- Monthly P&I
- —
- Monthly cashflow
- —
- DSCR
- —
- Eligible?
- —
Short-term bridge; refi at stabilization.
Rent comps 3 comps
| Address | Beds | Baths | Sqft | Rent | $/sqft | DOM | Units | Dist |
|---|---|---|---|---|---|---|---|---|
| 5333 S Santa Claus Ave Sierra Vista, AZ | 3.0 | 2.0 | 1738 | $1,900 | $1.09 | 45d | 1 | 1.18mi |
| 4413 Redwood St Sierra Vista, AZ | 3.0 | 2.0 | 1358 | $1,700 | $1.25 | 45d | 1 | 1.26mi |
| 4488 Resort Dr Sierra Vista, AZ | 3.0 | 2.0 | 1401 | $1,700 | $1.21 | 45d | 1 | 1.30mi |
Listing history 27 events
-
2026-06-21days on market $130,000 Active 30 DOM
-
2026-06-19days on market $130,000 Active 28 DOM
-
2026-06-18days on market $130,000 Active 27 DOM
-
2026-06-17days on market $130,000 Active 26 DOM
-
2026-06-16days on market $130,000 Active 25 DOM
-
2026-06-15days on market $130,000 Active 24 DOM
-
2026-06-14days on market $130,000 Active 22 DOM
-
2026-06-12days on market $130,000 Active 21 DOM
-
2026-06-09days on market $130,000 Active 18 DOM
-
2026-06-08days on market $130,000 Active 17 DOM
-
2026-06-07days on market $130,000 Active 16 DOM
-
2026-06-05days on market $130,000 Active 13 DOM
-
2026-06-03days on market $130,000 Active 12 DOM
-
2026-06-02days on market $130,000 Active 11 DOM
-
2026-06-01days on market $130,000 Active 10 DOM
-
2026-05-31days on market $130,000 Active 9 DOM
-
2026-05-30days on market $130,000 Active 8 DOM
-
2026-05-18$130,000 Active
-
2024-03-28historical
-
2024-01-12price $185,000
-
2023-12-12$195,000 Active
-
2021-11-15soldstatus $36,000 Closed 267-char remark
Show marketing remark (267 chars)
This investment property is being sold in ''As is'' condition. Plenty of potential with a majority of the work already being done. This property has New windows, doors, and is ready for your design. Please ask for a list of additional materials included in this sell.
-
2021-10-21historical Under Contract Accepting Backups 267-char remark
Show marketing remark (267 chars)
This investment property is being sold in ''As is'' condition. Plenty of potential with a majority of the work already being done. This property has New windows, doors, and is ready for your design. Please ask for a list of additional materials included in this sell.
-
2021-10-07price $39,500 267-char remark
Show marketing remark (267 chars)
This investment property is being sold in ''As is'' condition. Plenty of potential with a majority of the work already being done. This property has New windows, doors, and is ready for your design. Please ask for a list of additional materials included in this sell.
-
2021-09-16status Active 267-char remark
Show marketing remark (267 chars)
This investment property is being sold in ''As is'' condition. Plenty of potential with a majority of the work already being done. This property has New windows, doors, and is ready for your design. Please ask for a list of additional materials included in this sell.
-
2021-09-02status Pending 267-char remark
Show marketing remark (267 chars)
This investment property is being sold in ''As is'' condition. Plenty of potential with a majority of the work already being done. This property has New windows, doors, and is ready for your design. Please ask for a list of additional materials included in this sell.
-
2021-09-01$47,500 Active 267-char remark
Show marketing remark (267 chars)
This investment property is being sold in ''As is'' condition. Plenty of potential with a majority of the work already being done. This property has New windows, doors, and is ready for your design. Please ask for a list of additional materials included in this sell.
ⓘ Source: listings_history table (triggers on properties + properties_extension) + one-shot
backfill from property_details.listing_events for pre-trigger history.
Tax reassessment forecast AZ · Resets to sale price
- Current annual tax
- $386 · $32/mo
- Projected year-2 tax
- $858 · $72/mo
- Expected delta
- +$472/yr (+$39/mo · 122.5%)
ⓘ Screening estimate from a state-policy table — verify with the county assessor before closing.
Climate risk First Street
- Flood 1/10 Low FEMA zone X (unshaded) · 0% chance over 30 yrs
- Wildfire 7/10 Severe
- Heat 5/10 Major 7 d/yr ≥97°F today · 20 d/yr by 30 yrs out
- Wind 1/10 Low
- Air quality 1/10 Low 0 unhealthy d/yr today · 0 by 30 yrs out
Nearby sold comps map
Loading sold comps map…
Walkable amenities ~0.75 mi
Loading nearby amenities…
Taxation est. · year 1
- Rental income
- $20,827
- − Mortgage interest
- −$7,282
- − Property taxes
- −$386
- − Insurance
- −$650
- − Repairs & maintenance
- −$1,666
- − Management
- −$1,666
- − Depreciation
- −$3,782
- Taxable income
- $5,395
- Est. tax owed @ 24.0%
- −$1,295
- After-tax cash flow
- $5,942/yr
For passive investors: Depreciation is non-cash, so a rental often shows a tax loss while cash-flowing — sheltering income. Rental losses are passive: they offset passive income freely, and up to $25,000/yr can offset ordinary (W-2) income if you actively participate and your MAGI is under $100k (phasing out to $0 by $150k); unused losses carry forward. On sale, claimed depreciation is recaptured at up to 25%, and gains may owe capital-gains tax (a 1031 exchange can defer both). Figures are a year-1 estimate at your 24.0% rate — not tax advice; consult a CPA.
Schools (NCES district)
- District
- Sierra Vista Unified District (4175)
- NCES district ID
- 0401460
- Math proficiency
- 27% ▼ -19.00%
- Reading proficiency
- 39% ▼ -10.00%
- Median HH income
- $55,463
- Composite
- 29.17/100
- National rank
- #6573
- State rank
- #93 of 249 in AZ
Livability — Sierra Vista Southeast
- Score
- 63/100
- State rank
- #113
- US rank
- #15230
Category grades
Schools grade is shown separately in the Schools card above.
Census & demographics
- Census place
- Sierra Vista Southeast, AZ
- County
- Cochise County · 49,069 people
- City population
- 14,154
- Metro
- Sierra Vista-Douglas, AZ
- Population (ZIP)
- 34,193
- Household income
- $61,580
- Rent vs Own
- Severe rent burden
- 1129.0
Population outlook (Cochise County) Hauer SSP2
- Today (2025)
- 113,402 people
- By 2030
- 106,197 · -6.4%
- By 2040
- 92,166 · -18.7%
- By 2050
- 79,805 · -29.6%
- By 2075
- 56,831 · -49.9%
- By 2100
- 35,103 · -69.0%
Race, ethnicity, and origin ACS 2023
- Neighborhood character
- Diverse neighborhood (Simpson 0.60)
- Race & ethnicity
- White 58% Hispanic / Latino 25% Two or more races 17% Black 6% Asian 4%
- Hispanic origin (detail)
- Mexican 19% Puerto Rican 1%
- Common ancestry
- Romanian 3% Lithuanian 3% Italian 2%
- Foreign-born
- 11% · Canada, South Korea
- Languages at home
- 80% English-only · Spanish 14% Korean 2% German/W. Germanic 1%
Political lean MEDSL · Cochise
- 2024 margin
- Strong R (+23.1) · D 37.8% · R 61.0% · Other 1.2%
- 2008→2024 swing
- -2.5pp toward R · 2008: -20.7pp · 2024: -23.1pp
- All cycles
- 2024: R+23.1 2020: R+19.6 2016: R+22.6 2012: R+24.0 2008: R+20.7
Not yet ingested
- Civics
- —
Market trends
- HPI YoY
- ▼ -83.93%
- Current HPI
- 175.5821
- Rent YoY
- ▬ 0.00%
- Metro
- Sierra Vista-Douglas, AZ
- State GDP YoY
- ▲ 4.54%
- F500 in state
- 20
Industry mix (Fortune 500 HQ in AZ)
| Industry | F500 HQs | Revenue |
|---|---|---|
| Technology | 2 | $13B |
|
||
| Mining / Metals | 1 | $23B |
|
||
| Environmental Services | 1 | $16B |
|
||
| Metals / Steel | 1 | $14B |
|
||
| Technology Distribution | 1 | $9B |
|
||
| Homebuilding | 1 | $8B |
|
||
Price history
+173.7% since first listed10 events — show timeline
- 2026-05-18 Listed $130,000 ARMLS
- 2024-03-28 Listing Removed — ARMLS
- 2024-01-12 Price Changed $185,000 ARMLS
- 2023-12-12 Listed $195,000 ARMLS
- 2021-11-15 Sold (MLS) $36,000 ARMLS
- 2021-10-21 Contingent — ARMLS
- 2021-10-07 Price Changed $39,500 ARMLS
- 2021-09-16 Relisted — ARMLS
- 2021-09-02 Pending — ARMLS
- 2021-09-01 Listed $47,500 ARMLS
Property tax history
+4.1%/yrLatest (2025): $386 · +1.5% YoY. Source: county tax records.
Cash-flow waterfall
monthlySold comps — $/sqft
last 12 mo · ≤1 miLoading sold comps…