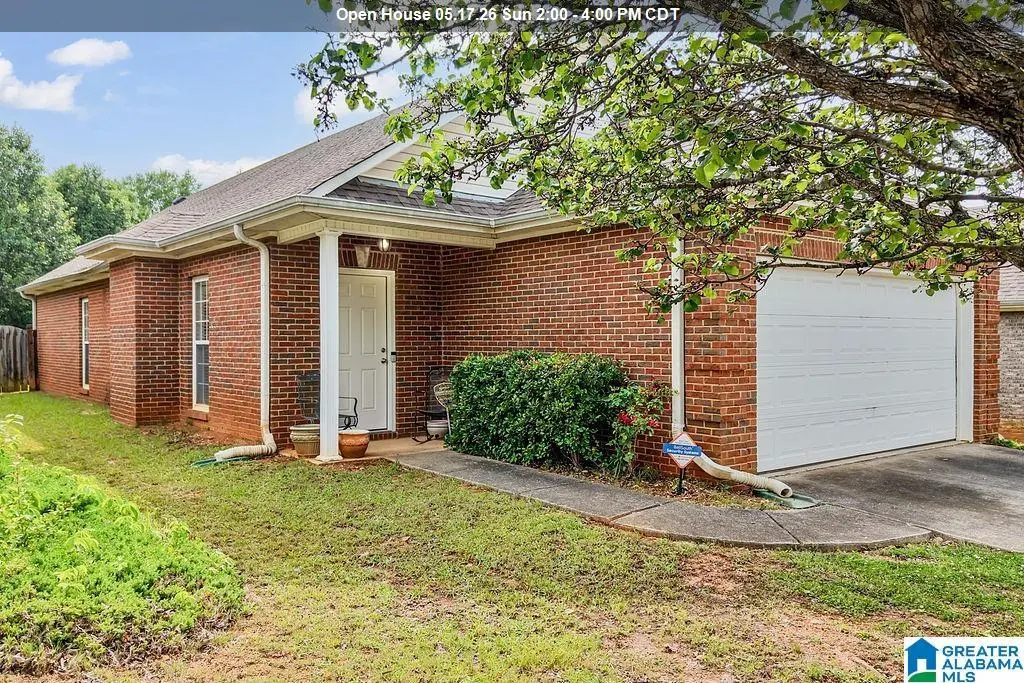
6217 Letson Farm Trl · McCalla, AL
Flood risk 1/10 · Minimal
- FEMA flood zone
- X (unshaded)
- Chance of flooding over 30 yrs
- 0.0%
- Est. flood insurance / yr
- $507 – $1,088
Fire risk 4/10 · Minor
- Est. fire insurance / yr
- $916 – $1,700
Heat risk 7/10 · Major
- Hot days now (above 108°F)
- 7 days/yr
- Hot days in 30 yrs
- 20 days/yr
Wind risk 6/10 · Moderate
- Chance of severe wind over 30 yrs
- 45.0%
Air-quality risk 2/10 · Minimal
- Unhealthy air days now
- 2 days/yr
- Unhealthy air days in 30 yrs
- 2 days/yr
Risk factors via First Street. Map © Google.
Why this score? — see what drove the D- grade
The composite is a weighted blend of 9 inputs, each scored 0–100. Each bar is that input's sub-score; the figure is the points it added to the 100-point composite (weight × sub-score).
- Cash flow +10.9/30.0
- ARV discount +7.1/15.0
- Rent growth +5.0/5.0
- DSCR +3.2/10.0
- Livability +2.5/5.0
- Condition / age +2.5/5.0
- 1% rule +2.3/10.0
- Schools +1.8/10.0
- Appreciation +0.0/10.0
$259,900
🖨 Deal sheet 📄 Offer letter ✓ Due diligence
Listing remarks
HUGE REDUCTION . .Welcome to 6217 Letson Farm Trail. Constructed with full brick, this three-bedroom, two-bath residence presents an exceptional living opportunity within the esteemed Letson Farms community. The home features a recently renovated kitchen, outfitted with new soft-close cabinetry, granite countertops, and stainless steel appliances. Elegant laminate hardwood flooring extends throughout the main living areas, complementing the high ceilings, crown molding, and arched entrances in the open living room. The generously proportioned primary suite includes a spacious master bath with a jetted tub, separate vanities, a separate shower, and a walk-in closet. Outside, a sizable, fully
Key facts
- Full brick
- Renovated kitchen
- Soft-close cabinetry
Tags
Property features AI
Finance
- Financial info: Annual fire fee of $400; Quarterly garbage fee of $60
- HOA & community: Monthly association fee of $41 covering common grounds maintenance, management fee, reserves for improvements, and utilities for common areas
Exterior
- Parking: Attached front-entry garage with 2 spaces (main level)
- Security: Security system
- Utilities: Public water; Connected sewer; Electric water heater; Underground utilities; Internet service available
- Home design: Existing home; Four-sided brick construction
- Construction: Slab foundation; Four-side brick exterior
- Exterior features: Fenced yard; Outdoor lighting system; Open patio; Garden/patio area; Community in-ground pool with perimeter fencing; Neighborhood amenities include bike trails, clubhouse, fishing, park, playground, private lake, sidewalks, street lights, swimming allowed, tennis courts and walking paths
Interior
- Kitchen: Stone countertops; Eating area and pantry; Cooktop (electric), built-in oven (electric), built-in microwave, built-in dishwasher, refrigerator, ice maker; Some stainless appliances, electric stove
- Bedrooms: Master bedroom on main level; Additional bedrooms on main level
- Flooring: Carpet; Hardwood laminate; Tile; Vinyl
- Bathrooms: Two full bathrooms; Master bath with separate shower, jetted tub, separate vanities, and linen closet; Secondary full bath (main level)
- Heating & cooling: Central heating and cooling; Gas heat with heat pump and piggyback system; Piggyback cooling/heat pump system
- Interior features: Cathedral/vaulted and 9+ ft ceilings with crown molding and smooth finishes; Recessed lighting; Security system; One gas fireplace with tile surround located in the living room
- Laundry & utility: Laundry on main level in a closet; Washer hookup and electric dryer hookup; Pull-down attic access
Neighborhood map
What this means for you Summary
Snapshot
- This is a 2-bed/2.0-bath single-family listed at $260k.
Deal economics
- At list price, monthly cash flow is $-112 ($-1k/yr) — negative.
- To cash-flow at today's rent, offer at most $240k (7.6% below list).
- To meet the 1% rule (rent ≥ 1% of price), the offer needs to be $189k (27.1% below list).
- Recommended offer: $189k (27.1% below list) — sets the bar for 1% rule.
- Cap rate 5.8% vs local median 4.5% in McCalla — meaningfully above typical; check what's discounted (condition, days-on-market, listing class) to confirm the premium yield is real.
Location & tenants
- Location reads: area grade D — affects rentability + tenant quality, not the cash-flow math above.
- Jefferson County (suburban): math 9% / reading 32% proficiency, ranked #104 of 129 in AL (top 81%) — low school quality limits family demand, transient renter base, plan for 1-2y turnover.
- Zoned schools: Mcadory Elementary School (math 14% / reading 40%, grade F, #392 of 627 statewide, top 65%, 667 students, 61% FRL); Mcadory High School (math 8% / reading 17%, grade F, #237 of 305 statewide, top 78%, 1,162 students, 72% FRL) — zoned schools average 67% FRL vs 49% district-wide (18 pts higher); higher-poverty schools than district average — tighter screening recommended.
- Market conditions: Rents rising fast (+14.8%/yr); 311 active listings in the ZIP; 2 comparable units currently listed for rent nearby; solid renter incomes; 2,114 units permitted in Jefferson County in 2024 (556 in 5+ unit buildings).
Forward outlook
- Local home prices are declining (-3.0%/yr); year-one equity from $2k of loan paydown is wiped out by about $8k of value loss. Plan a longer hold.
- Jefferson County population projected to shrink 4% by 2050 — rents likely to lag national; underwrite the cash flow, not the appreciation.
Negotiation context
- It's been on market 48 days — a 3% lower offer ($252k) is reasonable based on typical stale-listing flexibility.
Risks & watch-outs
- Climate carrying-cost: major wind risk, 45% chance of damaging wind over 30y; extreme-heat days projected 7→20/yr by 2055 (HVAC capex compounding) — expect insurance premiums to compound above CPI over the hold.
Questions for the listing agent
- What do current leases actually rent for vs. the listed asking? Can we see a recent rent roll and the last 12 months of T-12 income?
- It's been on market 48 days. Have you received any prior offers? Is the seller open to a 27% concession, seller financing, or rate buy-down credit?
- What does the HOA fee cover, when was the last increase, and are there any pending special assessments or reserve-fund shortfalls?
- Is there a deadline driving the sale (1031 exchange, divorce, estate, relocation)? That informs how much negotiation room exists.
- The area grade is low — what's the realistic commute time and amenity access for the typical tenant pool here? Any planned neighborhood developments (good or bad) we should know about?
- What's the average days-on-market for RENTAL listings here right now (not sales)? A rising rental-DOM trend means longer vacancies and softer asking-rent achievability than the comps imply.
- What's the recent tenant-quality profile in this submarket — average credit score on applications, eviction rate, late-payment / NSF rate, and stable-employment percentage? A property-management company in the area should have these aggregated.
- How much new for-sale + rental construction is in the pipeline within 1–3 miles? Heavy new supply typically softens prices + rents 12–24 months out; constrained supply supports both.
Investment metrics
- 1% rule
- 0.73% ✗
- Cap rate
- 5.78%
- Cash-on-cash
- -1.85%
- DSCR
- 0.92
- GRM
- 11.4
CMA / ARV
- ARV (median comp)
- $257,678
- List price
- $259,900
- Delta
- 0.86%
- Verdict
- FAIR
- Comps
- 20 within 1.0 mi
Show comp detail 12 sales within ~0.75 mi
| Address | Dist | Beds/Ba | Sqft | Sold | Price | $/sf | Match |
|---|---|---|---|---|---|---|---|
| 4793 Longmeadow Dr | 0.14mi | 3/2.0 (+1) | 1,395 (+4%) | 1mo | $160,000 | $115 | 81 |
| 6124 Letson Farms Dr | 0.19mi | 2/2.0 | 1,231 (-8%) | 5mo | $234,000 | $190 | 74 |
| 4717 Longmeadow Dr | 0.25mi | 2/2.0 | 1,276 (-5%) | 9mo | $229,900 | $180 | 73 |
| 4780 Longmeadow Dr | 0.15mi | 3/2.0 (+1) | 1,395 (+4%) | 10mo | $259,000 | $186 | 73 |
| 6108 Letson Farms Dr | 0.19mi | 2/2.0 | 1,230 (-8%) | 7mo | $245,000 | $199 | 72 |
| 4820 Longmeadow Ln | 0.12mi | 3/2.0 (+1) | 1,486 (+11%) | 1mo | $232,000 | $156 | 70 |
| 4733 Longmeadow Dr | 0.24mi | 2/2.0 | 1,231 (-8%) | 11mo | $228,000 | $185 | 66 |
| 6038 Townley Ct | 0.54mi | 2/2.0 | 1,374 (+3%) | 8mo | $205,000 | $149 | 63 |
| 6039 Cathwick Dr | 0.69mi | 2/2.0 | 1,340 (+0%) | 9mo | $220,000 | $164 | 60 |
| 6031 Cathwick Dr | 0.69mi | 2/2.0 | 1,322 (-1%) | 12mo | $228,000 | $172 | 56 |
| 4573 Gibson Dr | 0.53mi | 3/2.0 (+1) | 1,500 (+12%) | 13mo | $250,000 | $167 | 40 |
| 6447 Cheshire Cove Dr | 0.73mi | 3/2.0 (+1) | 1,518 (+14%) | 2mo | $259,500 | $171 | 36 |
Match score weights: distance 35% · size 25% · config 20% · recency 20%. Top-matched comps best support the ARV.
Projected returns pro-forma
-3.0% appreciation · 8.0% rent growth · sell at horizon
- IRR
- -14.5%
- Equity multiple
- 0.46×
- Total profit
- $-39,325
- Equity at exit
- $38,752
- IRR
- 0.3%
- Equity multiple
- 1.02×
- Total profit
- $1,778
- Equity at exit
- $22,471
Cash invested: $72,772 (down + closing). Projections, not guarantees.
Landlord ↔ Tenant lean methodology
- Overall (STATE)
- 90 Strongly Landlord-Friendly
- State Alabama
- 90 Strongly Landlord-Friendly · R+15
- County
- — inherits STATE
- City
- — inherits STATE
ZIP-level market 35022
- Home prices YoY
- -20.2%
- Rents YoY
- 14.8%
- Active inventory
- 311
- Price-to-rent
- 11.4×
Monthly cashflow live
- Estimated rent
- $1,894 medium interval (Pro) →
- Mortgage (P&I)
- −$1,363
- Tax from tax record
- −$96 /mo · $1,153/yr
- Insurance
- −$108
- HOA
- −$41
- Vacancy / Maint / Mgmt
- −$398
- Net cashflow
- $-112
Break-even live
UW: 25.0% down · 7.5% · 30yr · 1.5% tax · 5.0% vac · 8.0% maint · 8.0% mgmt
Financing live
Cash to close
- Down payment
- $64,975
- Closing costs
- $7,797
- Reserves months
- —
- Total cash needed
- —
Loan-product check · same deal, 3 products live
Conventional
25% down · 7.5% · 30yr
- Down + closing
- —
- Monthly P&I
- —
- Monthly cashflow
- —
- DSCR
- —
- Eligible?
- —
Personal DTI + credit; lowest rate.
DSCR
20% down · 8.5% · 30yr
- Down + closing
- —
- Monthly P&I
- —
- Monthly cashflow
- —
- DSCR
- —
- Eligible?
- —
No personal income docs; deal must DSCR.
Hard money
10% down · 12.0% · 12mo
- Down + closing
- —
- Monthly P&I
- —
- Monthly cashflow
- —
- DSCR
- —
- Eligible?
- —
Short-term bridge; refi at stabilization.
Rent comps 2 comps
| Address | Beds | Baths | Sqft | Rent | $/sqft | DOM | Units | Dist |
|---|---|---|---|---|---|---|---|---|
| 4737 Longmeadow Dr Bessemer, AL | 3.0 | 2.0 | 1356 | $1,815 | $1.34 | 10d | 1 | 0.23mi |
| 5725 Riverbirch Dr Bessemer, AL | 3.0 | 2.0 | 1620 | $2,050 | $1.27 | 1d | 1 | 0.82mi |
HOA detail
- Monthly dues
- $41 · $492/yr
Listing history 15 events
-
2026-06-18days on market $259,900 Active 48 DOM
-
2026-06-17days on market $259,900 Active 47 DOM
-
2026-06-16days on market $259,900 Active 46 DOM
-
2026-06-15days on market $259,900 Active 45 DOM
-
2026-06-13days on market $259,900 Active 43 DOM
-
2026-06-10days on market $259,900 Active 40 DOM
-
2026-06-09days on market $259,900 Active 39 DOM
-
2026-06-08days on market $259,900 Active 38 DOM
-
2026-06-07days on market $259,900 Active 37 DOM
-
2026-06-03days on market $259,900 Active 33 DOM
-
2026-06-02days on market $259,900 Active 32 DOM
-
2026-06-01days on market $259,900 Active 31 DOM
-
2026-05-31pricedays on market $259,900 Active 30 DOM
-
2026-05-11price $259,999 997-char remark
-
2026-05-01$269,900 Active 997-char remark
ⓘ Source: listings_history table (triggers on properties + properties_extension) + one-shot
backfill from property_details.listing_events for pre-trigger history.
Tax reassessment forecast AL · Resets to sale price
- Current annual tax
- $1,153 · $96/mo
- Projected year-2 tax
- $1,153 · $96/mo
- Expected delta
- $0/yr ($0/mo · 0.0%)
ⓘ Screening estimate from a state-policy table — verify with the county assessor before closing.
Climate risk First Street
- Flood 1/10 Low FEMA zone X (unshaded) · 0% chance over 30 yrs
- Wildfire 4/10 Moderate
- Heat 7/10 Severe 7 d/yr ≥108°F today · 20 d/yr by 30 yrs out
- Wind 6/10 Major 45% chance of damaging wind over 30 yrs
- Air quality 2/10 Low 2 unhealthy d/yr today · 2 by 30 yrs out
Nearby sold comps map
Loading sold comps map…
Walkable amenities ~0.75 mi
Loading nearby amenities…
Taxation est. · year 1
- Rental income
- $22,729
- − Mortgage interest
- −$14,558
- − Property taxes
- −$1,153
- − Insurance
- −$1,300
- − Repairs & maintenance
- −$1,818
- − Management
- −$1,818
- − HOA
- −$492
- − Depreciation
- −$7,561
- Taxable loss
- −$5,971
- Est. tax savings @ 24.0%
- +$1,433
- After-tax cash flow
- $89/yr
For passive investors: Depreciation is non-cash, so a rental often shows a tax loss while cash-flowing — sheltering income. Rental losses are passive: they offset passive income freely, and up to $25,000/yr can offset ordinary (W-2) income if you actively participate and your MAGI is under $100k (phasing out to $0 by $150k); unused losses carry forward. On sale, claimed depreciation is recaptured at up to 25%, and gains may owe capital-gains tax (a 1031 exchange can defer both). Figures are a year-1 estimate at your 24.0% rate — not tax advice; consult a CPA.
Schools (NCES district)
- District
- Jefferson County
- NCES district ID
- 0101920
- Math proficiency
- 9% ▼ -24.00%
- Reading proficiency
- 32% ▼ -5.00%
- Median HH income
- $51,712
- Composite
- 18.4/100
- National rank
- #8937
- State rank
- #104 of 129 in AL
Livability — McCalla
No livability data for this city. (Only ~50 U.S. cities are tracked.)
Census & demographics
- Census place
- McCalla, AL
- County
- Jefferson County · 527,445 people
- Metro
- Birmingham-Hoover, AL
- Population (ZIP)
- 23,126
- Household income
- $81,846
- Rent vs Own
- Severe rent burden
- 554.0
Population outlook (Jefferson County) Hauer SSP2
- Today (2025)
- 669,185 people
- By 2030
- 669,694 · +0.1%
- By 2040
- 661,388 · -1.2%
- By 2050
- 643,086 · -3.9%
- By 2075
- 577,267 · -13.7%
- By 2100
- 474,758 · -29.1%
Race, ethnicity, and origin ACS 2023
- Neighborhood character
- Diverse neighborhood (Simpson 0.56)
- Race & ethnicity
- Black 53% White 41% Hispanic / Latino 3% Two or more races 2% Asian 1%
- Common ancestry
- Italian 1% Slovak 1% Iranian 1%
- Foreign-born
- 4% · Canada, China
- Languages at home
- 96% English-only · Spanish 3% Chinese 1%
Political lean MEDSL · Jefferson
- 2024 margin
- D (+10.4) · D 54.6% · R 44.2% · Other 1.2%
- 2008→2024 swing
- +5.4pp toward D · 2008: 5.1pp · 2024: 10.4pp
- All cycles
- 2024: D+10.4 2020: D+13.2 2016: D+7.2 2012: D+6.0 2008: D+5.1
Not yet ingested
- Civics
- —
Market trends
- HPI YoY
- ▼ -55.40%
- Current HPI
- 219.3839
- Rent YoY
- ▲ 14.80%
- Metro
- Birmingham-Hoover, AL
- State GDP YoY
- ▲ 2.94%
- F500 in state
- 4
Industry mix (Fortune 500 HQ in AL)
| Industry | F500 HQs | Revenue |
|---|---|---|
| Financial Services | 1 | $8B |
|
||
| Healthcare | 1 | $5B |
|
||
Price history
-3.7% since first listed4 events — show timeline
- 2026-05-31 Price Changed $259,900 Greater Alabama MLS
- 2026-05-31 Price Changed $258,999 Greater Alabama MLS
- 2026-05-11 Price Changed $259,999 Greater Alabama MLS
- 2026-05-01 Listed $269,900 Greater Alabama MLS
Property tax history
+4.2%/yrLatest (2025): $1,153 · +1.0% YoY. Source: county tax records.
Cash-flow waterfall
monthlySold comps — $/sqft
last 12 mo · ≤1 miLoading sold comps…