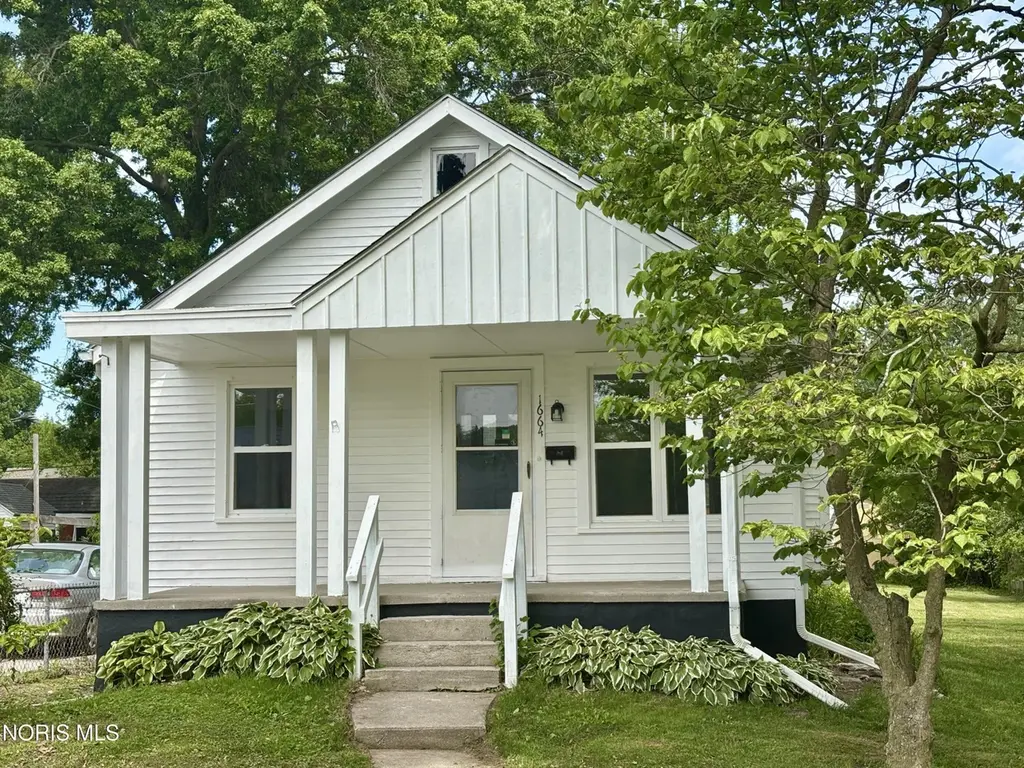
1664 Copley Dr · Toledo, OH
Flood risk 1/10 · Minimal
- FEMA flood zone
- X (unshaded)
- Chance of flooding over 30 yrs
- 0.0%
- Est. flood insurance / yr
- $473 – $860
Fire risk 1/10 · Minimal
- Est. fire insurance / yr
- $713 – $1,323
Heat risk 3/10 · Minor
- Hot days now (above 100°F)
- 7 days/yr
- Hot days in 30 yrs
- 16 days/yr
Wind risk 2/10 · Minimal
- Chance of severe wind over 30 yrs
- —
Air-quality risk 2/10 · Minimal
- Unhealthy air days now
- 1 days/yr
- Unhealthy air days in 30 yrs
- 1 days/yr
Risk factors via First Street. Map © Google.
Why this score? — see what drove the D grade
The composite is a weighted blend of 9 inputs, each scored 0–100. Each bar is that input's sub-score; the figure is the points it added to the 100-point composite (weight × sub-score).
- Cash flow +15.0/30.0
- ARV discount +7.0/15.0
- DSCR +4.6/10.0
- 1% rule +4.3/10.0
- Livability +3.3/5.0
- Rent growth +3.1/5.0
- Condition / age +2.5/5.0
- Schools +1.6/10.0
- Appreciation +0.0/10.0
$119,900
🖨 Deal sheet 📄 Offer letter ✓ Due diligence
Listing remarks MLS
Discover a fantastic investment opportunity or the perfect starter home in the heart of Toledo's Reynolds Corners area. This charming 2-bedroom residence features a spacious living and dining room combination, a full basement for extra storage, and a prime location just minutes from the expressway, shopping, and local Metroparks. While the property does not currently have a garage, the lot offers plenty of room to add one. Mark your calendars for April 21st at 4:00 PM—this property sells at or above the incredibly low minimum bid of just $39,000! Preview starts the day of the auction at 3:00 PM.
Key facts
- Covered front porch
- Completely remodeled
- Full basement
Tags
Property features AI
Exterior
- Parking: Driveway; Gravel parking
- Utilities: Electricity connected (100 amp service); Natural gas connected; Public water; Public sewer
- Home design: Single-family house; One story
- Construction: Vinyl siding; Block foundation
- Exterior features: Asphalt roof
Interior
- Kitchen: Dishwasher; Electric range; Microwave; Refrigerator
- Bedrooms: Two bedrooms on the main level (approx. 11' x 9' and 12' x 9')
- Flooring: Carpet; Laminate
- Bathrooms: 1 full bathroom
- Heating & cooling: Forced air heating (natural gas); Central air conditioning
- Interior features: Ceiling fan(s); Full basement
- Laundry & utility: Electric dryer hookup; Laundry located in basement
Neighborhood map
What this means for you Summary
Snapshot
- This is a 2-bed/1.0-bath single-family listed at $120k.
Deal economics
- At list price, monthly cash flow is $37 ($440/yr) — positive.
- The deal already cash-flows at list — no discount required.
- To meet the 1% rule (rent ≥ 1% of price), the offer needs to be $111k (7.1% below list).
- Recommended offer: $111k (7.1% below list) — sets the bar for 1% rule.
Location & tenants
- Location reads 66/100 on livability (#645 in OH) — a middle-class / working-renter tenant base. Strengths: cost of living A+, housing A+, health & safety A+; Watch: amenities C-, crime F, commute F.
- Toledo City (urban): math 15% / reading 24% proficiency, ranked #634 of 656 in OH (top 97%) — low school quality limits family demand, transient renter base, plan for 1-2y turnover; 72% free/reduced lunch — lower-income household profile, screen leases tightly.
- Zoned schools: Hawkins Elementary School (math 18% / reading 23%, grade F, #1,279 of 1,584 statewide, top 81%, 352 students, 0% FRL); Rogers High School (math 8% / reading 27%, grade F, #689 of 781 statewide, top 90%, 721 students, 0% FRL) — zoned schools average 0% FRL vs 72% district-wide (72 pts lower); this property's tenant base skews higher-income than the district average.
- Market conditions: Rents rising (+2.6%/yr); 114 active listings in the ZIP; 15 comparable units currently listed for rent nearby; rentals at typical pace (median 24d on market — plan ~3-4 weeks tenant-placement turnaround); 40% of comp listings sitting > 30 days — soft ceiling on asking rent; 415 units permitted in Lucas County in 2024 (122 in 5+ unit buildings).
Forward outlook
- Local home prices are declining (-3.0%/yr); year-one equity from $829 of loan paydown is wiped out by about $4k of value loss. Plan a longer hold.
- Lucas County population projected at -16% by 2050 — secular population decline; favor cash flow + early exit over multi-decade hold.
Negotiation context
- Only 13 days on market — expect competitive offers; lowballing is unlikely to land.
- 2 sale attempts with the ask held roughly flat each time — persistent listings suggest the price (not the market) is what's stuck; bring a comps-based counter.
- Current owner paid $64k; list at $120k implies a 88% gain — meaningful room to come down on a strong offer.
Risks & watch-outs
- Watch-outs: built in 1923 — expect roof / HVAC / electrical / plumbing capex.
Questions for the listing agent
- Built in 1923 — when were the roof, HVAC, electrical panel, plumbing, and water heater last replaced?
- Is there a deadline driving the sale (1031 exchange, divorce, estate, relocation)? That informs how much negotiation room exists.
- Schools are D-rated, which usually means shorter tenancies and higher turnover. Who's the typical renter profile here, and what's been the actual vacancy rate?
- Crime grade is F in this area — have there been break-ins, vandalism, or insurance claims at this property in the last 3 years? What carrier currently insures it and at what premium?
- The area grade is low — what's the realistic commute time and amenity access for the typical tenant pool here? Any planned neighborhood developments (good or bad) we should know about?
- What's the average days-on-market for RENTAL listings here right now (not sales)? A rising rental-DOM trend means longer vacancies and softer asking-rent achievability than the comps imply.
- What's the recent tenant-quality profile in this submarket — average credit score on applications, eviction rate, late-payment / NSF rate, and stable-employment percentage? A property-management company in the area should have these aggregated.
- How much new for-sale + rental construction is in the pipeline within 1–3 miles? Heavy new supply typically softens prices + rents 12–24 months out; constrained supply supports both.
Investment metrics
- 1% rule
- 0.93% ✗
- Cap rate
- 6.66%
- Cash-on-cash
- 1.31%
- DSCR
- 1.06
- GRM
- 9.0
CMA / ARV
- ARV (on-the-fly)
- $118,581
- Comps found
- 12
Show comp detail 12 sales within ~0.75 mi
| Address | Dist | Beds/Ba | Sqft | Sold | Price | $/sf | Match |
|---|---|---|---|---|---|---|---|
| 5349 Collomore Rd | 0.40mi | 3/1.0 (+1) | 836 (-1%) | 1mo | $150,000 | $179 | 75 |
| 1928 Copley Dr | 0.30mi | 2/1.0 | 859 (+2%) | 10mo | $76,000 | $88 | 74 |
| 5051 Wissman Rd | 0.24mi | 3/1.0 (+1) | 768 (-9%) | 5mo | $126,400 | $165 | 65 |
| 914 Sawyer Rd | 0.58mi | 2/1.0 | 792 (-6%) | 3mo | $92,000 | $116 | 61 |
| 1135 Sawyer Rd | 0.51mi | 3/1.0 (+1) | 800 (-5%) | 7mo | $145,000 | $181 | 57 |
| 5013 Brandon Rd | 0.42mi | 2/1.0 | 920 (+9%) | 13mo | $129,500 | $141 | 54 |
| 1022 Sibley Rd | 0.49mi | 3/1.0 (+1) | 864 (+3%) | 19mo | $110,000 | $127 | 51 |
| 627 Sibley Rd | 0.71mi | 2/1.0 | 792 (-6%) | 9mo | $80,000 | $101 | 50 |
| 1101 Sawyer Rd | 0.54mi | 2/1.0 | 962 (+14%) | 4mo | $71,500 | $74 | 47 |
| 5049 Kellogg Rd | 0.53mi | 3/2.0 (+1) | 912 (+8%) | 13mo | $172,900 | $190 | 42 |
| 1940 Woodbridge Rd | 0.72mi | 2/1.0 | 780 (-7%) | 18mo | $50,000 | $64 | 40 |
| 5609 Camberley Dr | 0.68mi | 2/1.0 | 720 (-14%) | 10mo | $115,000 | $160 | 36 |
Match score weights: distance 35% · size 25% · config 20% · recency 20%. Top-matched comps best support the ARV.
Projected returns pro-forma
-3.0% appreciation · 2.59% rent growth · sell at horizon
- IRR
- -14.7%
- Equity multiple
- 0.48×
- Total profit
- $-17,527
- Equity at exit
- $17,877
- IRR
- -6.6%
- Equity multiple
- 0.58×
- Total profit
- $-14,015
- Equity at exit
- $10,367
Cash invested: $33,572 (down + closing). Projections, not guarantees.
Landlord ↔ Tenant lean methodology
- Overall (STATE)
- 73 Landlord-Friendly
- State Ohio
- 73 Landlord-Friendly · R+6
- County
- — inherits STATE
- City
- — inherits STATE
ZIP-level market 43615
- Home prices YoY
- -31.9%
- Rents YoY
- 2.6%
- Active inventory
- 114
- Price-to-rent
- 9.0×
Monthly cashflow live
- Estimated rent
- $1,113 high interval (Pro) →
- Mortgage (P&I)
- −$629
- Tax from tax record
- −$164 /mo · $1,970/yr
- Insurance
- −$50
- HOA
- −$0
- Vacancy / Maint / Mgmt
- −$234
- Net cashflow
- $37
Break-even live
UW: 25.0% down · 7.5% · 30yr · 1.5% tax · 5.0% vac · 8.0% maint · 8.0% mgmt
Financing live
Cash to close
- Down payment
- $29,975
- Closing costs
- $3,597
- Reserves months
- —
- Total cash needed
- —
Loan-product check · same deal, 3 products live
Conventional
25% down · 7.5% · 30yr
- Down + closing
- —
- Monthly P&I
- —
- Monthly cashflow
- —
- DSCR
- —
- Eligible?
- —
Personal DTI + credit; lowest rate.
DSCR
20% down · 8.5% · 30yr
- Down + closing
- —
- Monthly P&I
- —
- Monthly cashflow
- —
- DSCR
- —
- Eligible?
- —
No personal income docs; deal must DSCR.
Hard money
10% down · 12.0% · 12mo
- Down + closing
- —
- Monthly P&I
- —
- Monthly cashflow
- —
- DSCR
- —
- Eligible?
- —
Short-term bridge; refi at stabilization.
Rent comps 15 comps
| Address | Beds | Baths | Sqft | Rent | $/sqft | DOM | Units | Dist |
|---|---|---|---|---|---|---|---|---|
| 1599 Twin Oaks Dr Toledo, OH | 2.0 | 1.0 | 864 | $976 | $1.13 | 14d | 1 | 0.16mi |
| 1318 Montain Rd Toledo, OH | 2.0 | 1.0 | 1050 | $1,195 | $1.14 | 21d | 1 | 0.18mi |
| 1169 Shadow Ln Unit 103 Toledo, OH | 1.0 | 1.0 | 975 | $849 | $0.87 | 23d | 1 | 0.35mi |
| 1101 Linden Ln Toledo, OH | 1.0–2.0 | 1.0–2.0 | 975 | $1,345 | $1.38 | 43d | 4 | 0.38mi |
| 5460 Dorr St Toledo, OH | 1.0–2.0 | 1.0 | 553 | $710 | $1.28 | 43d | 1 | 0.47mi |
| 1130 Pine Valley Ln Toledo, OH | 1.0–2.0 | 1.0–2.0 | 799 | $1,299 | $1.63 | 14d | 6 | 0.50mi |
| 4515 W Bancroft St Toledo, OH | 3.0 | 2.0 | 1120 | $1,500 | $1.34 | 14d | 1 | 0.80mi |
| 1926 N Holland Sylvania Rd Toledo, OH | 2.0 | 1.0 | 900 | $700 | $0.78 | 43d | 1 | 1.01mi |
| 1009 N Holland Sylvania Rd Toledo, OH | 2.0–3.0 | 1.0–2.0 | 1130 | $1,271 | $1.12 | 14d | 21 | 1.13mi |
| 2704 Westmar Ct Toledo, OH | 1.0–2.0 | 1.0–1.5 | 944 | $1,599 | $1.69 | 14d | 1 | 1.14mi |
| 5007 Hill Ave Unit 5 H Toledo, OH | 2.0 | 1.0 | 950 | $850 | $0.89 | 23d | 1 | 1.20mi |
| 4825 Hill Ave Unit 34 Toledo, OH | 1.0 | 1.0 | 600 | $595 | $0.99 | 43d | 1 | 1.23mi |
| 1230 Bedford Woods Dr Unit DR-8 Toledo, OH | 2.0 | 1.0 | 756 | $850 | $1.12 | 43d | 1 | 1.27mi |
| 4020 W Bancroft St Ottawa Hills, OH | 1.0 | 1.0 | 720 | $775 | $1.08 | 43d | 1 | 1.30mi |
| 4012 W Bancroft St Ottawa Hills, OH | 2.0 | 1.0 | 1008 | $972 | $0.96 | 23d | 1 | 1.31mi |
Listing history 10 events
-
2026-06-17status $119,900 Pending 13 DOM
-
2026-06-16days on market $119,900 Contingent 13 DOM
-
2026-06-15days on market $119,900 Contingent 12 DOM
-
2026-06-14statusdays on market $119,900 Contingent 10 DOM
-
2026-06-10days on market $119,900 Active 7 DOM
-
2026-06-09days on market $119,900 Active 6 DOM
-
2026-06-08days on market $119,900 Active 5 DOM
-
2026-06-07days on market $119,900 Active 4 DOM
-
2026-06-05remarks 699-char remark
-
2026-06-05$119,900 Active 1 DOM
ⓘ Source: listings_history table (triggers on properties + properties_extension) + one-shot
backfill from property_details.listing_events for pre-trigger history.
Tax reassessment forecast OH · Partial reset (capped growth)
- Current annual tax
- $1,970 · $164/mo
- Projected year-2 tax
- $1,970 · $164/mo
- Expected delta
- $0/yr ($0/mo · -0.0%)
ⓘ Screening estimate from a state-policy table — verify with the county assessor before closing.
Climate risk First Street
- Flood 1/10 Low FEMA zone X (unshaded) · 0% chance over 30 yrs
- Wildfire 1/10 Low
- Heat 3/10 Moderate 7 d/yr ≥100°F today · 16 d/yr by 30 yrs out
- Wind 2/10 Low
- Air quality 2/10 Low 1 unhealthy d/yr today · 1 by 30 yrs out
Nearby sold comps map
Loading sold comps map…
Walkable amenities ~0.75 mi
Loading nearby amenities…
Taxation est. · year 1
- Rental income
- $13,360
- − Mortgage interest
- −$6,716
- − Property taxes
- −$1,970
- − Insurance
- −$600
- − Repairs & maintenance
- −$1,069
- − Management
- −$1,069
- − Depreciation
- −$3,488
- Taxable loss
- −$1,551
- Est. tax savings @ 24.0%
- +$372
- After-tax cash flow
- $812/yr
For passive investors: Depreciation is non-cash, so a rental often shows a tax loss while cash-flowing — sheltering income. Rental losses are passive: they offset passive income freely, and up to $25,000/yr can offset ordinary (W-2) income if you actively participate and your MAGI is under $100k (phasing out to $0 by $150k); unused losses carry forward. On sale, claimed depreciation is recaptured at up to 25%, and gains may owe capital-gains tax (a 1031 exchange can defer both). Figures are a year-1 estimate at your 24.0% rate — not tax advice; consult a CPA.
Schools (NCES district)
- District
- Toledo City
- NCES district ID
- 3904490
- Math proficiency
- 15% ▼ -16.00%
- Reading proficiency
- 24% ▼ -13.00%
- Median HH income
- $32,137
- Composite
- 15.76/100
- National rank
- #9276
- State rank
- #634 of 656 in OH
Livability — Toledo
- Score
- 66/100
- State rank
- #645
- US rank
- #11442
Category grades
Schools grade is shown separately in the Schools card above.
Census & demographics
- Census place
- Toledo, OH
- County
- Lucas County · 380,724 people
- City population
- 280,811
- Metro
- Toledo, OH
- Population (ZIP)
- 40,146
- Household income
- $57,713
- Rent vs Own
- Severe rent burden
- 1683.0
Population outlook (Lucas County) Hauer SSP2
- Today (2025)
- 420,751 people
- By 2030
- 410,187 · -2.5%
- By 2040
- 384,019 · -8.7%
- By 2050
- 355,125 · -15.6%
- By 2075
- 291,683 · -30.7%
- By 2100
- 233,670 · -44.5%
Race, ethnicity, and origin ACS 2023
- Neighborhood character
- Majority White (62%)
- Race & ethnicity
- White 62% Black 26% Two or more races 6% Hispanic / Latino 4% Asian 3%
- Common ancestry
- Romanian 7% Lithuanian 3% Slovak 2%
- Foreign-born
- 5% · China, Canada
- Languages at home
- 93% English-only · Arabic 2% Spanish 1% Chinese 1%
Political lean MEDSL · Lucas
- 2024 margin
- D (+12.6) · D 55.8% · R 43.2%
- 2008→2024 swing
- -18.9pp toward R · 2008: 31.4pp · 2024: 12.6pp
- All cycles
- 2024: D+12.6 2020: D+16.8 2016: D+17.4 2012: D+30.4 2008: D+31.4
Not yet ingested
- Civics
- —
Market trends
- HPI YoY
- ▼ -96.44%
- Current HPI
- 205.95
- Rent YoY
- ▲ 2.59%
- Metro
- Toledo, OH
- State GDP YoY
- ▲ 1.98%
- F500 in state
- 48
Industry mix (Fortune 500 HQ in OH)
| Industry | F500 HQs | Revenue |
|---|---|---|
| Insurance | 3 | $145B |
|
||
| Industrial Machinery | 3 | $49B |
|
||
| Financial Services | 3 | $24B |
|
||
| Consumer Goods | 2 | $93B |
|
||
| Aerospace / Defense | 2 | $47B |
|
||
| Utilities | 2 | $33B |
|
||
Price history
+207.4% since first listed5 events — show timeline
- 2026-06-03 Listed $119,900 NORIS
- 2026-04-20 Sold (Public Records) $63,800 Public Records
- 2026-04-13 Sold (MLS) $63,900 NORIS
- 2026-04-03 Pending — NORIS
- 2026-03-23 Listed $39,000 NORIS
Property tax history
+4.1%/yrLatest (2025): $1,970 · -0.4% YoY. Source: county tax records.
Cash-flow waterfall
monthlySold comps — $/sqft
last 12 mo · ≤1 miLoading sold comps…