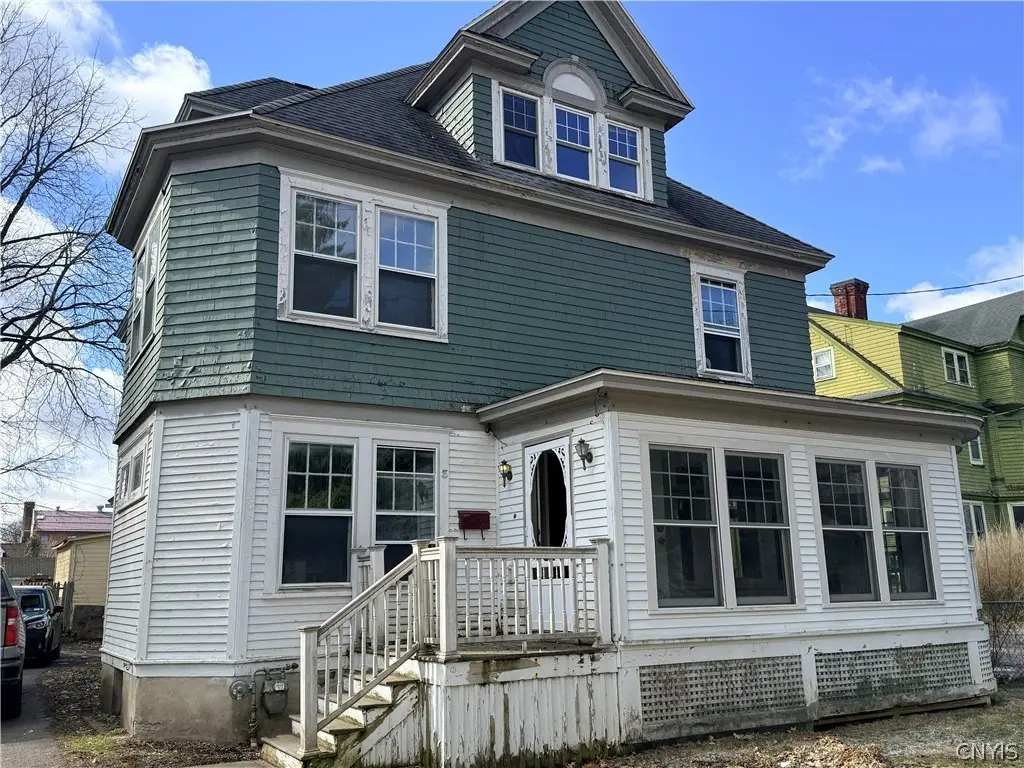
3 E Main St · Cortland, NY
Flood risk 1/10 · Minimal
- FEMA flood zone
- X (unshaded)
- Chance of flooding over 30 yrs
- 0.0%
- Est. flood insurance / yr
- $473 – $860
Fire risk 3/10 · Minor
- Est. fire insurance / yr
- $691 – $1,283
Heat risk 3/10 · Minor
- Hot days now (above 92°F)
- 8 days/yr
- Hot days in 30 yrs
- 17 days/yr
Wind risk 2/10 · Minimal
- Chance of severe wind over 30 yrs
- 1.0%
Air-quality risk 2/10 · Minimal
- Unhealthy air days now
- 0 days/yr
- Unhealthy air days in 30 yrs
- 1 days/yr
Risk factors via First Street. Map © Google.
Why this score? — see what drove the D- grade
The composite is a weighted blend of 9 inputs, each scored 0–100. Each bar is that input's sub-score; the figure is the points it added to the 100-point composite (weight × sub-score).
- Cash flow +9.0/30.0
- ARV discount +7.4/15.0
- Rent growth +4.6/5.0
- Schools +4.3/10.0
- Livability +3.9/5.0
- 1% rule +3.8/10.0
- DSCR +2.5/10.0
- Condition / age +2.5/5.0
- Appreciation +0.0/10.0
$215,000
🖨 Deal sheet (PDF) 📄 Offer letter ✓ Due diligence
Listing remarks
Impressive large city home filled with charm, character, and many unique highlights. Previously used as a 5-bedroom home with 3 full bathrooms, this property offers flexibility to fit your needs. The downstairs office was converted into a first-floor bedroom with a large attached full bathroom, making it perfect for guests, in-law space, or convenient first-floor living. This room can easily remain a 5th bedroom or be converted back into office space. Additional highlights include a large living room with plenty of windows for natural light, a formal dining room featuring beautiful stained glass windows, an inviting foyer with coat closet, first-floor laundry, an enclosed front porch, hardw
Key facts
- Formal dining room
- Hardwood floors
- First floor bedroom
Tags
Neighborhood map
What this means for you Summary
Snapshot
- This is a 4-bed/3.0-bath single-family listed at $215k.
Deal economics
- At list price, monthly cash flow is $-169 ($-2k/yr) — negative.
- To cash-flow at today's rent, offer at most $185k (13.9% below list).
- To meet the 1% rule (rent ≥ 1% of price), the offer needs to be $190k (11.7% below list).
- Recommended offer: $185k (13.9% below list) — sets the bar for cash-flow.
Location & tenants
- Location reads 77/100 on livability (#201 in NY, #3,105 nationally) — a middle-class / working-renter tenant base. Strengths: cost of living A+, housing A+, health & safety A+; Watch: crime C-, employment D, commute F.
- Cortland City School District (town): math 49% / reading 54% proficiency, ranked #368 of 590 in NY (top 62%) — acceptable for families but not a draw, mixed tenant base, ~2y average lease.
- Zoned schools: Fe Smith Intermediate School (math 42% / reading 47%, grade F, #1,277 of 2,108 statewide, top 64%, 271 students, 65% FRL); Cortland High School (math 92% / reading 92%, grade A+, #171 of 1,100 statewide, top 18%, 596 students, 42% FRL).
- Zoned-school proficiency averages 68% at this address vs 52% district-wide (+17 pts) — the actual schools serving this property are materially stronger than the Cortland City School District average implies; a family-tenant draw the district grade alone would hide.
- Market conditions: Rents rising fast (+8.4%/yr); 141 active listings in the ZIP; 1 comparable units currently listed for rent nearby; 45 units permitted in Cortland County in 2024 (12 in 5+ unit buildings).
- This rent runs 33% of the median local income ($70k/yr) — at the standard rent-burdened threshold; future hikes will face affordability resistance.
Forward outlook
- Local home prices are declining (-3.0%/yr); year-one equity from $1k of loan paydown is wiped out by about $6k of value loss. Plan a longer hold.
- Cortland County population projected at -15% by 2050 — secular population decline; favor cash flow + early exit over multi-decade hold.
Negotiation context
- It's been on market 20 days — a 2% lower offer ($212k) is reasonable based on typical stale-listing flexibility.
- Current owner paid $78k; list at $215k implies a 176% gain — meaningful room to come down on a strong offer.
Risks & watch-outs
- Watch-outs: property tax is 2.5% of price; built in 1880 — expect roof / HVAC / electrical / plumbing capex.
Questions for the listing agent
- What do current leases actually rent for vs. the listed asking? Can we see a recent rent roll and the last 12 months of T-12 income?
- Built in 1880 — when were the roof, HVAC, electrical panel, plumbing, and water heater last replaced?
- Property tax is high relative to price — has the assessment been appealed recently, and will the sale trigger a re-assessment?
- Is there a deadline driving the sale (1031 exchange, divorce, estate, relocation)? That informs how much negotiation room exists.
- Schools are D-rated, which usually means shorter tenancies and higher turnover. Who's the typical renter profile here, and what's been the actual vacancy rate?
- The area grade is low — what's the realistic commute time and amenity access for the typical tenant pool here? Any planned neighborhood developments (good or bad) we should know about?
- What's the average days-on-market for RENTAL listings here right now (not sales)? A rising rental-DOM trend means longer vacancies and softer asking-rent achievability than the comps imply.
- What's the recent tenant-quality profile in this submarket — average credit score on applications, eviction rate, late-payment / NSF rate, and stable-employment percentage? A property-management company in the area should have these aggregated.
- How much new for-sale + rental construction is in the pipeline within 1–3 miles? Heavy new supply typically softens prices + rents 12–24 months out; constrained supply supports both.
Investment metrics
- 1% rule
- 0.88% ✗
- Cap rate
- 5.35%
- Cash-on-cash
- -3.37%
- DSCR
- 0.85
- GRM
- 9.4
CMA / ARV
- ARV (on-the-fly)
- $214,452
- Comps found
- 8
Show comp detail 8 sales within ~0.75 mi
| Address | Dist | Beds/Ba | Sqft | Sold | Price | $/sf | Match |
|---|---|---|---|---|---|---|---|
| 44 W West Court St | 0.53mi | 4/2.5 | 2,600 (+2%) | 11mo | $312,500 | $120 | 60 |
| 13-15 Brown Ave | 0.26mi | 5/2.0 (+1) | 2,702 (+6%) | 15mo | $50,900 | $19 | 56 |
| 38 W Court St | 0.51mi | 4/2.5 | 2,738 (+7%) | 13mo | $311,000 | $114 | 51 |
| 27 Charles St | 0.20mi | 4/2.0 | 2,234 (-12%) | 21mo | $144,329 | $65 | 48 |
| 26 Miller St | 0.36mi | 4/1.5 | 2,264 (-11%) | 21mo | $189,900 | $84 | 41 |
| 15 Monroe | 0.47mi | 4/3.0 | 2,246 (-12%) | 23mo | $210,000 | $93 | 39 |
| 15 Hamlin St | 0.66mi | 3/1.5 (-1) | 2,256 (-12%) | 6mo | $140,000 | $62 | 34 |
| 156 Central Ave | 0.73mi | 4/1.5 | 2,302 (-10%) | 15mo | $182,000 | $79 | 31 |
Match score weights: distance 35% · size 25% · config 20% · recency 20%. Top-matched comps best support the ARV.
Projected returns pro-forma
-3.0% appreciation · 8.0% rent growth · sell at horizon
- IRR
- -15.8%
- Equity multiple
- 0.41×
- Total profit
- $-35,452
- Equity at exit
- $32,057
- IRR
- 0.3%
- Equity multiple
- 1.02×
- Total profit
- $1,459
- Equity at exit
- $18,589
Cash invested: $60,200 (down + closing). Projections, not guarantees.
Landlord ↔ Tenant lean methodology
- Overall (STATE)
- 15 Strongly Tenant-Friendly
- State New York
- 15 Strongly Tenant-Friendly · D+10
- County
- — inherits STATE
- City
- — inherits STATE
ZIP-level market 13045
- Home prices YoY
- -9.3%
- Rents YoY
- 8.4%
- Active inventory
- 141
- Price-to-rent
- 9.4×
Monthly cashflow live
- Estimated rent
- $1,897 medium interval (Pro) →
- Mortgage (P&I)
- −$1,127
- Tax from tax record
- −$451 /mo · $5,414/yr
- Insurance
- −$90
- HOA
- −$0
- Vacancy / Maint / Mgmt
- −$398
- Net cashflow
- $-169
Break-even live
Sensitivity live
| Price | -10% $-48 | -5% $-108 | +0% $-169 | +5% $-230 | +10% $-291 |
|---|---|---|---|---|---|
| Rent | -10% $-319 | -5% $-244 | +0% $-169 | +5% $-94 | +10% $-19 |
| Rate | -1.0pp $-61 | -0.5pp $-115 | base $-169 | +0.5pp $-225 | +1.0pp $-282 |
UW: 25.0% down · 7.5% · 30yr · 1.5% tax · 5.0% vac · 8.0% maint · 8.0% mgmt
Financing live
Cash to close
- Down payment
- $53,750
- Closing costs
- $6,450
- Reserves months
- —
- Total cash needed
- —
Loan-product check · same deal, 3 products live
Conventional
25% down · 7.5% · 30yr
- Down + closing
- —
- Monthly P&I
- —
- Monthly cashflow
- —
- DSCR
- —
- Eligible?
- —
Personal DTI + credit; lowest rate.
DSCR
20% down · 8.5% · 30yr
- Down + closing
- —
- Monthly P&I
- —
- Monthly cashflow
- —
- DSCR
- —
- Eligible?
- —
No personal income docs; deal must DSCR.
Hard money
10% down · 12.0% · 12mo
- Down + closing
- —
- Monthly P&I
- —
- Monthly cashflow
- —
- DSCR
- —
- Eligible?
- —
Short-term bridge; refi at stabilization.
Rent comps 1 comps
| Address | Beds | Baths | Sqft | Rent | $/sqft | DOM | Units | Dist |
|---|---|---|---|---|---|---|---|---|
| 16 Pendleton St #1 Cortland, NY | 3.0 | 1.0 | 2000 | $1,400 | $0.70 | 45d | 1 | 0.42mi |
Listing history 3 events
-
2026-04-16status Pending
-
2026-03-27$215,000 Active
-
2019-06-10soldstatus $78,000
ⓘ Source: listings_history table (triggers on properties + properties_extension) + one-shot
backfill from property_details.listing_events for pre-trigger history.
Tax reassessment forecast NY · Partial reset (capped growth)
- Current annual tax
- $5,414 · $451/mo
- Projected year-2 tax
- $5,414 · $451/mo
- Expected delta
- $0/yr ($0/mo · 0.0%)
ⓘ Screening estimate from a state-policy table — verify with the county assessor before closing.
Climate risk First Street
- Flood 1/10 Low FEMA zone X (unshaded) · 0% chance over 30 yrs
- Wildfire 3/10 Moderate
- Heat 3/10 Moderate 8 d/yr ≥92°F today · 17 d/yr by 30 yrs out
- Wind 2/10 Low 100% chance of damaging wind over 30 yrs
- Air quality 2/10 Low 0 unhealthy d/yr today · 1 by 30 yrs out
Nearby sold comps map
Loading sold comps map…
Walkable amenities ~0.75 mi
Loading nearby amenities…
Taxation est. · year 1
- Rental income
- $22,770
- − Mortgage interest
- −$12,043
- − Property taxes
- −$5,414
- − Insurance
- −$1,075
- − Repairs & maintenance
- −$1,822
- − Management
- −$1,822
- − Depreciation
- −$6,255
- Taxable loss
- −$5,661
- Est. tax savings @ 24.0%
- +$1,359
- After-tax cash flow
- $-673/yr
For passive investors: Depreciation is non-cash, so a rental often shows a tax loss while cash-flowing — sheltering income. Rental losses are passive: they offset passive income freely, and up to $25,000/yr can offset ordinary (W-2) income if you actively participate and your MAGI is under $100k (phasing out to $0 by $150k); unused losses carry forward. On sale, claimed depreciation is recaptured at up to 25%, and gains may owe capital-gains tax (a 1031 exchange can defer both). Figures are a year-1 estimate at your 24.0% rate — not tax advice; consult a CPA.
Schools (NCES district)
- District
- Cortland City School District
- NCES district ID
- 3608460
- Math proficiency
- 49% ▲ 6.00%
- Reading proficiency
- 54% ▲ 17.00%
- Median HH income
- $42,413
- Composite
- 43.29/100
- National rank
- #3041
- State rank
- #368 of 590 in NY
Livability — Cortland
- Score
- 77/100
- State rank
- #201
- US rank
- #3105
Category grades
Schools grade is shown separately in the Schools card above.
Census & demographics
- Census place
- Cortland, NY
- County
- Cortland County · 28,361 people
- City population
- 28,361
- Metro
- Cortland, NY
- Population (ZIP)
- 28,361
- Household income
- $69,961
- Rent vs Own
- Severe rent burden
- 1488.0
Population outlook (Cortland County) Hauer SSP2
- Today (2025)
- 47,543 people
- By 2030
- 46,107 · -3.0%
- By 2040
- 43,122 · -9.3%
- By 2050
- 40,216 · -15.4%
- By 2075
- 34,717 · -27.0%
- By 2100
- 28,953 · -39.1%
Race, ethnicity, and origin ACS 2023
- Neighborhood character
- Predominantly White (87%)
- Race & ethnicity
- White 87% Two or more races 5% Hispanic / Latino 5% Black 3% Asian 2%
- Common ancestry
- Romanian 4% Lithuanian 2% Italian 2%
- Foreign-born
- 3% · Canada, China
- Languages at home
- 94% English-only · Spanish 2% Russian/Polish/Slavic 2% Other Indo-European 1%
Political lean MEDSL · Cortland
- 2024 margin
- Lean R (+6.4) · D 46.8% · R 53.2%
- 2008→2024 swing
- -16.4pp toward R · 2008: 10.0pp · 2024: -6.4pp
- All cycles
- 2024: R+6.4 2020: R+1.9 2016: R+6.7 2012: D+8.8 2008: D+10.0
Not yet ingested
- Civics
- —
Market trends
- HPI YoY
- ▼ -29.78%
- Current HPI
- 289.515
- Rent YoY
- ▲ 8.37%
- Metro
- Cortland, NY
- State GDP YoY
- ▲ 2.60%
- F500 in state
- 92
Industry mix (Fortune 500 HQ in NY)
| Industry | F500 HQs | Revenue |
|---|---|---|
| Financial Services | 10 | $950B |
|
||
| Consumer Goods | 9 | $162B |
|
||
| Insurance | 4 | $225B |
|
||
| Telecommunications | 2 | $144B |
|
||
| Pharmaceuticals | 2 | $112B |
|
||
| Media / Entertainment | 2 | $69B |
|
||
Price history
+175.6% since first listed3 events — show timeline
- 2026-04-16 Pending — CNYIS
- 2026-03-27 Listed $215,000 CNYIS
- 2019-06-10 Sold (Public Records) $78,000 Public Records
Property tax history
-1.2%/yrLatest (2025): $5,414 · +3.9% YoY. Source: county tax records.
Cash-flow waterfall
monthlySold comps — $/sqft
last 12 mo · ≤1 miLoading sold comps…