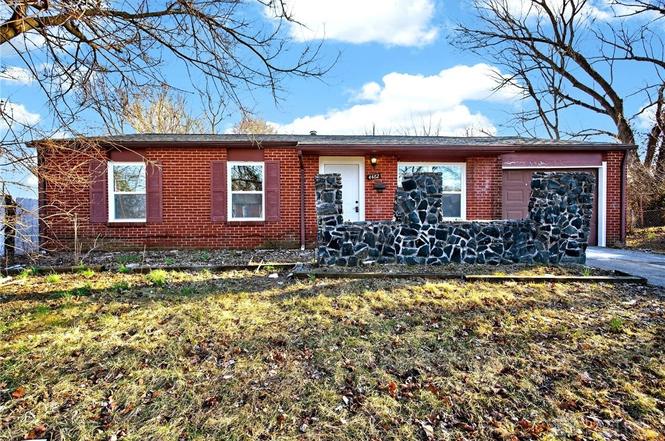
4482 Gaiter Ln · Dayton, OH
Flood risk 8/10 · Major
- FEMA flood zone
- X (unshaded)
- Chance of flooding over 30 yrs
- 0.99%
- Est. flood insurance / yr
- $507 – $1,088
Fire risk 1/10 · Minimal
- Est. fire insurance / yr
- $713 – $1,323
Heat risk 3/10 · Minor
- Hot days now (above 104°F)
- 7 days/yr
- Hot days in 30 yrs
- 19 days/yr
Wind risk 2/10 · Minimal
- Chance of severe wind over 30 yrs
- 1.0%
Air-quality risk 3/10 · Minor
- Unhealthy air days now
- 3 days/yr
- Unhealthy air days in 30 yrs
- 4 days/yr
Risk factors via First Street. Map © Google.
Why this score? — see what drove the D- grade
The composite is a weighted blend of 9 inputs, each scored 0–100. Each bar is that input's sub-score; the figure is the points it added to the 100-point composite (weight × sub-score).
- Cash flow +17.2/30.0
- DSCR +5.4/10.0
- 1% rule +3.8/10.0
- Rent growth +3.5/5.0
- Livability +3.2/5.0
- Condition / age +2.5/5.0
- Schools +1.3/10.0
- ARV discount +0.2/15.0
- Appreciation +0.0/10.0
$129,800
🖨 Deal sheet 📄 Offer letter ✓ Due diligence
Listing remarks
Welcome home to 4482 Gaiter Lane in Dayton! This fully remodeled brick ranch offers 3 bedrooms, 1 bathroom, and the ease of single-level slab living — perfect for low-maintenance comfort. From the moment you step inside, you’re greeted by a spacious living room featuring new can lighting and a stylish ceiling fan, creating a bright and inviting atmosphere. Just off the living room, the eat-in kitchen shines with all-new cabinetry, beautiful quartz countertops, and a timeless design that blends function and style. The primary bedroom offers ample storage, while two additional bedrooms provide flexibility for family, guests, or a home office. Convenient hallway laundry space is lo
Key facts
- Quartz countertops
- Eat-in kitchen
- All-new cabinetry
Tags
Neighborhood map
What this means for you Summary
Snapshot
- This is a 3-bed/1.0-bath single-family listed at $130k.
Deal economics
- At list price, monthly cash flow is $26 ($311/yr) — positive.
- The deal already cash-flows at list — no discount required.
- To meet the 1% rule (rent ≥ 1% of price), the offer needs to be $114k (11.9% below list).
- Recommended offer: $114k (11.9% below list) — sets the bar for 1% rule.
Location & tenants
- Location reads 65/100 on livability (#716 in OH) — a middle-class / working-renter tenant base. Strengths: cost of living A+, housing A+, health & safety A; Watch: schools C-, amenities C-, crime F.
- Dayton City (urban): math 12% / reading 21% proficiency, ranked #641 of 656 in OH (top 98%) — low school quality limits family demand, transient renter base, plan for 1-2y turnover; 74% free/reduced lunch — lower-income household profile, screen leases tightly.
- Market conditions: Rents rising fast (+4.1%/yr); 135 active listings in the ZIP; 33 comparable units currently listed for rent nearby; rentals at typical pace (median 24d on market — plan ~3-4 weeks tenant-placement turnaround); lower-income renter base — watch delinquency; 907 units permitted in Montgomery County in 2024 (416 in 5+ unit buildings).
- This rent runs 37% of the median local income ($37k/yr) — at the standard rent-burdened threshold; future hikes will face affordability resistance.
Forward outlook
- Local home prices are declining (-3.0%/yr); year-one equity from $897 of loan paydown is wiped out by about $4k of value loss. Plan a longer hold.
- Montgomery County population projected at -10% by 2050 — secular population decline; favor cash flow + early exit over multi-decade hold.
Negotiation context
- It's been on market 49 days — a 3% lower offer ($126k) is reasonable based on typical stale-listing flexibility.
- Current owner paid $37k; list at $130k implies a 251% gain — meaningful room to come down on a strong offer.
Risks & watch-outs
- Watch-outs: flood insurance adds $66/mo; built in 1959 — expect roof / HVAC / electrical / plumbing capex.
- Climate carrying-cost: severe flood risk — expect insurance premiums to compound above CPI over the hold.
Questions for the listing agent
- It's been on market 49 days. Have you received any prior offers? Is the seller open to a 12% concession, seller financing, or rate buy-down credit?
- Built in 1959 — when were the roof, HVAC, electrical panel, plumbing, and water heater last replaced?
- What's the actual annual flood-insurance premium (NFIP or private), and is the property in a SFHA with mandatory coverage?
- Is there a deadline driving the sale (1031 exchange, divorce, estate, relocation)? That informs how much negotiation room exists.
- Crime grade is F in this area — have there been break-ins, vandalism, or insurance claims at this property in the last 3 years? What carrier currently insures it and at what premium?
- The area grade is low — what's the realistic commute time and amenity access for the typical tenant pool here? Any planned neighborhood developments (good or bad) we should know about?
- What's the average days-on-market for RENTAL listings here right now (not sales)? A rising rental-DOM trend means longer vacancies and softer asking-rent achievability than the comps imply.
- What's the recent tenant-quality profile in this submarket — average credit score on applications, eviction rate, late-payment / NSF rate, and stable-employment percentage? A property-management company in the area should have these aggregated.
- How much new for-sale + rental construction is in the pipeline within 1–3 miles? Heavy new supply typically softens prices + rents 12–24 months out; constrained supply supports both.
Investment metrics
- 1% rule
- 0.88% ✗
- Cap rate
- 7.15%
- Cash-on-cash
- 3.05%
- DSCR
- 1.14
- GRM
- 9.5
CMA / ARV
- ARV (on-the-fly)
- $111,592
- Comps found
- 12
Show comp detail 12 sales within ~0.75 mi
| Address | Dist | Beds/Ba | Sqft | Sold | Price | $/sf | Match |
|---|---|---|---|---|---|---|---|
| 4482 Gaiter Ln | 0.00mi | 3/1.0 | 962 (0%) | 1mo | $125,000 | $130 | 99 |
| 1310 Honeybee Dr | 0.41mi | 3/1.0 | 960 (-0%) | 11mo | $73,000 | $76 | 72 |
| 4594 Guadalupe Ave | 0.16mi | 3/1.0 | 864 (-10%) | 5mo | $100,000 | $116 | 71 |
| 4599 Live Oak Dr | 0.18mi | 3/1.0 | 864 (-10%) | 11mo | $80,000 | $93 | 66 |
| 4600 Gardendale Ave | 0.26mi | 3/1.0 | 864 (-10%) | 7mo | $82,000 | $95 | 65 |
| 4660 Gardendale Ave | 0.34mi | 3/1.0 | 864 (-10%) | 5mo | $80,000 | $93 | 63 |
| 4901 Gardendale Ave | 0.67mi | 4/1.0 (+1) | 960 (-0%) | 3mo | $99,000 | $103 | 61 |
| 4930 Porterfield Dr | 0.53mi | 3/1.0 | 864 (-10%) | 8mo | $130,000 | $150 | 52 |
| 3819 Dandridge Ave | 0.65mi | 3/1.0 | 1,061 (+10%) | 2mo | $45,000 | $42 | 51 |
| 4890 Gardendale Ave | 0.52mi | 3/1.0 | 864 (-10%) | 9mo | $115,000 | $133 | 51 |
| 1302 Stuben Dr | 0.71mi | 2/1.0 (-1) | 864 (-10%) | 0mo | $124,000 | $144 | 45 |
| 4722 Hollister Ave | 0.64mi | 3/1.0 | 1,096 (+14%) | 9mo | $206,000 | $188 | 39 |
Match score weights: distance 35% · size 25% · config 20% · recency 20%. Top-matched comps best support the ARV.
Projected returns pro-forma
-3.0% appreciation · 4.06% rent growth · sell at horizon
- IRR
- -13.8%
- Equity multiple
- 0.50×
- Total profit
- $-18,147
- Equity at exit
- $19,354
- IRR
- -3.3%
- Equity multiple
- 0.77×
- Total profit
- $-8,490
- Equity at exit
- $11,223
Cash invested: $36,344 (down + closing). Projections, not guarantees.
Landlord ↔ Tenant lean methodology
- Overall (STATE)
- 73 Landlord-Friendly
- State Ohio
- 73 Landlord-Friendly · R+6
- County
- — inherits STATE
- City
- — inherits STATE
ZIP-level market 45417
- Home prices YoY
- -32.3%
- Rents YoY
- 4.1%
- Active inventory
- 135
- Price-to-rent
- 9.5×
Monthly cashflow live
- Estimated rent
- $1,143 high interval (Pro) →
- Mortgage (P&I)
- −$681
- Tax from tax record
- −$76 /mo · $915/yr
- Insurance
- −$54
- Flood insurance flood zone
- −$66 /mo · $798/yr
- HOA
- −$0
- Vacancy / Maint / Mgmt
- −$240
- Net cashflow
- $26
Break-even live
UW: 25.0% down · 7.5% · 30yr · 1.5% tax · 5.0% vac · 8.0% maint · 8.0% mgmt
Financing live
Cash to close
- Down payment
- $32,450
- Closing costs
- $3,894
- Reserves months
- —
- Total cash needed
- —
Loan-product check · same deal, 3 products live
Conventional
25% down · 7.5% · 30yr
- Down + closing
- —
- Monthly P&I
- —
- Monthly cashflow
- —
- DSCR
- —
- Eligible?
- —
Personal DTI + credit; lowest rate.
DSCR
20% down · 8.5% · 30yr
- Down + closing
- —
- Monthly P&I
- —
- Monthly cashflow
- —
- DSCR
- —
- Eligible?
- —
No personal income docs; deal must DSCR.
Hard money
10% down · 12.0% · 12mo
- Down + closing
- —
- Monthly P&I
- —
- Monthly cashflow
- —
- DSCR
- —
- Eligible?
- —
Short-term bridge; refi at stabilization.
Rent comps 33 comps
| Address | Beds | Baths | Sqft | Rent | $/sqft | DOM | Units | Dist |
|---|---|---|---|---|---|---|---|---|
| 4576 Live Oak Dr Dayton, OH | 3.0 | 1.0 | 864 | $1,400 | $1.62 | 43d | 1 | 0.12mi |
| 4625 Gardendale Ave Dayton, OH | 3.0 | 1.0 | 864 | $1,150 | $1.33 | 2d | 1 | 0.28mi |
| 1498 Elaine St Dayton, OH | 3.0 | 1.0 | 864 | $1,025 | $1.19 | 2d | 1 | 0.46mi |
| 1595 Elaine St Dayton, OH | 3.0 | 1.0 | 864 | $950 | $1.10 | 2d | 1 | 0.47mi |
| 4914 Gardendale Ave Dayton, OH | 4.0 | 1.0 | 960 | $1,125 | $1.17 | 43d | 1 | 0.53mi |
| 1427 Stuben Dr Dayton, OH | 3.0 | 1.0 | 957 | $900 | $0.94 | 2d | 1 | 0.70mi |
| 3925 Hoover Ave Dayton, OH | 2.0 | 1.0 | 936 | $1,100 | $1.18 | 2d | 1 | 0.81mi |
| 863 N Upland Ave Dayton, OH | 3.0 | 1.0 | 1042 | $1,200 | $1.15 | 43d | 1 | 0.91mi |
| 729 Cleverly Rd Dayton, OH | 2.0 | 1.0 | 626 | $950 | $1.52 | 43d | 1 | 0.92mi |
| 1816 N James H McGee Blvd Apt B Dayton, OH | 3.0 | 1.0 | 950 | $1,150 | $1.21 | 43d | 1 | 0.95mi |
| 1816 N James H McGee Blvd Apt A Dayton, OH | 3.0 | 1.0 | 950 | $1,200 | $1.26 | 2d | 1 | 0.95mi |
| 1816 N James H McGee Blvd Unit C Dayton, OH | 3.0 | 1.0 | 950 | $1,150 | $1.21 | 2d | 1 | 0.95mi |
| 4629 Queens Ave Dayton, OH | 2.0 | 1.0 | 900 | $1,100 | $1.22 | 43d | 1 | 0.99mi |
| 1732 Harold Dr Dayton, OH | 2.0 | 1.0 | 805 | $925 | $1.15 | 43d | 1 | 0.99mi |
| 3552 Stanford Pl Unit 3552 Dayton, OH | 2.0 | 1.0 | 800 | $800 | $1.00 | 43d | 1 | 1.01mi |
| 3552 Stanford Pl Dayton, OH | 2.0 | 1.0 | 800 | $800 | $1.00 | 23d | 1 | 1.01mi |
| 3652 Otterbein Ave Unit 3652 Dayton, OH | 2.0 | 1.0 | 700 | $800 | $1.14 | 2d | 1 | 1.04mi |
| 3650 Otterbein Ave Unit 3650 Dayton, OH | 2.0 | 1.0 | 900 | $800 | $0.89 | 2d | 1 | 1.04mi |
| 920 Huron Ave Dayton, OH | 2.0 | 1.0 | 950 | $995 | $1.05 | 3d | 1 | 1.07mi |
| 828 Walton Ave Unit 832 Walton Dayton, OH | 2.0 | 1.0 | 750 | $795 | $1.06 | 23d | 1 | 1.08mi |
| 3222 Athens Ave Unit C Dayton, OH | 2.0 | 1.0 | 700 | $700 | $1.00 | 43d | 1 | 1.11mi |
| 3220 Princeton Dr Dayton, OH | 3.0 | 1.0 | 900 | $1,000 | $1.11 | 43d | 1 | 1.12mi |
| 2014 Hickorydale Dr Unit 2016 Dayton, OH | 2.0 | 1.0 | 800 | $900 | $1.12 | 43d | 1 | 1.13mi |
| 2002 Val Vista Ct Dayton, OH | 3.0 | 1.0 | 975 | $1,095 | $1.12 | 21d | 1 | 1.18mi |
| 3537 Otterbein Ave Unit d Dayton, OH | 2.0 | 1.0 | 900 | $925 | $1.03 | 43d | 1 | 1.19mi |
| 5336 Rockport Ave Dayton, OH | 3.0 | 1.0 | 925 | $1,025 | $1.11 | 43d | 1 | 1.20mi |
| 1720 Kings Mill Ct Dayton, OH | 2.0 | 1.5 | 975 | $925 | $0.95 | 23d | 1 | 1.21mi |
| 4446 Waymire Ave Dayton, OH | 3.0 | 1.0 | 1100 | $1,100 | $1.00 | 21d | 1 | 1.22mi |
| 4109 Midway Ave Dayton, OH | 3.0 | 1.0 | 971 | $1,000 | $1.03 | 3d | 1 | 1.26mi |
| 3311 Otterbein Ave Dayton, OH | 3.0 | 1.5 | 1004 | $1,300 | $1.29 | 11d | 1 | 1.32mi |
| 3007 Cornell Dr Dayton, OH | 2.0 | 1.0 | 827 | $1,000 | $1.21 | 3d | 1 | 1.33mi |
| 635 Anna St Dayton, OH | 3.0 | 1.0 | 960 | $1,300 | $1.35 | 14d | 1 | 1.39mi |
| 5112 W Hillcrest Ave Unit 1 Dayton, OH | 3.0 | 1.0 | 972 | $700 | $0.72 | 23d | 1 | 1.42mi |
Listing history 8 events
-
2026-04-18status Pending
-
2026-04-12price $129,800
-
2026-04-08price $129,900
-
2026-03-26price $132,900
-
2026-03-16price $133,900
-
2026-03-07price $134,900
-
2026-02-27$139,900 Active
-
1997-05-02soldstatus $37,000
ⓘ Source: listings_history table (triggers on properties + properties_extension) + one-shot
backfill from property_details.listing_events for pre-trigger history.
Tax reassessment forecast OH · Partial reset (capped growth)
- Current annual tax
- $915 · $76/mo
- Projected year-2 tax
- $1,470 · $122/mo
- Expected delta
- +$555/yr (+$46/mo · 60.7%)
ⓘ Screening estimate from a state-policy table — verify with the county assessor before closing.
Climate risk First Street
- Flood 8/10 Severe FEMA zone X (unshaded) · 99% chance over 30 yrs
- Wildfire 1/10 Low
- Heat 3/10 Moderate 7 d/yr ≥104°F today · 19 d/yr by 30 yrs out
- Wind 2/10 Low 100% chance of damaging wind over 30 yrs
- Air quality 3/10 Moderate 3 unhealthy d/yr today · 4 by 30 yrs out
Nearby sold comps map
Loading sold comps map…
Walkable amenities ~0.75 mi
Loading nearby amenities…
Taxation est. · year 1
- Rental income
- $13,722
- − Mortgage interest
- −$7,271
- − Property taxes
- −$915
- − Insurance
- −$1,446
- − Repairs & maintenance
- −$1,098
- − Management
- −$1,098
- − Depreciation
- −$3,776
- Taxable loss
- −$1,882
- Est. tax savings @ 24.0%
- +$452
- After-tax cash flow
- $762/yr
For passive investors: Depreciation is non-cash, so a rental often shows a tax loss while cash-flowing — sheltering income. Rental losses are passive: they offset passive income freely, and up to $25,000/yr can offset ordinary (W-2) income if you actively participate and your MAGI is under $100k (phasing out to $0 by $150k); unused losses carry forward. On sale, claimed depreciation is recaptured at up to 25%, and gains may owe capital-gains tax (a 1031 exchange can defer both). Figures are a year-1 estimate at your 24.0% rate — not tax advice; consult a CPA.
Schools (NCES district)
- District
- Dayton City
- NCES district ID
- 3904384
- Math proficiency
- 12% ▼ -12.00%
- Reading proficiency
- 21% ▼ -11.00%
- Median HH income
- $28,688
- Composite
- 12.94/100
- National rank
- #9579
- State rank
- #641 of 656 in OH
Livability — Dayton
- Score
- 65/100
- State rank
- #716
- US rank
- #12895
Category grades
Schools grade is shown separately in the Schools card above.
Census & demographics
- Census place
- Dayton, OH
- County
- Montgomery County · 459,541 people
- City population
- 164,387
- Metro
- Dayton-Kettering, OH
- Population (ZIP)
- 28,186
- Household income
- $36,945
- Rent vs Own
- Severe rent burden
- 1822.0
Population outlook (Montgomery County) Hauer SSP2
- Today (2025)
- 523,241 people
- By 2030
- 514,948 · -1.6%
- By 2040
- 493,378 · -5.7%
- By 2050
- 469,639 · -10.2%
- By 2075
- 418,360 · -20.0%
- By 2100
- 353,315 · -32.5%
Race, ethnicity, and origin ACS 2023
- Neighborhood character
- Predominantly Black (71%)
- Race & ethnicity
- Black 71% White 20% Two or more races 8% Hispanic / Latino 3%
- Common ancestry
- Romanian 0%
- Foreign-born
- 3% · Canada
- Languages at home
- 96% English-only · Spanish 2% French/Haitian/Cajun 1%
Political lean MEDSL · Montgomery
- 2024 margin
- Toss-up / Even · D 49.8% · R 49.3%
- 2008→2024 swing
- -5.8pp toward R · 2008: 6.2pp · 2024: 0.5pp
- All cycles
- 2024: D+0.5 2020: D+2.2 2016: R+1.2 2012: D+3.1 2008: D+6.2
Not yet ingested
- Civics
- —
Market trends
- HPI YoY
- ▼ -92.43%
- Current HPI
- 193.4175
- Rent YoY
- ▲ 4.06%
- Metro
- Dayton-Kettering, OH
- State GDP YoY
- ▲ 1.98%
- F500 in state
- 48
Industry mix (Fortune 500 HQ in OH)
| Industry | F500 HQs | Revenue |
|---|---|---|
| Insurance | 3 | $145B |
|
||
| Industrial Machinery | 3 | $49B |
|
||
| Financial Services | 3 | $24B |
|
||
| Consumer Goods | 2 | $93B |
|
||
| Aerospace / Defense | 2 | $47B |
|
||
| Utilities | 2 | $33B |
|
||
Price history
+250.8% since first listed8 events — show timeline
- 2026-04-18 Pending — Dayton MLS
- 2026-04-12 Price Changed $129,800 Dayton MLS
- 2026-04-08 Price Changed $129,900 Dayton MLS
- 2026-03-26 Price Changed $132,900 Dayton MLS
- 2026-03-16 Price Changed $133,900 Dayton MLS
- 2026-03-07 Price Changed $134,900 Dayton MLS
- 2026-02-27 Listed $139,900 Dayton MLS
- 1997-05-02 Sold (Public Records) $37,000 Public Records
Property tax history
+0.4%/yrLatest (2025): $915 · +2.4% YoY. Source: county tax records.
Cash-flow waterfall
monthlySold comps — $/sqft
last 12 mo · ≤1 miLoading sold comps…