1108 Beaumont Ln · Red Oak, TX
Flood risk No data
- FEMA flood zone
- —
- Chance of flooding over 30 yrs
- —
- Est. flood insurance / yr
- —
Fire risk No data
- Est. fire insurance / yr
- —
Heat risk No data
- Hot days now (above threshold)
- —
- Hot days in 30 yrs
- —
Wind risk No data
- Chance of severe wind over 30 yrs
- —
Air-quality risk No data
- Unhealthy air days now
- —
- Unhealthy air days in 30 yrs
- —
Risk factors via First Street. Map © Google.
Why this score? — see what drove the F grade
The composite is a weighted blend of 9 inputs, each scored 0–100. Each bar is that input's sub-score; the figure is the points it added to the 100-point composite (weight × sub-score).
- Cash flow +12.2/30.0
- DSCR +3.6/10.0
- Schools +3.5/10.0
- Livability +3.5/5.0
- Rent growth +3.2/5.0
- ARV discount +3.1/15.0
- Condition / age +2.5/5.0
- 1% rule +2.4/10.0
- Appreciation +0.0/10.0
$429,990
🖨 Deal sheet 📄 Offer letter ✓ Due diligence
Listing remarks MLS
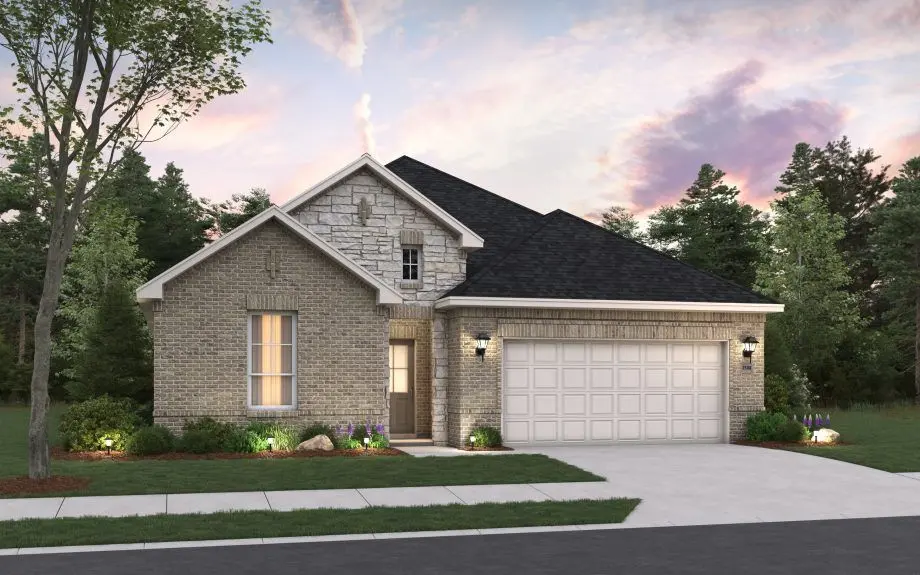
The Rowan is a charming single-story home that blends modern design with functional living spaces. Featuring 3 spacious bedrooms and 2.5 bathrooms, it offers an ideal layout for both relaxation and entertaining. The heart of the home is the expansive kitchen, which opens up to a bright and inviting living area, perfect for family gatherings. A versatile game room provides extra space for fun and leisure, while the covered patio extends your living space outdoors. The front porch adds a welcoming touch to the home and with the option for a 3rd-car garage, there's plenty of room for vehicles or storage. The Rowan is the perfect combination of comfort, style, and versatility.
Key facts
- 5,881 sq ft lot
- 2 garage spots
- Community pool
Property features AI
Finance
- Other: Community pool; Park
- Financial info: Second mortgage: none; Loan type: Treat As Clear
- HOA & community: Mandatory HOA; Semi-annual HOA fee; HOA covers maintenance of grounds and structure and management fees; HOA management: CMA Management
Exterior
- Parking: Attached 2-car garage with garage door opener; 2 covered parking spaces
- Security: Smoke detector(s); Carbon monoxide detector(s)
- Utilities: City water; City sewer; No municipal utility district
- Home design: Single family residence; New construction (incomplete); One-story
- Construction: Brick construction; Composition roof; Slab foundation; Year built: 2025
- Exterior features: Private yard; Wood fencing; Lot less than 0.5 acre
Interior
- Kitchen: Dishwasher; Disposal; Microwave
- Bedrooms: 4 bedrooms (all on the main level); Primary bedroom on the main level
- Flooring: Carpet; Ceramic tile; Luxury vinyl plank
- Bathrooms: 3 full bathrooms
- Heating & cooling: Central heating (natural gas); Central air conditioning (electric)
- Interior features: Cable TV available; Decorative lighting; High speed internet available; Walk-in closets; One living area; One dining area; Seven total rooms; Levels: One
- Laundry & utility: Full-size washer/dryer area; Washer hookup; Electric dryer hookup; Utility room on the main level
Neighborhood map
What this means for you Summary
Snapshot
- This is a 4-bed/3.0-bath land listed at $430k.
Deal economics
- At list price, monthly cash flow is $-89 ($-1k/yr) — negative.
- To cash-flow at today's rent, offer at most $414k (3.7% below list).
- To meet the 1% rule (rent ≥ 1% of price), the offer needs to be $320k (25.7% below list).
- Recommended offer: $320k (25.7% below list) — sets the bar for 1% rule.
- Cap rate 6.0% vs local median 3.9% in Red Oak — top-decile yield for the area; either an underpriced asset or a hidden risk that comps aren't pricing in. Stress-test before assuming the spread holds.
Location & tenants
- Location reads 69/100 on livability (#435 in TX) — a middle-class / working-renter tenant base. Strengths: employment A+, housing A+, cost of living A; Watch: amenities F, commute F.
- Red Oak ISD (suburban): math 40% / reading 36% proficiency, ranked #384 of 826 in TX (top 46%) — families likely to look elsewhere, expect single-tenant / working-renter base with shorter leases.
- Zoned schools: Shields El (math 34% / reading 36%, grade F, #1,965 of 4,322 statewide, top 46%, 563 students, 60% FRL) — zoned schools average 60% FRL vs 42% district-wide (18 pts higher); higher-poverty schools than district average — tighter screening recommended.
- Market conditions: Rents rising (+3.0%/yr); 565 active listings in the ZIP; 4 comparable units currently listed for rent nearby; rentals lingering (median 44d on market — plan ~5-8 weeks vacancy on turnover, expect pricing pressure); 50% of comp listings sitting > 30 days — soft ceiling on asking rent; solid renter incomes; 3,016 units permitted in Ellis County in 2024 (20 in 5+ unit buildings).
- This rent runs 38% of the median local income ($100k/yr) — at the standard rent-burdened threshold; future hikes will face affordability resistance.
Forward outlook
- Local home prices are declining (-3.0%/yr); year-one equity from $3k of loan paydown is wiped out by about $13k of value loss. Plan a longer hold.
- Ellis County population projected at +36% by 2050 — long-run rental-demand tailwind backs the buy-and-hold thesis.
Negotiation context
- It's been on market 18 days — a 2% lower offer ($424k) is reasonable based on typical stale-listing flexibility.
- 2 sale attempts with the ask held roughly flat each time — persistent listings suggest the price (not the market) is what's stuck; bring a comps-based counter.
Questions for the listing agent
- What do current leases actually rent for vs. the listed asking? Can we see a recent rent roll and the last 12 months of T-12 income?
- What does the HOA fee cover, when was the last increase, and are there any pending special assessments or reserve-fund shortfalls?
- Is there a deadline driving the sale (1031 exchange, divorce, estate, relocation)? That informs how much negotiation room exists.
- Schools are D-rated, which usually means shorter tenancies and higher turnover. Who's the typical renter profile here, and what's been the actual vacancy rate?
- The area grade is low — what's the realistic commute time and amenity access for the typical tenant pool here? Any planned neighborhood developments (good or bad) we should know about?
- What's the average days-on-market for RENTAL listings here right now (not sales)? A rising rental-DOM trend means longer vacancies and softer asking-rent achievability than the comps imply.
- What's the recent tenant-quality profile in this submarket — average credit score on applications, eviction rate, late-payment / NSF rate, and stable-employment percentage? A property-management company in the area should have these aggregated.
- How much new for-sale + rental construction is in the pipeline within 1–3 miles? Heavy new supply typically softens prices + rents 12–24 months out; constrained supply supports both.
Investment metrics
- 1% rule
- 0.74% ✗
- Cap rate
- 6.04%
- Cash-on-cash
- -0.89%
- DSCR
- 0.96
- GRM
- 11.2
CMA / ARV
- ARV (median comp)
- $391,774
- List price
- $429,990
- Delta
- 9.75%
- Verdict
- FAIR
- Comps
- 20 within 1.0 mi
Projected returns pro-forma
-3.0% appreciation · 2.99% rent growth · sell at horizon
- IRR
- -17.8%
- Equity multiple
- 0.37×
- Total profit
- $-75,572
- Equity at exit
- $64,113
- IRR
- -10.1%
- Equity multiple
- 0.39×
- Total profit
- $-73,963
- Equity at exit
- $37,178
Cash invested: $120,397 (down + closing). Projections, not guarantees.
Landlord ↔ Tenant lean methodology
- Overall (STATE)
- 87 Strongly Landlord-Friendly
- State Texas
- 87 Strongly Landlord-Friendly · R+5
- County
- — inherits STATE
- City
- — inherits STATE
ZIP-level market 75154
- Home prices YoY
- -18.5%
- Rents YoY
- 3.0%
- Active inventory
- 565
- Price-to-rent
- 11.2×
Monthly cashflow live
- Estimated rent
- $3,196 medium interval (Pro) →
- Mortgage (P&I)
- −$2,255
- Tax from tax record
- −$98 /mo · $1,173/yr
- Insurance
- −$179
- HOA
- −$82
- Vacancy / Maint / Mgmt
- −$671
- Net cashflow
- $-89
Break-even live
UW: 25.0% down · 7.5% · 30yr · 1.5% tax · 5.0% vac · 8.0% maint · 8.0% mgmt
Financing live
Cash to close
- Down payment
- $107,498
- Closing costs
- $12,900
- Reserves months
- —
- Total cash needed
- —
Loan-product check · same deal, 3 products live
Conventional
25% down · 7.5% · 30yr
- Down + closing
- —
- Monthly P&I
- —
- Monthly cashflow
- —
- DSCR
- —
- Eligible?
- —
Personal DTI + credit; lowest rate.
DSCR
20% down · 8.5% · 30yr
- Down + closing
- —
- Monthly P&I
- —
- Monthly cashflow
- —
- DSCR
- —
- Eligible?
- —
No personal income docs; deal must DSCR.
Hard money
10% down · 12.0% · 12mo
- Down + closing
- —
- Monthly P&I
- —
- Monthly cashflow
- —
- DSCR
- —
- Eligible?
- —
Short-term bridge; refi at stabilization.
Rent comps 4 comps
| Address | Beds | Baths | Sqft | Rent | $/sqft | DOM | Units | Dist |
|---|---|---|---|---|---|---|---|---|
| 1227 Stockton Trl Red Oak, TX | 4.0 | 3.0 | 2752 | $3,400 | $1.24 | 43d | 1 | 0.17mi |
| 124 Clear Creek Dr Red Oak, TX | 5.0 | 3.5 | 2964 | $2,845 | $0.96 | 24d | 1 | 1.01mi |
| 168 Creekview Dr E Red Oak, TX | 3.0 | 2.0 | 1845 | $2,095 | $1.14 | 43d | 1 | 1.30mi |
| 111 Creekview Dr W Unit 1056457P Red Oak, TX | 5.0 | 2.0 | 2389 | $12,368 | $5.18 | 21d | 1 | 1.31mi |
HOA detail
- Monthly dues
- $82 · $984/yr
Listing history 15 events
-
2026-06-18days on market $429,990 Active 18 DOM
-
2026-06-17days on market $429,990 Active 17 DOM
-
2026-06-16days on market $429,990 Active 16 DOM
-
2026-06-15days on market $429,990 Active 15 DOM
-
2026-06-13days on market $429,990 Active 13 DOM
-
2026-06-13days on market $429,990 Active 12 DOM
-
2026-06-09days on market $429,990 Active 9 DOM
-
2026-06-08days on market $429,990 Active 8 DOM
-
2026-06-07days on market $429,990 Active 7 DOM
-
2026-06-04days on market $429,990 Active 21 DOM
-
2026-06-03days on market $429,990 Active 20 DOM
-
2026-06-02days on market $429,990 Active 19 DOM
-
2026-06-01days on market $429,990 Active 18 DOM
-
2026-05-31days on market $429,990 Active 17 DOM
-
2026-05-14$429,990 Active 681-char remark
Show marketing remark (681 chars)
The Rowan is a charming single-story home that blends modern design with functional living spaces. Featuring 3 spacious bedrooms and 2.5 bathrooms, it offers an ideal layout for both relaxation and entertaining. The heart of the home is the expansive kitchen, which opens up to a bright and inviting living area, perfect for family gatherings. A versatile game room provides extra space for fun and leisure, while the covered patio extends your living space outdoors. The front porch adds a welcoming touch to the home and with the option for a 3rd-car garage, there's plenty of room for vehicles or storage. The Rowan is the perfect combination of comfort, style, and versatility.
ⓘ Source: listings_history table (triggers on properties + properties_extension) + one-shot
backfill from property_details.listing_events for pre-trigger history.
Tax reassessment forecast TX · Resets to sale price
- Current annual tax
- $1,173 · $98/mo
- Projected year-2 tax
- $7,869 · $656/mo
- Expected delta
- +$6,696/yr (+$558/mo · 570.9%)
ⓘ Screening estimate from a state-policy table — verify with the county assessor before closing.
Nearby sold comps map
Loading sold comps map…
Walkable amenities ~0.75 mi
Loading nearby amenities…
Taxation est. · year 1
- Rental income
- $38,346
- − Mortgage interest
- −$24,086
- − Property taxes
- −$1,173
- − Insurance
- −$2,150
- − Repairs & maintenance
- −$3,068
- − Management
- −$3,068
- − HOA
- −$984
- − Depreciation
- −$12,509
- Taxable loss
- −$8,691
- Est. tax savings @ 24.0%
- +$2,086
- After-tax cash flow
- $1,014/yr
For passive investors: Depreciation is non-cash, so a rental often shows a tax loss while cash-flowing — sheltering income. Rental losses are passive: they offset passive income freely, and up to $25,000/yr can offset ordinary (W-2) income if you actively participate and your MAGI is under $100k (phasing out to $0 by $150k); unused losses carry forward. On sale, claimed depreciation is recaptured at up to 25%, and gains may owe capital-gains tax (a 1031 exchange can defer both). Figures are a year-1 estimate at your 24.0% rate — not tax advice; consult a CPA.
Schools (NCES district)
- District
- Red Oak ISD
- NCES district ID
- 4836660
- Math proficiency
- 40% ▼ -12.00%
- Reading proficiency
- 36% ▼ -9.00%
- Median HH income
- $71,110
- Composite
- 34.88/100
- National rank
- #5084
- State rank
- #384 of 826 in TX
Livability — Red Oak
- Score
- 69/100
- State rank
- #435
- US rank
- #8931
Category grades
Schools grade is shown separately in the Schools card above.
Census & demographics
- Census place
- Red Oak, TX
- County
- Ellis County · 199,237 people
- City population
- 52,516
- Metro
- Dallas-Fort Worth-Arlington, TX
- Population (ZIP)
- 52,516
- Household income
- $100,388
- Rent vs Own
- Severe rent burden
- 1081.0
Population outlook (Ellis County) Hauer SSP2
- Today (2025)
- 194,556 people
- By 2030
- 209,679 · +7.8%
- By 2040
- 238,837 · +22.8%
- By 2050
- 265,451 · +36.4%
- By 2075
- 326,571 · +67.9%
- By 2100
- 362,156 · +86.1%
Race, ethnicity, and origin ACS 2023
- Neighborhood character
- Diverse neighborhood (Simpson 0.69)
- Race & ethnicity
- White 39% Black 30% Hispanic / Latino 27% Two or more races 12% Asian 1% Native American 1%
- Hispanic origin (detail)
- Mexican 25%
- Common ancestry
- Italian 2% Slovak 1%
- Foreign-born
- 9% · Canada, Jamaica
- Languages at home
- 80% English-only · Spanish 18%
Political lean MEDSL · Ellis
- 2024 margin
- Solid R (+31.1) · D 34.0% · R 65.1%
- 2008→2024 swing
- +11.2pp toward D · 2008: -42.2pp · 2024: -31.1pp
- All cycles
- 2024: R+31.1 2020: R+34.1 2016: R+45.4 2012: R+47.5 2008: R+42.2
Not yet ingested
- Civics
- —
Market trends
- HPI YoY
- ▼ -67.06%
- Current HPI
- 294.5836
- Rent YoY
- ▲ 2.99%
- Metro
- Dallas-Fort Worth-Arlington, TX
- State GDP YoY
- ▲ 3.95%
- F500 in state
- 110
Industry mix (Fortune 500 HQ in TX)
| Industry | F500 HQs | Revenue |
|---|---|---|
| Energy | 16 | $1,198B |
|
||
| Technology | 5 | $198B |
|
||
| Engineering / Construction | 4 | $72B |
|
||
| Energy Services | 3 | $60B |
|
||
| Utilities | 3 | $41B |
|
||
| Healthcare | 2 | $330B |
|
||
Price history
+0.0% since first listed2 events — show timeline
- 2026-05-31 Listed $429,990 NTREIS
- 2026-05-14 Listed $429,990 Zillow
Property tax history
-1.9%/yrLatest (2025): $1,173 · -1.9% YoY. Source: county tax records.
Cash-flow waterfall
monthlySold comps — $/sqft
last 12 mo · ≤1 miLoading sold comps…