 🏗️ New Construction
7802 N 169 St · Omaha, NE
Flood risk No data
- FEMA flood zone
- —
- Chance of flooding over 30 yrs
- —
- Est. flood insurance / yr
- —
Fire risk No data
- Est. fire insurance / yr
- —
Heat risk No data
- Hot days now (above threshold)
- —
- Hot days in 30 yrs
- —
Wind risk No data
- Chance of severe wind over 30 yrs
- —
Air-quality risk No data
- Unhealthy air days now
- —
- Unhealthy air days in 30 yrs
- —
Risk factors via First Street. Map © Google.
Why this score? — see what drove the D grade
The composite is a weighted blend of 9 inputs, each scored 0–100. Each bar is that input's sub-score; the figure is the points it added to the 100-point composite (weight × sub-score).
- Cash flow +10.6/30.0
- ARV discount +7.5/15.0
- Schools +6.1/10.0
- Livability +4.2/5.0
- Rent growth +4.0/5.0
- 1% rule +3.4/10.0
- DSCR +3.1/10.0
- Condition / age +2.5/5.0
- Appreciation +0.0/10.0
$318,990
🖨 Deal sheet (PDF) 📄 Offer letter ✓ Due diligence
Listing remarks
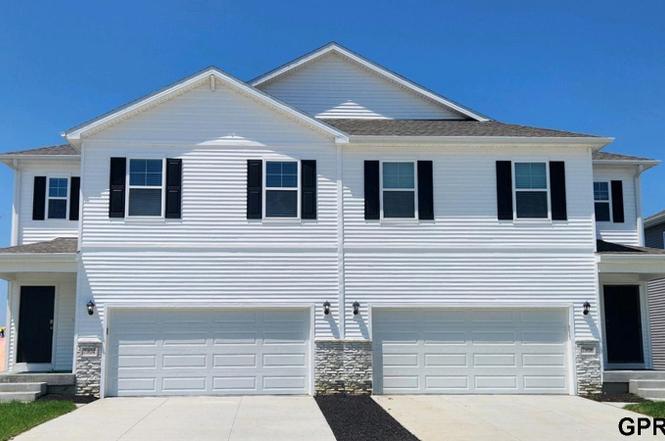
D. R. Horton, America's Builder, presents the Emerson. This two-story twinhome features 4 Bedrooms and 2.5 Bathrooms in an open-concept layout. - Internet included in HOA! - As you make your way through the Foyer, you’ll find a spacious and cozy Great Room complete with an electric fireplace. The Gourmet Kitchen with included Quartz countertops is perfect for entertaining with its Oversized Island overlooking the Dining and living areas. Heading up to the second level, you’ll find the oversized Primary Bedroom featuring an ensuite bathroom and large Walk-In Closet. The additional 3 Bedrooms, second dual-vanity Bathroom, and large Laundry Room round out the rest of the upper leve
Key facts
- Walk-in closet
- Gourmet kitchen
- Electric fireplace
Tags
Neighborhood map
What this means for you Summary
Snapshot
- This is a 4-bed/2.5-bath other listed at $319k.
Deal economics
- At list price, monthly cash flow is $-156 ($-2k/yr) — negative.
- To cash-flow at today's rent, offer at most $296k (7.1% below list).
- To meet the 1% rule (rent ≥ 1% of price), the offer needs to be $266k (16.5% below list).
- Recommended offer: $266k (16.5% below list) — sets the bar for 1% rule.
- Cap rate 5.7% vs local median 3.6% in Omaha — top-decile yield for the area; either an underpriced asset or a hidden risk that comps aren't pricing in. Stress-test before assuming the spread holds.
Location & tenants
- Location reads 84/100 on livability (#7 in NE, #663 nationally) — a professional / high-income tenant draw. Strengths: amenities A+, commute A+, cost of living A+; Watch: crime F.
- Bennington Public Schools (rural): math 67% / reading 67% proficiency, ranked #3 of 111 in NE (top 3%) — acceptable for families but not a draw, mixed tenant base, ~2y average lease; only 6% free/reduced lunch — higher-income household profile.
- Zoned schools: Bennington Elementary School (math 77% / reading 72%, grade A, #20 of 502 statewide, top 5%, 403 students, 17% FRL); Bennington South Middle School (510 students, 9% FRL); Bennington High School (math 66% / reading 70%, grade B, #21 of 261 statewide, top 8%, 1,002 students, 14% FRL).
- Market conditions: Rents rising fast (+5.9%/yr); 464 active listings in the ZIP; 7 comparable units currently listed for rent nearby; rentals leasing fast (median 4d on market — plan ~1-2 weeks tenant-placement turnaround); high-income renter base; 4,539 units permitted in Douglas County in 2024 (2,583 in 5+ unit buildings).
Forward outlook
- Local home prices are declining (-3.0%/yr); year-one equity from $2k of loan paydown is wiped out by about $10k of value loss. Plan a longer hold.
- Douglas County population projected at +28% by 2050 — long-run rental-demand tailwind backs the buy-and-hold thesis.
Negotiation context
- It's been on market 27 days — a 2% lower offer ($314k) is reasonable based on typical stale-listing flexibility.
Questions for the listing agent
- What do current leases actually rent for vs. the listed asking? Can we see a recent rent roll and the last 12 months of T-12 income?
- What does the HOA fee cover, when was the last increase, and are there any pending special assessments or reserve-fund shortfalls?
- Is there a deadline driving the sale (1031 exchange, divorce, estate, relocation)? That informs how much negotiation room exists.
- Crime grade is F in this area — have there been break-ins, vandalism, or insurance claims at this property in the last 3 years? What carrier currently insures it and at what premium?
- The area grade is low — what's the realistic commute time and amenity access for the typical tenant pool here? Any planned neighborhood developments (good or bad) we should know about?
- What's the average days-on-market for RENTAL listings here right now (not sales)? A rising rental-DOM trend means longer vacancies and softer asking-rent achievability than the comps imply.
- What's the recent tenant-quality profile in this submarket — average credit score on applications, eviction rate, late-payment / NSF rate, and stable-employment percentage? A property-management company in the area should have these aggregated.
- How much new for-sale + rental construction is in the pipeline within 1–3 miles? Heavy new supply typically softens prices + rents 12–24 months out; constrained supply supports both.
Investment metrics
- 1% rule
- 0.84% ✗
- Cap rate
- 5.71%
- Cash-on-cash
- -2.10%
- DSCR
- 0.91
- GRM
- 10.0
CMA / ARV
No comps found within radius.
Projected returns pro-forma
-3.0% appreciation · 5.88% rent growth · sell at horizon
- IRR
- -16.5%
- Equity multiple
- 0.40×
- Total profit
- $-53,618
- Equity at exit
- $47,562
- IRR
- -3.7%
- Equity multiple
- 0.72×
- Total profit
- $-24,620
- Equity at exit
- $27,580
Cash invested: $89,317 (down + closing). Projections, not guarantees.
Landlord ↔ Tenant lean methodology
- Overall (STATE)
- 83 Strongly Landlord-Friendly
- State Nebraska
- 83 Strongly Landlord-Friendly · R+13
- County
- — inherits STATE
- City
- — inherits STATE
ZIP-level market 68007
- Home prices YoY
- -19.4%
- Rents YoY
- 5.9%
- Active inventory
- 464
- Price-to-rent
- 10.0×
Monthly cashflow live
- Estimated rent
- $2,664 high interval (Pro) →
- Mortgage (P&I)
- −$1,673
- Tax est. 1.5%
- −$399 /mo · $4,785/yr
- Insurance
- −$133
- HOA
- −$56
- Vacancy / Maint / Mgmt
- −$559
- Net cashflow
- $-156
Break-even live
Sensitivity live
| Price | -10% $64 | -5% $-46 | +0% $-156 | +5% $-266 | +10% $-377 |
|---|---|---|---|---|---|
| Rent | -10% $-367 | -5% $-261 | +0% $-156 | +5% $-51 | +10% $54 |
| Rate | -1.0pp $5 | -0.5pp $-75 | base $-156 | +0.5pp $-239 | +1.0pp $-323 |
UW: 25.0% down · 7.5% · 30yr · 1.5% tax · 5.0% vac · 8.0% maint · 8.0% mgmt
Financing live
Cash to close
- Down payment
- $79,748
- Closing costs
- $9,570
- Reserves months
- —
- Total cash needed
- —
Loan-product check · same deal, 3 products live
Conventional
25% down · 7.5% · 30yr
- Down + closing
- —
- Monthly P&I
- —
- Monthly cashflow
- —
- DSCR
- —
- Eligible?
- —
Personal DTI + credit; lowest rate.
DSCR
20% down · 8.5% · 30yr
- Down + closing
- —
- Monthly P&I
- —
- Monthly cashflow
- —
- DSCR
- —
- Eligible?
- —
No personal income docs; deal must DSCR.
Hard money
10% down · 12.0% · 12mo
- Down + closing
- —
- Monthly P&I
- —
- Monthly cashflow
- —
- DSCR
- —
- Eligible?
- —
Short-term bridge; refi at stabilization.
Rent comps 7 comps
| Address | Beds | Baths | Sqft | Rent | $/sqft | DOM | Units | Dist |
|---|---|---|---|---|---|---|---|---|
| 7308 N 167th Ave Bennington, NE | 4.0 | 3.0 | 2213 | $3,000 | $1.36 | 3d | 1 | 0.35mi |
| 16333 Potter St Bennington, NE | 3.0 | 2.0 | 1618 | $3,200 | $1.98 | 3d | 1 | 0.50mi |
| 17451 Tucker St Bennington, NE | 3.0 | 3.5 | 2442 | $3,100 | $1.27 | 25d | 1 | 0.66mi |
| 8903 N 167th St Bennington, NE | 3.0 | 2.5 | 1511 | $2,500 | $1.65 | 3d | 1 | 0.73mi |
| 6220 N 160th Ave Omaha, NE | 1.0–3.0 | 1.0–2.5 | 1137 | $2,690 | $2.36 | 3d | 13 | 1.31mi |
| 15304 Bondesson St Bennington, NE | 3.0 | 2.0 | 1256 | $2,000 | $1.59 | 23d | 1 | 1.33mi |
| 15303 Willit St Bennington, NE | 3.0 | 2.0 | 1345 | $2,200 | $1.64 | 45d | 1 | 1.35mi |
HOA detail
- Monthly dues
- $56 · $672/yr
- Likely covers
- electricinternet
Listing history 3 events
-
2025-12-31status Pending
-
2025-12-04$318,990 New
-
2024-12-11soldstatus $425,000
ⓘ Source: listings_history table (triggers on properties + properties_extension) + one-shot
backfill from property_details.listing_events for pre-trigger history.
Nearby sold comps map
Loading sold comps map…
Walkable amenities ~0.75 mi
Loading nearby amenities…
Taxation est. · year 1
- Rental income
- $31,965
- − Mortgage interest
- −$17,868
- − Property taxes
- −$4,785
- − Insurance
- −$1,595
- − Repairs & maintenance
- −$2,557
- − Management
- −$2,557
- − HOA
- −$672
- − Depreciation
- −$9,280
- Taxable loss
- −$7,350
- Est. tax savings @ 24.0%
- +$1,764
- After-tax cash flow
- $-110/yr
For passive investors: Depreciation is non-cash, so a rental often shows a tax loss while cash-flowing — sheltering income. Rental losses are passive: they offset passive income freely, and up to $25,000/yr can offset ordinary (W-2) income if you actively participate and your MAGI is under $100k (phasing out to $0 by $150k); unused losses carry forward. On sale, claimed depreciation is recaptured at up to 25%, and gains may owe capital-gains tax (a 1031 exchange can defer both). Figures are a year-1 estimate at your 24.0% rate — not tax advice; consult a CPA.
Schools (NCES district)
- District
- Bennington Public Schools
- NCES district ID
- 3103990
- Math proficiency
- 67% ▼ -6.00%
- Reading proficiency
- 67% ▼ -7.00%
- Median HH income
- $87,771
- Composite
- 60.5/100
- National rank
- #843
- State rank
- #3 of 111 in NE
Livability — Omaha
- Score
- 84/100
- State rank
- #7
- US rank
- #663
Category grades
Schools grade is shown separately in the Schools card above.
Census & demographics
- County
- Douglas County · 538,646 people
- City population
- 552,986
- Metro
- Omaha-Council Bluffs, NE-IA
- Population (ZIP)
- 19,536
- Household income
- $141,042
- Rent vs Own
- Severe rent burden
- 107.0
Population outlook (Douglas County) Hauer SSP2
- Today (2025)
- 625,245 people
- By 2030
- 661,613 · +5.8%
- By 2040
- 732,395 · +17.1%
- By 2050
- 801,988 · +28.3%
- By 2075
- 968,637 · +54.9%
- By 2100
- 1,101,871 · +76.2%
Race, ethnicity, and origin ACS 2023
- Neighborhood character
- Predominantly White (84%)
- Race & ethnicity
- White 84% Hispanic / Latino 6% Two or more races 5% Black 4% Asian 2%
- Hispanic origin (detail)
- Mexican 3%
- Common ancestry
- Iranian 4% Romanian 4% Italian 3%
- Foreign-born
- 3% · Canada
- Languages at home
- 94% English-only · Spanish 3% Other Indo-European 1% Russian/Polish/Slavic 1%
Political lean MEDSL · Douglas
- 2024 margin
- D (+10.2) · D 54.4% · R 44.2% · Other 1.4%
- 2008→2024 swing
- +5.5pp toward D · 2008: 4.6pp · 2024: 10.2pp
- All cycles
- 2024: D+10.2 2020: D+11.3 2016: D+1.4 2012: R+4.3 2008: D+4.6
Not yet ingested
- Civics
- —
Market trends
- HPI YoY
- ▼ -60.06%
- Current HPI
- 250.3443
- Rent YoY
- ▲ 5.88%
- Metro
- Omaha-Council Bluffs, NE-IA
- State GDP YoY
- ▲ 0.68%
- F500 in state
- 2
Industry mix (Fortune 500 HQ in NE)
| Industry | F500 HQs | Revenue |
|---|---|---|
| Conglomerate | 1 | $371B |
|
||
Price history
-24.9% since first listed3 events — show timeline
- 2025-12-31 Pending — GPRMLS
- 2025-12-04 Listed $318,990 GPRMLS
- 2024-12-11 Sold (Public Records) $425,000 Public Records
Property tax history
+129.9%/yrLatest (2025): $551 · +95.6% YoY. Source: county tax records.
Cash-flow waterfall
monthlySold comps — $/sqft
last 12 mo · ≤1 miLoading sold comps…