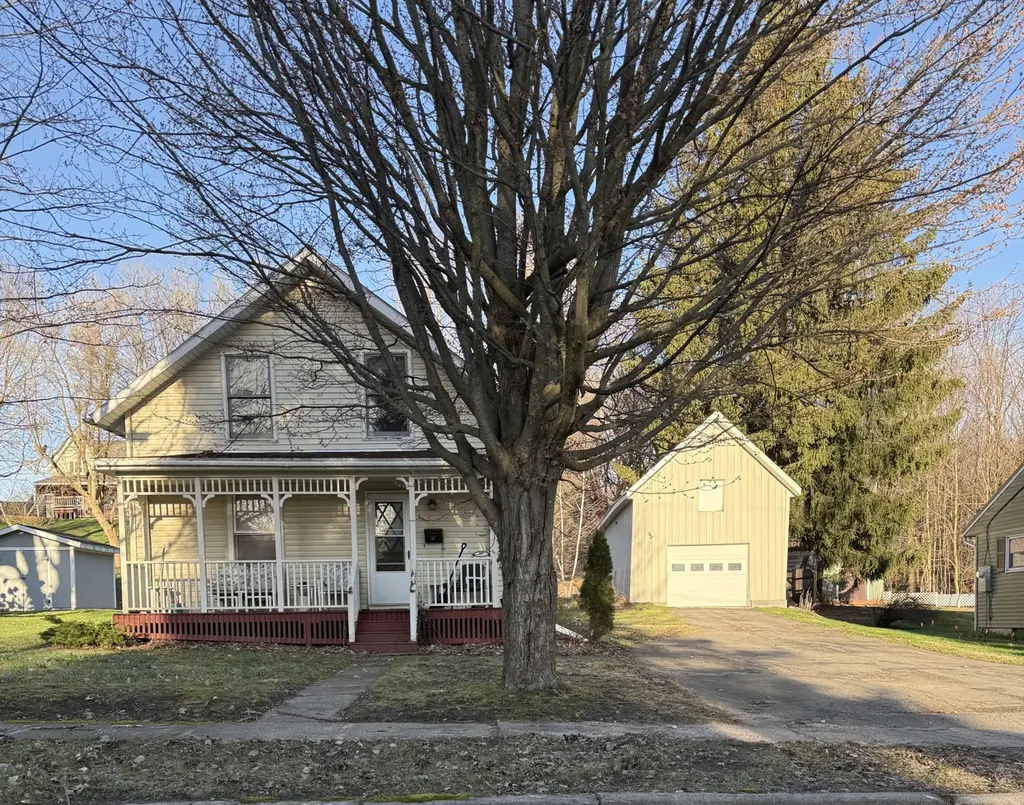
57 Wellington St · Malone, NY
Flood risk 1/10 · Minimal
- FEMA flood zone
- X
- Chance of flooding over 30 yrs
- 0.0%
- Est. flood insurance / yr
- $473 – $860
Fire risk 3/10 · Minor
- Est. fire insurance / yr
- $691 – $1,283
Heat risk 2/10 · Minimal
- Hot days now (above 90°F)
- 7 days/yr
- Hot days in 30 yrs
- 16 days/yr
Wind risk 1/10 · Minimal
- Chance of severe wind over 30 yrs
- —
Air-quality risk 1/10 · Minimal
- Unhealthy air days now
- 0 days/yr
- Unhealthy air days in 30 yrs
- 0 days/yr
Risk factors via First Street. Map © Google.
Why this score? — see what drove the B- grade
The composite is a weighted blend of 9 inputs, each scored 0–100. Each bar is that input's sub-score; the figure is the points it added to the 100-point composite (weight × sub-score).
- Cash flow +18.2/30.0
- ARV discount +15.0/15.0
- Appreciation +10.0/10.0
- 1% rule +5.8/10.0
- DSCR +5.7/10.0
- Livability +3.5/5.0
- Rent growth +2.5/5.0
- Condition / age +2.5/5.0
- Schools +2.4/10.0
$92,500
🖨 Deal sheet 📄 Offer letter ✓ Due diligence
Listing remarks MLS
This is a very well-maintained older story and one half. It is in move-in condition. It has electric heat plus a monitor and thermal replacement windows.
Key facts
- Full second floor
- Detached garage
- 0.33 acre lot
Tags
Property features AI
Exterior
- Parking: Has garage
- Utilities: Public water; Public sewer; Electricity connected; Sewer connected; Water connected; 200+ amp electric service with circuit breakers
- Home design: Single family residence; House with two levels; Facing front garage
- Construction: Vinyl siding; Block and stone foundation; Metal and shingle roof; Built as a house
- Exterior features: Covered porch; Few trees on the lot; Paved road access; Has a view
Interior
- Kitchen: Electric oven; Electric range; Refrigerator
- Bedrooms: Bedrooms on main level
- Flooring: Carpet; Vinyl
- Bathrooms: 1 full bathroom on the main level
- Heating & cooling: Electric heating; Forced air; Propane
- Interior features: Unfinished basement; 8 total rooms; Covered porch
- Laundry & utility: Main level laundry
Neighborhood map
What this means for you Summary
Snapshot
- This is a 2-bed/1.0-bath single-family listed at $92k.
Deal economics
- At list price, monthly cash flow is $82 ($989/yr) — positive.
- The deal already cash-flows at list — no discount required.
- Meets the 1% rule at list price ($1k rent vs $92k).
- Recommended offer: $91k (1.5% below list) — sets the bar for market timing.
- Cap rate 7.4% vs local median 5.3% in Malone — top-decile yield for the area; either an underpriced asset or a hidden risk that comps aren't pricing in. Stress-test before assuming the spread holds.
Location & tenants
- Location reads 70/100 on livability (#437 in NY) — a middle-class / working-renter tenant base. Strengths: cost of living A+, housing A+, health & safety A+; Watch: schools D+, employment D+, crime D-.
- Malone Central School District (town): math 27% / reading 29% proficiency, ranked #581 of 590 in NY (top 98%) — low school quality limits family demand, transient renter base, plan for 1-2y turnover.
- Market conditions: 113 active listings in the ZIP; 124 units permitted in Franklin County in 2024 (0 in 5+ unit buildings).
Forward outlook
- In year one you build about $10k of equity ($640 loan paydown + $9k appreciation (10.0% local appreciation)).
- Franklin County population projected at -14% by 2050 — secular population decline; favor cash flow + early exit over multi-decade hold.
- At projected returns (10.0% appreciation + 3.0% rent growth), your $26k cash investment doubles in ~3 years — after that, you're playing with house money.
- By year 4, paydown + projected appreciation supports a ~$35k cash-out refi (75% LTV) — recoverable capital for the next deal without selling this one.
Negotiation context
- It's been on market 25 days — a 2% lower offer ($91k) is reasonable based on typical stale-listing flexibility.
- 2 sale attempts since 13y ago with the ask held roughly flat each time — persistent listings suggest the price (not the market) is what's stuck; bring a comps-based counter.
- Current owner paid $64k; 45% above their basis — modest negotiation headroom, anchor on the comps not their cost.
Risks & watch-outs
- Watch-outs: built in 1880 — expect roof / HVAC / electrical / plumbing capex.
Questions for the listing agent
- Built in 1880 — when were the roof, HVAC, electrical panel, plumbing, and water heater last replaced?
- Is there a deadline driving the sale (1031 exchange, divorce, estate, relocation)? That informs how much negotiation room exists.
- Schools are D-rated, which usually means shorter tenancies and higher turnover. Who's the typical renter profile here, and what's been the actual vacancy rate?
- Crime grade is D in this area — have there been break-ins, vandalism, or insurance claims at this property in the last 3 years? What carrier currently insures it and at what premium?
- What's the average days-on-market for RENTAL listings here right now (not sales)? A rising rental-DOM trend means longer vacancies and softer asking-rent achievability than the comps imply.
- What's the recent tenant-quality profile in this submarket — average credit score on applications, eviction rate, late-payment / NSF rate, and stable-employment percentage? A property-management company in the area should have these aggregated.
- How much new for-sale + rental construction is in the pipeline within 1–3 miles? Heavy new supply typically softens prices + rents 12–24 months out; constrained supply supports both.
Investment metrics
- 1% rule
- 1.08% ✓
- Cap rate
- 7.36%
- Cash-on-cash
- 3.82%
- DSCR
- 1.17
- GRM
- 7.7
CMA / ARV
- ARV (median comp)
- $128,136
- List price
- $92,500
- Delta
- -27.81%
- Verdict
- UNDERPRICED
- Comps
- 20 within 1.0 mi
Show comp detail 12 sales within ~0.75 mi
| Address | Dist | Beds/Ba | Sqft | Sold | Price | $/sf | Match |
|---|---|---|---|---|---|---|---|
| 48 Frankln St | 0.16mi | 2/1.0 | 1,200 (+4%) | 2mo | $97,850 | $82 | 83 |
| 72 Wellington St | 0.06mi | 3/1.0 (+1) | 1,188 (+4%) | 15mo | $118,453 | $100 | 74 |
| 15 Jones St | 0.22mi | 3/1.0 (+1) | 1,063 (-7%) | 8mo | $165,000 | $155 | 65 |
| 6 Woodward St St | 0.57mi | 3/1.5 (+1) | 1,160 (+1%) | 3mo | $130,000 | $112 | 62 |
| 117 Duane Street St | 0.49mi | 3/1.0 (+1) | 1,158 (+1%) | 12mo | $82,000 | $71 | 61 |
| 14 South St | 0.64mi | 3/1.0 (+1) | 1,133 (-1%) | 6mo | $91,000 | $80 | 58 |
| 47 Amsden St | 0.55mi | 3/1.0 (+1) | 1,068 (-7%) | 4mo | $75,000 | $70 | 55 |
| 28 Branch St St | 0.71mi | 2/1.5 | 1,196 (+4%) | 5mo | $18,000 | $15 | 53 |
| 27 Front st St | 0.50mi | 3/2.0 (+1) | 1,208 (+5%) | 12mo | $38,000 | $31 | 49 |
| 31 Factory Street St | 0.59mi | 3/1.0 (+1) | 1,156 (+1%) | 22mo | $14,000 | $12 | 48 |
| 43 Branch St St | 0.75mi | 3/1.0 (+1) | 1,176 (+2%) | 12mo | $125,000 | $106 | 46 |
| 139 Franklin St | 0.28mi | 3/1.5 (+1) | 1,284 (+12%) | 18mo | $160,000 | $125 | 45 |
Match score weights: distance 35% · size 25% · config 20% · recency 20%. Top-matched comps best support the ARV.
Projected returns pro-forma
10.0% appreciation · 3.0% rent growth · sell at horizon
- IRR
- 27.1%
- Equity multiple
- 3.15×
- Total profit
- $55,683
- Equity at exit
- $83,331
- IRR
- 23.7%
- Equity multiple
- 7.18×
- Total profit
- $159,966
- Equity at exit
- $179,707
Cash invested: $25,900 (down + closing). Projections, not guarantees.
Landlord ↔ Tenant lean methodology
- Overall (STATE)
- 15 Strongly Tenant-Friendly
- State New York
- 15 Strongly Tenant-Friendly · D+10
- County
- — inherits STATE
- City
- — inherits STATE
ZIP-level market 12953
- Home prices YoY
- 7.2%
- Active inventory
- 113
- Price-to-rent
- 7.7×
Monthly cashflow live
- Estimated rent
- $1,001 medium interval (Pro) →
- Mortgage (P&I)
- −$485
- Tax from tax record
- −$185 /mo · $2,218/yr
- Insurance
- −$39
- HOA
- −$0
- Vacancy / Maint / Mgmt
- −$210
- Net cashflow
- $82
Break-even live
UW: 25.0% down · 7.5% · 30yr · 1.5% tax · 5.0% vac · 8.0% maint · 8.0% mgmt
Financing live
Cash to close
- Down payment
- $23,125
- Closing costs
- $2,775
- Reserves months
- —
- Total cash needed
- —
Loan-product check · same deal, 3 products live
Conventional
25% down · 7.5% · 30yr
- Down + closing
- —
- Monthly P&I
- —
- Monthly cashflow
- —
- DSCR
- —
- Eligible?
- —
Personal DTI + credit; lowest rate.
DSCR
20% down · 8.5% · 30yr
- Down + closing
- —
- Monthly P&I
- —
- Monthly cashflow
- —
- DSCR
- —
- Eligible?
- —
No personal income docs; deal must DSCR.
Hard money
10% down · 12.0% · 12mo
- Down + closing
- —
- Monthly P&I
- —
- Monthly cashflow
- —
- DSCR
- —
- Eligible?
- —
Short-term bridge; refi at stabilization.
Listing history 5 events
-
2026-05-18status Pending 463-char remark
-
2026-04-21$92,500 Active 463-char remark
-
2014-03-31soldstatus $64,000 153-char remark
Show marketing remark (153 chars)
This is a very well-maintained older story and one half. It is in move-in condition. It has electric heat plus a monitor and thermal replacement windows.
-
2014-03-31soldstatus $64,000
Show marketing remark (153 chars)
This is a very well-maintained older story and one half. It is in move-in condition. It has electric heat plus a monitor and thermal replacement windows.
-
2013-08-21$64,900 153-char remark
Show marketing remark (153 chars)
This is a very well-maintained older story and one half. It is in move-in condition. It has electric heat plus a monitor and thermal replacement windows.
ⓘ Source: listings_history table (triggers on properties + properties_extension) + one-shot
backfill from property_details.listing_events for pre-trigger history.
Tax reassessment forecast NY · Partial reset (capped growth)
- Current annual tax
- $2,218 · $185/mo
- Projected year-2 tax
- $2,218 · $185/mo
- Expected delta
- $0/yr ($0/mo · 0.0%)
ⓘ Screening estimate from a state-policy table — verify with the county assessor before closing.
Climate risk First Street
- Flood 1/10 Low FEMA zone X · 0% chance over 30 yrs
- Wildfire 3/10 Moderate
- Heat 2/10 Low 7 d/yr ≥90°F today · 16 d/yr by 30 yrs out
- Wind 1/10 Low
- Air quality 1/10 Low 0 unhealthy d/yr today · 0 by 30 yrs out
Nearby sold comps map
Loading sold comps map…
Walkable amenities ~0.75 mi
Loading nearby amenities…
Taxation est. · year 1
- Rental income
- $12,013
- − Mortgage interest
- −$5,181
- − Property taxes
- −$2,218
- − Insurance
- −$462
- − Repairs & maintenance
- −$961
- − Management
- −$961
- − Depreciation
- −$2,691
- Taxable loss
- −$462
- Est. tax savings @ 24.0%
- +$111
- After-tax cash flow
- $1,100/yr
For passive investors: Depreciation is non-cash, so a rental often shows a tax loss while cash-flowing — sheltering income. Rental losses are passive: they offset passive income freely, and up to $25,000/yr can offset ordinary (W-2) income if you actively participate and your MAGI is under $100k (phasing out to $0 by $150k); unused losses carry forward. On sale, claimed depreciation is recaptured at up to 25%, and gains may owe capital-gains tax (a 1031 exchange can defer both). Figures are a year-1 estimate at your 24.0% rate — not tax advice; consult a CPA.
Schools (NCES district)
- District
- Malone Central School District
- NCES district ID
- 3618180
- Math proficiency
- 27% ▼ -16.00%
- Reading proficiency
- 29% ▼ -11.00%
- Median HH income
- $46,681
- Composite
- 24.23/100
- National rank
- #7725
- State rank
- #581 of 590 in NY
Livability — Malone
- Score
- 70/100
- State rank
- #437
- US rank
- #7656
Category grades
Schools grade is shown separately in the Schools card above.
Census & demographics
- Census place
- Malone, NY
- Population (ZIP)
- 12,842
Population outlook (Franklin County) Hauer SSP2
- Today (2025)
- 48,098 people
- By 2030
- 46,790 · -2.7%
- By 2040
- 44,400 · -7.7%
- By 2050
- 41,256 · -14.2%
- By 2075
- 32,190 · -33.1%
- By 2100
- 23,407 · -51.3%
Race, ethnicity, and origin ACS 2023
- Neighborhood character
- Predominantly White (83%)
- Race & ethnicity
- White 83% Black 9% Hispanic / Latino 6%
- Hispanic origin (detail)
- Puerto Rican 2%
- Common ancestry
- Lithuanian 16% Slovak 5% Italian 2%
- Foreign-born
- 3% · Canada
- Languages at home
- 94% English-only · Spanish 4% Other Indo-European 1% French/Haitian/Cajun 1%
Political lean MEDSL · Franklin
- 2024 margin
- Lean R (+9.0) · D 45.5% · R 54.5%
- 2008→2024 swing
- -31.2pp toward R · 2008: 22.2pp · 2024: -9.0pp
- All cycles
- 2024: R+9.0 2020: R+2.2 2016: R+7.4 2012: D+26.3 2008: D+22.2
Not yet ingested
- Civics
- —
Market trends
- HPI YoY
- ▲ 17.73%
- Current HPI
- 263.2406
- Rent YoY
- —
- Metro
- —
- State GDP YoY
- ▲ 2.60%
- F500 in state
- 92
Industry mix (Fortune 500 HQ in NY)
| Industry | F500 HQs | Revenue |
|---|---|---|
| Financial Services | 10 | $950B |
|
||
| Consumer Goods | 9 | $162B |
|
||
| Insurance | 4 | $225B |
|
||
| Telecommunications | 2 | $144B |
|
||
| Pharmaceuticals | 2 | $112B |
|
||
| Media / Entertainment | 2 | $69B |
|
||
Price history
+42.5% since first listed5 events — show timeline
- 2026-05-18 Pending — ACVMLS
- 2026-04-21 Listed $92,500 ACVMLS
- 2014-03-31 Sold (Public Records) $64,000 Public Records
- 2014-03-31 Sold (MLS) $64,000 ACVMLS
- 2013-08-21 Listed $64,900 ACVMLS
Property tax history
+1.2%/yrLatest (2025): $2,218 · -0.7% YoY. Source: county tax records.
Cash-flow waterfall
monthlySold comps — $/sqft
last 12 mo · ≤1 miLoading sold comps…