803 5th Ave S Ave S · Clinton, IA
Flood risk 4/10 · Minor
- FEMA flood zone
- X
- Chance of flooding over 30 yrs
- 0.23%
- Est. flood insurance / yr
- $473 – $860
Fire risk 1/10 · Minimal
- Est. fire insurance / yr
- $902 – $1,676
Heat risk 3/10 · Minor
- Hot days now (above 103°F)
- 7 days/yr
- Hot days in 30 yrs
- 16 days/yr
Wind risk 2/10 · Minimal
- Chance of severe wind over 30 yrs
- —
Air-quality risk 3/10 · Minor
- Unhealthy air days now
- 2 days/yr
- Unhealthy air days in 30 yrs
- 3 days/yr
Risk factors via First Street. Map © Google.
Why this score? — see what drove the C- grade
The composite is a weighted blend of 9 inputs, each scored 0–100. Each bar is that input's sub-score; the figure is the points it added to the 100-point composite (weight × sub-score).
- Cash flow +15.3/30.0
- ARV discount +15.0/15.0
- DSCR +4.7/10.0
- 1% rule +4.5/10.0
- Schools +4.5/10.0
- Livability +3.8/5.0
- Rent growth +2.5/5.0
- Condition / age +2.5/5.0
- Appreciation +0.0/10.0
$149,000
🖨 Deal sheet (PDF) 📄 Offer letter ✓ Due diligence
Listing remarks
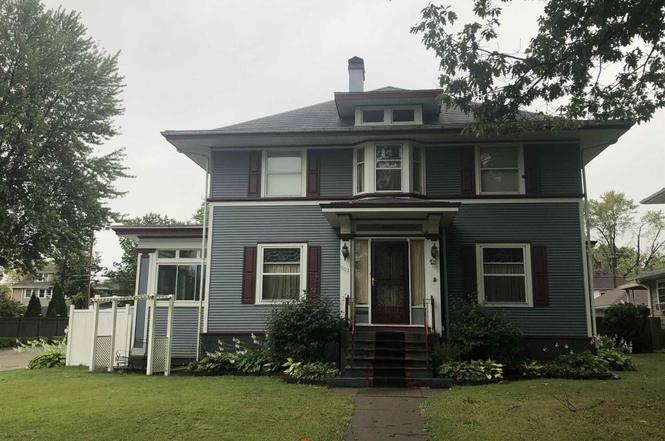
Beautifully built American Four Square style 4 bedroom home with original hardwood floors and woodwork. Main level has large dining and living room and a 3 season porch with many windows. Beautifully tiled and updated full bath and a kitchen with a practical nook. Lower level has a great movie theater system with a screen, projector, sound system, and movie theater style chairs that will all stay with the home. Upper level you will find 4 bedrooms and a full bath with a large tub room. The spacious fenced in back yard has many possibilities as well as a charming 2 car garage.
Key facts
- 3 season porch
- Fenced in back yard
- 2 garage spots
Tags
Property features AI
Finance
- Other: Living area per assessor; Total living area reported as 2,986 (assessor)
- Financial info: Homeowner tax exemption; Special service area included in tax bill; Earnest money required; possession at closing
Exterior
- Parking: Detached garage with alley access (2 garage spaces, 2 total parking spaces)
- Utilities: Public water; Public sewer; Electric with circuit breakers
- Home design: Detached single-family home; 2 stories; Fee simple ownership; Property built over 100 years ago; Built before 1978
- Construction: Wood siding and vinyl siding; Other foundation
- Exterior features: Corner, level lot; Lot dimensions approximately 140 x 50 x 140 x 50
Interior
- Bedrooms: 4 bedrooms
- Bathrooms: 2 full bathrooms; 1 half bathroom; Basement bathroom present
- Heating & cooling: Forced air heating; Central air conditioning
- Interior features: Partial, partially finished basement; Sump pump
Neighborhood map
What this means for you Summary
Snapshot
- This is a 4-bed/3.0-bath single-family listed at $149k.
Deal economics
- At list price, monthly cash flow is $54 ($647/yr) — positive.
- The deal already cash-flows at list — no discount required.
- To meet the 1% rule (rent ≥ 1% of price), the offer needs to be $141k (5.4% below list).
- Recommended offer: $141k (5.4% below list) — sets the bar for 1% rule.
Location & tenants
- Location reads 75/100 on livability (#222 in IA, #4,192 nationally) — a middle-class / working-renter tenant base. Strengths: cost of living A+, housing A+, health & safety A+; Watch: amenities C-, crime D, employment D.
- Clinton Community School District (town): math 52% / reading 56% proficiency, ranked #273 of 289 in IA (top 94%) — acceptable for families but not a draw, mixed tenant base, ~2y average lease.
- Zoned schools: Jefferson Elementary School (math 57% / reading 47%, grade C-, #494 of 616 statewide, top 83%, 343 students, 79% FRL); Clinton Middle School (math 49% / reading 53%, grade C, #210 of 246 statewide, top 87%, 749 students, 59% FRL); Clinton High School (math 43% / reading 57%, grade D+, #313 of 336 statewide, top 93%, 981 students, 49% FRL).
- Market conditions: 247 active listings in the ZIP; 116 units permitted in Clinton County in 2024 (50 in 5+ unit buildings).
Forward outlook
- Local home prices are declining (-3.0%/yr); year-one equity from $1k of loan paydown is wiped out by about $4k of value loss. Plan a longer hold.
- Clinton County population projected at -19% by 2050 — secular population decline; favor cash flow + early exit over multi-decade hold.
Negotiation context
- It's been on market 52 days — a 3% lower offer ($145k) is reasonable based on typical stale-listing flexibility.
- 10 sale attempts since 26y ago with the ask held roughly flat each time — persistent listings suggest the price (not the market) is what's stuck; bring a comps-based counter.
Risks & watch-outs
- Watch-outs: built in 1900 — expect roof / HVAC / electrical / plumbing capex.
Questions for the listing agent
- It's been on market 52 days. Have you received any prior offers? Is the seller open to a 5% concession, seller financing, or rate buy-down credit?
- Built in 1900 — when were the roof, HVAC, electrical panel, plumbing, and water heater last replaced?
- Is there a deadline driving the sale (1031 exchange, divorce, estate, relocation)? That informs how much negotiation room exists.
- Schools are B-rated — typically a magnet for longer-tenancy family renters. What's the average tenant stay here, and is there a school-zone premium baked into asking?
- Crime grade is D in this area — have there been break-ins, vandalism, or insurance claims at this property in the last 3 years? What carrier currently insures it and at what premium?
- What's the average days-on-market for RENTAL listings here right now (not sales)? A rising rental-DOM trend means longer vacancies and softer asking-rent achievability than the comps imply.
- What's the recent tenant-quality profile in this submarket — average credit score on applications, eviction rate, late-payment / NSF rate, and stable-employment percentage? A property-management company in the area should have these aggregated.
- How much new for-sale + rental construction is in the pipeline within 1–3 miles? Heavy new supply typically softens prices + rents 12–24 months out; constrained supply supports both.
Investment metrics
- 1% rule
- 0.95% ✗
- Cap rate
- 6.73%
- Cash-on-cash
- 1.55%
- DSCR
- 1.07
- GRM
- 8.8
CMA / ARV
- ARV (on-the-fly)
- $203,896
- Comps found
- 7
Show comp detail 7 sales within ~0.75 mi
| Address | Dist | Beds/Ba | Sqft | Sold | Price | $/sf | Match |
|---|---|---|---|---|---|---|---|
| 609 5th Ave S | 0.28mi | 4/2.0 | 2,424 (-8%) | 2mo | $98,000 | $40 | 67 |
| 1121 2nd Ave S | 0.49mi | 5/3.5 (+1) | 2,604 (-2%) | 7mo | $230,000 | $88 | 62 |
| 605 S Bluff Blvd | 0.35mi | 5/2.5 (+1) | 2,770 (+5%) | 13mo | $115,000 | $42 | 58 |
| 910 2nd Ave S | 0.32mi | 4/2.5 | 2,262 (-15%) | 1mo | $226,000 | $100 | 58 |
| 631 5th Ave S | 0.23mi | 5/2.5 (+1) | 2,323 (-12%) | 6mo | $135,000 | $58 | 57 |
| 700 S Bluff Blvd | 0.48mi | 4/2.0 | 2,922 (+10%) | 19mo | $225,000 | $77 | 40 |
| 1033 Carriage Hill Dr | 0.73mi | 4/3.0 | 2,316 (-12%) | 10mo | $320,000 | $138 | 37 |
Match score weights: distance 35% · size 25% · config 20% · recency 20%. Top-matched comps best support the ARV.
Projected returns pro-forma
-3.0% appreciation · 3.0% rent growth · sell at horizon
- IRR
- -13.8%
- Equity multiple
- 0.50×
- Total profit
- $-20,670
- Equity at exit
- $22,216
- IRR
- -4.9%
- Equity multiple
- 0.68×
- Total profit
- $-13,415
- Equity at exit
- $12,883
Cash invested: $41,720 (down + closing). Projections, not guarantees.
Landlord ↔ Tenant lean methodology
- Overall (STATE)
- 83 Strongly Landlord-Friendly
- State Iowa
- 83 Strongly Landlord-Friendly · R+6
- County
- — inherits STATE
- City
- — inherits STATE
ZIP-level market 52732
- Home prices YoY
- -34.9%
- Active inventory
- 247
- Price-to-rent
- 8.8×
Monthly cashflow live
- Estimated rent
- $1,409 medium interval (Pro) →
- Mortgage (P&I)
- −$781
- Tax from tax record
- −$216 /mo · $2,588/yr
- Insurance
- −$62
- HOA
- −$0
- Lot rent
- −$0
- Vacancy / Maint / Mgmt
- −$296
- Net cashflow
- $54
Break-even live
Sensitivity live
| Price | -10% $138 | -5% $96 | +0% $54 | +5% $12 | +10% $-30 |
|---|---|---|---|---|---|
| Rent | -10% $-57 | -5% $-2 | +0% $54 | +5% $110 | +10% $165 |
| Rate | -1.0pp $129 | -0.5pp $92 | base $54 | +0.5pp $15 | +1.0pp $-24 |
UW: 25.0% down · 7.5% · 30yr · 1.5% tax · 5.0% vac · 8.0% maint · 8.0% mgmt
Financing live
Cash to close
- Down payment
- $37,250
- Closing costs
- $4,470
- Reserves months
- —
- Total cash needed
- —
Loan-product check · same deal, 3 products live
Conventional
25% down · 7.5% · 30yr
- Down + closing
- —
- Monthly P&I
- —
- Monthly cashflow
- —
- DSCR
- —
- Eligible?
- —
Personal DTI + credit; lowest rate.
DSCR
20% down · 8.5% · 30yr
- Down + closing
- —
- Monthly P&I
- —
- Monthly cashflow
- —
- DSCR
- —
- Eligible?
- —
No personal income docs; deal must DSCR.
Hard money
10% down · 12.0% · 12mo
- Down + closing
- —
- Monthly P&I
- —
- Monthly cashflow
- —
- DSCR
- —
- Eligible?
- —
Short-term bridge; refi at stabilization.
Listing history 34 events
-
2026-05-22status Active
-
2026-02-10historical
-
2026-01-15price $149,000
-
2026-01-15status Active
-
2026-01-14historical
-
2026-01-07status Active
-
2026-01-06historical
-
2026-01-05historical
-
2025-12-08Active
-
2021-08-06historical
-
2021-08-06historical
-
2021-08-06historical
-
2021-08-06historical
-
2021-08-06historical
-
2021-08-06historical
-
2021-08-06historical
-
2021-08-06historical
-
2021-08-06historical
-
2021-08-06historical
-
2021-03-16soldstatus $142,500
-
2021-03-15soldstatus $142,500
-
2021-03-15soldstatus $142,500
-
2020-09-10$145,000
-
2020-09-10$145,000
-
2018-10-19historical
-
2016-08-17historical
-
2012-04-30soldstatus $129,900
-
2012-04-30soldstatus $129,900
-
2011-04-01$139,900
-
2011-04-01$139,900
-
2000-07-17soldstatus $87,000
-
2000-07-17soldstatus $87,000
-
2000-04-24$89,900
-
2000-04-24$89,900
ⓘ Source: listings_history table (triggers on properties + properties_extension) + one-shot
backfill from property_details.listing_events for pre-trigger history.
Tax reassessment forecast IA · Partial reset (capped growth)
- Current annual tax
- $2,588 · $216/mo
- Projected year-2 tax
- $2,588 · $216/mo
- Expected delta
- $0/yr ($0/mo · 0.0%)
ⓘ Screening estimate from a state-policy table — verify with the county assessor before closing.
Climate risk First Street
- Flood 4/10 Moderate FEMA zone X · 23% chance over 30 yrs
- Wildfire 1/10 Low
- Heat 3/10 Moderate 7 d/yr ≥103°F today · 16 d/yr by 30 yrs out
- Wind 2/10 Low
- Air quality 3/10 Moderate 2 unhealthy d/yr today · 3 by 30 yrs out
Nearby sold comps map
Loading sold comps map…
Walkable amenities ~0.75 mi
Loading nearby amenities…
Taxation est. · year 1
- Rental income
- $16,907
- − Mortgage interest
- −$8,346
- − Property taxes
- −$2,588
- − Insurance
- −$745
- − Repairs & maintenance
- −$1,353
- − Management
- −$1,353
- − Depreciation
- −$4,335
- Taxable loss
- −$1,812
- Est. tax savings @ 24.0%
- +$435
- After-tax cash flow
- $1,082/yr
For passive investors: Depreciation is non-cash, so a rental often shows a tax loss while cash-flowing — sheltering income. Rental losses are passive: they offset passive income freely, and up to $25,000/yr can offset ordinary (W-2) income if you actively participate and your MAGI is under $100k (phasing out to $0 by $150k); unused losses carry forward. On sale, claimed depreciation is recaptured at up to 25%, and gains may owe capital-gains tax (a 1031 exchange can defer both). Figures are a year-1 estimate at your 24.0% rate — not tax advice; consult a CPA.
Schools (NCES district)
- District
- Clinton Community School District
- NCES district ID
- 1907710
- Math proficiency
- 52% ▼ -13.00%
- Reading proficiency
- 56% ▼ -8.00%
- Median HH income
- $40,900
- Composite
- 45.22/100
- National rank
- #2666
- State rank
- #273 of 289 in IA
Livability — Clinton
- Score
- 75/100
- State rank
- #222
- US rank
- #4192
Category grades
Schools grade is shown separately in the Schools card above.
Census & demographics
- Census place
- Clinton, IA
- County
- Clinton County · 25,880 people
- City population
- 25,880
- Metro
- Clinton, IA
- Population (ZIP)
- 25,880
- Household income
- $61,105
- Rent vs Own
- Severe rent burden
- 889.0
Population outlook (Clinton County) Hauer SSP2
- Today (2025)
- 44,817 people
- By 2030
- 43,090 · -3.9%
- By 2040
- 39,513 · -11.8%
- By 2050
- 36,209 · -19.2%
- By 2075
- 31,888 · -28.8%
- By 2100
- 30,382 · -32.2%
Race, ethnicity, and origin ACS 2023
- Neighborhood character
- Predominantly White (86%)
- Race & ethnicity
- White 86% Two or more races 7% Hispanic / Latino 5% Black 4%
- Common ancestry
- Iranian 4% Portuguese 2% Lithuanian 2%
- Foreign-born
- 2% · Canada
- Languages at home
- 97% English-only · Spanish 2% Arabic 1%
Political lean MEDSL · Clinton
- 2024 margin
- R (+18.9) · D 39.8% · R 58.6% · Other 1.6%
- 2008→2024 swing
- -41.9pp toward R · 2008: 23.0pp · 2024: -18.9pp
- All cycles
- 2024: R+18.9 2020: R+10.3 2016: R+5.1 2012: D+22.9 2008: D+23.0
Not yet ingested
- Civics
- —
Market trends
- HPI YoY
- ▼ -83.23%
- Current HPI
- 155.3426
- Rent YoY
- —
- Metro
- Clinton, IA
- State GDP YoY
- ▲ 2.48%
- F500 in state
- 4
Industry mix (Fortune 500 HQ in IA)
| Industry | F500 HQs | Revenue |
|---|---|---|
| Financial Services | 1 | $16B |
|
||
| Retail / Convenience | 1 | $15B |
|
||
Price history
+65.7% since first listed34 events — show timeline
- 2026-05-22 Relisted — MRED as Distributed by MLS Grid
- 2026-02-10 Listing Removed — MRED as Distributed by MLS Grid
- 2026-01-15 Price Changed $149,000 MRED as Distributed by MLS Grid
- 2026-01-15 Relisted — MRED as Distributed by MLS Grid
- 2026-01-14 Listing Removed — MRED as Distributed by MLS Grid
- 2026-01-07 Relisted — MRED as Distributed by MLS Grid
- 2026-01-06 Listing Removed — RMLSA as Distributed by MLS Grid
- 2026-01-05 Listing Removed — MRED as Distributed by MLS Grid
- 2025-12-08 Listed — RMLSA as Distributed by MLS Grid
- 2021-08-06 Listing Removed — RMLSA as Distributed by MLS Grid
- 2021-08-06 Listing Removed — RMLSA as Distributed by MLS Grid
- 2021-08-06 Listing Removed — RMLSA as Distributed by MLS Grid
- 2021-08-06 Listing Removed — RMLSA as Distributed by MLS Grid
- 2021-08-06 Listing Removed — RMLSA as Distributed by MLS Grid
- 2021-08-06 Listing Removed — RMLSA as Distributed by MLS Grid
- 2021-08-06 Listing Removed — RMLSA as Distributed by MLS Grid
- 2021-08-06 Listing Removed — RMLSA as Distributed by MLS Grid
- 2021-08-06 Listing Removed — RMLSA as Distributed by MLS Grid
- 2021-08-06 Listing Removed — RMLSA as Distributed by MLS Grid
- 2021-03-16 Sold (Public Records) $142,500 Public Records
- 2021-03-15 Sold (MLS) $142,500 MRED as Distributed by MLS Grid
- 2021-03-15 Sold (MLS) $142,500 RMLSA as Distributed by MLS Grid
- 2020-09-10 Listed $145,000 MRED as Distributed by MLS Grid
- 2020-09-10 Listed $145,000 RMLSA as Distributed by MLS Grid
- 2018-10-19 Listing Removed — MRED as Distributed by MLS Grid
- 2016-08-17 Listing Removed — MRED as Distributed by MLS Grid
- 2012-04-30 Sold (MLS) $129,900 RMLSA as Distributed by MLS Grid
- 2012-04-30 Sold (MLS) $129,900 MRED as Distributed by MLS Grid
- 2011-04-01 Listed $139,900 RMLSA as Distributed by MLS Grid
- 2011-04-01 Listed $139,900 MRED as Distributed by MLS Grid
- 2000-07-17 Sold (MLS) $87,000 RMLSA as Distributed by MLS Grid
- 2000-07-17 Sold (MLS) $87,000 RMLSA as Distributed by MLS Grid
- 2000-04-24 Listed $89,900 RMLSA as Distributed by MLS Grid
- 2000-04-24 Listed $89,900 RMLSA as Distributed by MLS Grid
Property tax history
+0.2%/yrLatest (2025): $2,588 · +1.6% YoY. Source: county tax records.
Cash-flow waterfall
monthlySold comps — $/sqft
last 12 mo · ≤1 miLoading sold comps…