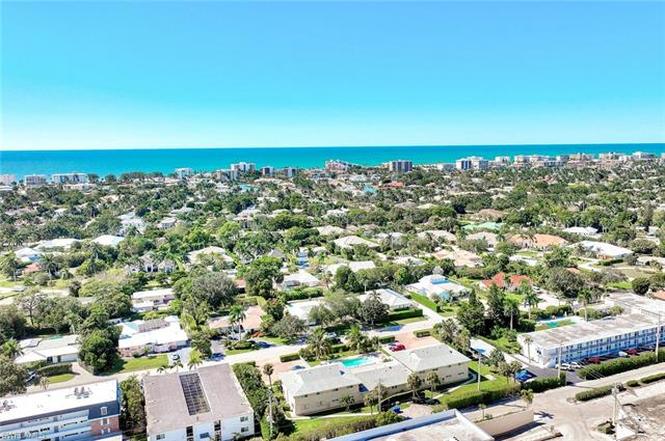
2000 Alamanda Dr #104 · Naples, FL
Flood risk 5/10 · Moderate
- FEMA flood zone
- X (shaded)
- Chance of flooding over 30 yrs
- 0.32%
- Est. flood insurance / yr
- $507 – $1,088
Fire risk 1/10 · Minimal
- Est. fire insurance / yr
- $947 – $1,759
Heat risk 10/10 · Severe
- Hot days now (above 107°F)
- 7 days/yr
- Hot days in 30 yrs
- 29 days/yr
Wind risk 10/10 · Severe
- Chance of severe wind over 30 yrs
- 99.0%
Air-quality risk 2/10 · Minimal
- Unhealthy air days now
- 2 days/yr
- Unhealthy air days in 30 yrs
- 2 days/yr
Risk factors via First Street. Map © Google.
Why this score? — see what drove the B+ grade
The composite is a weighted blend of 9 inputs, each scored 0–100. Each bar is that input's sub-score; the figure is the points it added to the 100-point composite (weight × sub-score).
- Cash flow +27.5/30.0
- DSCR +9.6/10.0
- 1% rule +9.5/10.0
- ARV discount +7.5/15.0
- Appreciation +7.0/10.0
- Schools +5.0/10.0
- Rent growth +4.7/5.0
- Livability +4.0/5.0
- Condition / age +2.5/5.0
$350,000
🖨 Deal sheet 📄 Offer letter ✓ Due diligence
Listing remarks
Nestled in the heart of Naples, this enchanting and meticulously maintained 2 bedroom, 2 bathroom offers a harmonious blend of convenience and relaxed coastal living. Positioned in the coveted neighborhood of the Moorings, it boasts exclusive access to the serene Moorings Private Beach Park, perfect for sun-soaked afternoons. Be captivated by the western exposure, where golden sunsets paint the sky. Picture yourself sipping your morning coffee or unwinding in the evening on your private screened lanai, which provides a tranquil view of the lush community garden. This ground-level unit not only promises a comfortable living arrangement but also offers convenient access to the community pool.
Key facts
- Community pool
- White-sand beaches
- $716 HOA
Tags
Property features AI
Finance
- Other: Part of a 10-unit complex with 5 units in the building and 2 floors total; Located in the MOORINGS development (Ridgewood of Naples sub condo)
- Financial info: Quarterly condo fee reported; Total annual recurring fees reported; One-time fees reported
- HOA & community: Mandatory HOA; Quarterly condo fee; Condo amenities include private beach, private beach pavilion, community pool and private membership; Professional management; Maintenance covers irrigation water and manager services; Non-gated community
Exterior
- Parking: 1 assigned parking space
- Security: Shutters for storm protection
- Utilities: Central water; Central sewer; Cable available
- Home design: Residential property in a low-rise building (1–3 stories); Built in 1978; Rear exposure to the east; Unit 104 in the development
- Construction: Concrete block construction
- Exterior features: Stucco exterior; Shingle roof; Single-hung windows; Electric and manual shutters; Central irrigation; Pool/club view; Zero lot line; Paved road access; Restrictions: no RV, no truck
Interior
- Kitchen: Electric cooktop; Dishwasher; Disposal; Microwave; Refrigerator/freezer
- Bedrooms: 2 bedrooms; First-floor bedroom; Split bedroom floor plan
- Flooring: Tile flooring
- Bathrooms: 2 full bathrooms; Master bath with combined tub and shower
- Heating & cooling: Central electric heat; Central electric cooling; Exhaust fan
- Interior features: Cable prewire; High-speed internet available; Smoke detectors; Dining area open to family room; Screened lanai/porch; Furnished
- Laundry & utility: Washer and dryer inside residence; Laundry in residence
Neighborhood map
What this means for you Summary
Snapshot
- This is a 2-bed/2.0-bath condo listed at $350k.
Deal economics
- At list price, monthly cash flow is $1k ($12k/yr) — positive.
- The deal already cash-flows at list — no discount required.
- Meets the 1% rule at list price ($5k rent vs $350k).
- Recommended offer: $308k (12.0% below list) — sets the bar for market timing.
Location & tenants
- Location reads 80/100 on livability (#126 in FL, #1,903 nationally) — a professional / high-income tenant draw. Strengths: crime A+, amenities A+, employment A+; Watch: commute D+, cost of living F.
- Collier (suburban): math 60% / reading 56% proficiency, ranked #16 of 73 in FL (top 22%) — acceptable for families but not a draw, mixed tenant base, ~2y average lease.
- Market conditions: Rents rising fast (+8.8%/yr); 614 active listings in the ZIP; 40 comparable units currently listed for rent nearby; rentals at typical pace (median 24d on market — plan ~3-4 weeks tenant-placement turnaround); high-income renter base; 3,520 units permitted in Collier County in 2024 (959 in 5+ unit buildings).
- At $5,080/mo this rent would consume 47% of the median local household income ($131k/yr) (locally 333% of renters already pay >50% of income on rent) — very limited rent-growth headroom before tenants either downsize or default.
Forward outlook
- In year one you build about $17k of equity ($2k loan paydown + $14k appreciation (4.1% local appreciation)).
- Collier County population projected at +30% by 2050 — long-run rental-demand tailwind backs the buy-and-hold thesis.
- At projected returns (4.1% appreciation + 8.0% rent growth), your $98k cash investment doubles in ~3 years — after that, you're playing with house money.
- By year 3, paydown + projected appreciation supports a ~$41k cash-out refi (75% LTV) — recoverable capital for the next deal without selling this one.
Negotiation context
- It's been on market 189 days — a 12% lower offer ($308k) is reasonable based on typical stale-listing flexibility.
- 4 sale attempts since 2y ago; this cycle's ask has dropped $69k (16%) from the opening price — seller is motivated, your offer sets the floor, not the list.
- Current owner paid $160k; list at $350k implies a 119% gain — meaningful room to come down on a strong offer.
Risks & watch-outs
- Climate carrying-cost: moderate flood risk; severe wind risk, 99% chance of damaging wind over 30y; extreme-heat days projected 7→29/yr by 2055 (HVAC capex compounding) — expect insurance premiums to compound above CPI over the hold.
Questions for the listing agent
- It's been on market 189 days. Have you received any prior offers? Is the seller open to a 12% concession, seller financing, or rate buy-down credit?
- Built in 1978 — when were the roof, HVAC, electrical panel, plumbing, and water heater last replaced?
- What does the HOA fee cover, when was the last increase, and are there any pending special assessments or reserve-fund shortfalls?
- Any open or pending special assessments — roof, HVAC, plumbing, elevator, façade? What's the per-unit balance and payoff schedule, and is the seller paying it off at close or rolling it to the buyer?
- Why hasn't it sold? Are there any deal-killer items the seller is aware of (foundation, flood, title, zoning, code violations)?
- Is there a deadline driving the sale (1031 exchange, divorce, estate, relocation)? That informs how much negotiation room exists.
- Schools are B-rated — typically a magnet for longer-tenancy family renters. What's the average tenant stay here, and is there a school-zone premium baked into asking?
- What's the average days-on-market for RENTAL listings here right now (not sales)? A rising rental-DOM trend means longer vacancies and softer asking-rent achievability than the comps imply.
- What's the recent tenant-quality profile in this submarket — average credit score on applications, eviction rate, late-payment / NSF rate, and stable-employment percentage? A property-management company in the area should have these aggregated.
- How much new apartment / multifamily construction is in the pipeline within 1–3 miles? Heavy new supply (>2% of stock underway) typically softens rents 12–24 months out; light construction supports rent growth.
Investment metrics
- 1% rule
- 1.45% ✓
- Cap rate
- 9.83%
- Cash-on-cash
- 12.64%
- DSCR
- 1.56
- GRM
- 5.7
CMA / ARV
No comps found within radius.
Projected returns pro-forma
4.08% appreciation · 8.0% rent growth · sell at horizon
- IRR
- 25.5%
- Equity multiple
- 2.59×
- Total profit
- $155,676
- Equity at exit
- $179,166
- IRR
- 28.2%
- Equity multiple
- 5.98×
- Total profit
- $488,511
- Equity at exit
- $294,413
Cash invested: $98,000 (down + closing). Projections, not guarantees.
Landlord ↔ Tenant lean methodology
- Overall (STATE)
- 87 Strongly Landlord-Friendly
- State Florida
- 87 Strongly Landlord-Friendly · R+3
- County
- — inherits STATE
- City
- — inherits STATE
ZIP-level market 34102
- Home prices YoY
- 1.3%
- Rents YoY
- 8.8%
- Active inventory
- 614
- Price-to-rent
- 5.7×
Monthly cashflow live
- Estimated rent
- $5,080 medium interval (Pro) →
- Mortgage (P&I)
- −$1,835
- Tax from tax record
- −$284 /mo · $3,403/yr
- Insurance
- −$146
- HOA
- −$716
- Vacancy / Maint / Mgmt
- −$1,067
- Net cashflow
- $1,032
Break-even live
UW: 25.0% down · 7.5% · 30yr · 1.5% tax · 5.0% vac · 8.0% maint · 8.0% mgmt
Financing live
Cash to close
- Down payment
- $87,500
- Closing costs
- $10,500
- Reserves months
- —
- Total cash needed
- —
Loan-product check · same deal, 3 products live
Conventional
25% down · 7.5% · 30yr
- Down + closing
- —
- Monthly P&I
- —
- Monthly cashflow
- —
- DSCR
- —
- Eligible?
- —
Personal DTI + credit; lowest rate.
DSCR
20% down · 8.5% · 30yr
- Down + closing
- —
- Monthly P&I
- —
- Monthly cashflow
- —
- DSCR
- —
- Eligible?
- —
No personal income docs; deal must DSCR.
Hard money
10% down · 12.0% · 12mo
- Down + closing
- —
- Monthly P&I
- —
- Monthly cashflow
- —
- DSCR
- —
- Eligible?
- —
Short-term bridge; refi at stabilization.
Rent comps 40 comps
| Address | Beds | Baths | Sqft | Rent | $/sqft | DOM | Units | Dist |
|---|---|---|---|---|---|---|---|---|
| 1930 Gulf Shore Blvd N Unit A302S Naples, FL | 2.0 | 2.0 | 1420 | $6,995 | $4.93 | 23d | 1 | 0.51mi |
| 1930 Gulf Shore Blvd N Unit D102 Naples, FL | 2.0 | 2.0 | 1476 | $6,500 | $4.40 | 23d | 1 | 0.54mi |
| 1910 Gulf Shore Blvd N Naples, FL | 2.0 | 2.0 | 1290 | $9,200 | $7.13 | 23d | 2 | 0.55mi |
| 1950 Gulf Shore Blvd N Naples, FL | 2.0 | 2.0 | 1060 | $7,250 | $6.84 | 23d | 2 | 0.56mi |
| 2100 Gulf Shore Blvd N #101 Naples, FL | 2.0 | 2.0 | 1200 | $8,000 | $6.67 | 23d | 1 | 0.61mi |
| 1851 Gulf Shore Blvd N #15 Naples, FL | 2.0 | 2.0 | 1140 | $12,000 | $10.53 | 23d | 1 | 0.62mi |
| 1977 Gulf Shore Blvd N Naples, FL | 2.0 | 2.0 | 1300 | $9,500 | $7.31 | 23d | 3 | 0.63mi |
| 1550 Gulf Shore Blvd N Unit E6 Naples, FL | 1.0 | 1.0 | 817 | $7,000 | $8.57 | 21d | 1 | 0.64mi |
| 1550 Gulf Shore Blvd N Unit E6 Naples, FL | 1.0 | 1.0 | 817 | $7,000 | $8.57 | 13d | 1 | 0.64mi |
| 2011 Gulf Shore Blvd N #45 Naples, FL | 2.0 | 2.0 | 1100 | $8,500 | $7.73 | 23d | 1 | 0.64mi |
| 1334 Crayton Rd #1 Naples, FL | 2.0 | 2.0 | 1100 | $6,800 | $6.18 | 23d | 1 | 0.66mi |
| 2258 Gulf Shore Blvd N Unit O1 Naples, FL | 2.0 | 2.0 | 1491 | $13,750 | $9.22 | 23d | 1 | 0.66mi |
| 2216 Gulf Shore Blvd N Unit R3 Naples, FL | 2.0 | 2.0 | 1265 | $10,000 | $7.91 | 23d | 1 | 0.68mi |
| 2203 Gulf Shore Blvd N Unit E1 Naples, FL | 2.0 | 2.0 | 1491 | $17,500 | $11.74 | 23d | 1 | 0.71mi |
| 2400 14th St N Naples, FL | 3.0 | 2.0 | 1464 | $5,890 | $4.02 | 13d | 1 | 0.71mi |
| 2211 Gulf Shore Blvd N Unit C4 Naples, FL | 2.0 | 2.0 | 1265 | $17,500 | $13.83 | 23d | 1 | 0.73mi |
| 1300 Gulf Shore Blvd N #205 Naples, FL | 2.0 | 2.0 | 850 | $5,900 | $6.94 | 23d | 1 | 0.75mi |
| 1300 Gulf Shore Blvd N #406 Naples, FL | 2.0 | 2.0 | 850 | $6,500 | $7.65 | 23d | 1 | 0.75mi |
| 1300 Gulf Shore Blvd N #304 Naples, FL | 2.0 | 2.0 | 850 | $5,500 | $6.47 | 23d | 1 | 0.75mi |
| 1300 Gulf Shore Blvd N #700 Naples, FL | 2.0 | 2.0 | 850 | $6,250 | $7.35 | 23d | 1 | 0.75mi |
| 1236 13th Ave N Naples, FL | 3.0 | 2.0 | 1461 | $14,500 | $9.92 | 23d | 1 | 0.75mi |
| 820 Ketch Dr #2 Naples, FL | 2.0 | 2.0 | 1100 | $5,700 | $5.18 | 23d | 1 | 0.77mi |
| 820 Ketch Dr #3 Naples, FL | 2.0 | 2.0 | 1100 | $5,500 | $5.00 | 23d | 1 | 0.77mi |
| 2500 Gulf Shore Blvd N Unit S6 Naples, FL | 2.0 | 2.0 | 1145 | $7,500 | $6.55 | 23d | 1 | 0.77mi |
| 2600 Gulf Shore Blvd N #64 Naples, FL | 2.0 | 2.0 | 1200 | $7,200 | $6.00 | 23d | 1 | 0.78mi |
| 3030 Binnacle Dr #201 Naples, FL | 2.0 | 2.0 | 1092 | $5,000 | $4.58 | 23d | 1 | 0.86mi |
| 222 Harbour Dr #105 Naples, FL | 2.0 | 2.0 | 1393 | $13,000 | $9.33 | 23d | 1 | 0.86mi |
| 333 Harbour Dr #211 Naples, FL | 2.0 | 2.0 | 975 | $5,500 | $5.64 | 13d | 1 | 0.87mi |
| 1100 Gulf Shore Blvd N Naples, FL | 2.0 | 2.0 | 945 | $6,000 | $6.35 | 23d | 2 | 0.88mi |
| 981 8th Ter N Naples, FL | 3.0 | 2.0 | 1200 | $8,500 | $7.08 | 23d | 1 | 0.93mi |
| 905 13th St N Naples, FL | 3.0 | 2.0 | 1292 | $8,000 | $6.19 | 23d | 1 | 0.94mi |
| 982 13th St N Naples, FL | 3.0 | 2.5 | 1204 | $8,000 | $6.64 | 23d | 1 | 0.96mi |
| 2885 Gulf Shore Blvd N #302 Naples, FL | 2.0 | 2.0 | 1500 | $20,000 | $13.33 | 23d | 1 | 0.98mi |
| 3200 Binnacle Dr Unit D3 Naples, FL | 2.0 | 2.0 | 1180 | $9,000 | $7.63 | 21d | 1 | 1.02mi |
| 714 11th St N Naples, FL | 3.0 | 2.0 | 1183 | $9,500 | $8.03 | 23d | 1 | 1.06mi |
| 45 High Point Cir S #303 Naples, FL | 2.0 | 2.0 | 1015 | $5,500 | $5.42 | 23d | 1 | 1.07mi |
| 3070 Gulf Shore Blvd N #103 Naples, FL | 2.0 | 2.0 | 1300 | $8,000 | $6.15 | 23d | 1 | 1.07mi |
| 3200 Gulf Shore Blvd N #105 Naples, FL | 2.0 | 2.0 | 1116 | $8,500 | $7.62 | 23d | 1 | 1.12mi |
| 3400 Gulf Shore Blvd N Unit M3 Naples, FL | 2.0 | 2.0 | 1337 | $9,500 | $7.11 | 23d | 1 | 1.22mi |
| 788 Park Shore Dr Naples, FL | 1.0–2.0 | 1.5–2.0 | 931 | $5,500 | $5.90 | 13d | 3 | 1.36mi |
HOA detail condo
- Monthly dues
- $716 · $8,592/yr
- Likely covers
- pool
- Assessments
- None detected in remarks — confirm with the listing agent.
Listing history 23 events
-
2026-06-18days on market $350,000 Active 189 DOM
-
2026-06-17days on market $350,000 Active 188 DOM
-
2026-06-16days on market $350,000 Active 187 DOM
-
2026-06-15days on market $350,000 Active 186 DOM
-
2026-06-10days on market $350,000 Active 181 DOM
-
2026-06-09days on market $350,000 Active 180 DOM
-
2026-06-08days on market $350,000 Active 179 DOM
-
2026-06-07days on market $350,000 Active 178 DOM
-
2026-06-03days on market $350,000 Active 174 DOM
-
2026-06-02days on market $350,000 Active 173 DOM
-
2026-06-01days on market $350,000 Active 172 DOM
-
2026-05-31days on market $350,000 Active 171 DOM
-
2026-05-30days on market $350,000 Active 170 DOM
-
2026-05-13status Active
-
2026-03-26historical
-
2026-03-01price $350,000
-
2026-01-20price $395,000
-
2025-10-24$419,000 Active
-
2025-05-01historical
-
2024-11-05$519,000 Active
-
2024-10-01historical
-
2024-04-12$519,000 Active
-
2003-12-03soldstatus $160,000
ⓘ Source: listings_history table (triggers on properties + properties_extension) + one-shot
backfill from property_details.listing_events for pre-trigger history.
Tax reassessment forecast FL · Resets to sale price
- Current annual tax
- $3,403 · $284/mo
- Projected year-2 tax
- $3,403 · $284/mo
- Expected delta
- $0/yr ($0/mo · 0.0%)
ⓘ Screening estimate from a state-policy table — verify with the county assessor before closing.
Climate risk First Street
- Flood 5/10 Major FEMA zone X (shaded) · 32% chance over 30 yrs
- Wildfire 1/10 Low
- Heat 10/10 Extreme 7 d/yr ≥107°F today · 29 d/yr by 30 yrs out
- Wind 10/10 Extreme 99% chance of damaging wind over 30 yrs
- Air quality 2/10 Low 2 unhealthy d/yr today · 2 by 30 yrs out
Nearby sold comps map
Loading sold comps map…
Walkable amenities ~0.75 mi
Loading nearby amenities…
Taxation est. · year 1
- Rental income
- $60,962
- − Mortgage interest
- −$19,605
- − Property taxes
- −$3,403
- − Insurance
- −$1,750
- − Repairs & maintenance
- −$4,877
- − Management
- −$4,877
- − HOA
- −$8,592
- − Depreciation
- −$10,182
- Taxable income
- $7,676
- Est. tax owed @ 24.0%
- −$1,842
- After-tax cash flow
- $10,548/yr
For passive investors: Depreciation is non-cash, so a rental often shows a tax loss while cash-flowing — sheltering income. Rental losses are passive: they offset passive income freely, and up to $25,000/yr can offset ordinary (W-2) income if you actively participate and your MAGI is under $100k (phasing out to $0 by $150k); unused losses carry forward. On sale, claimed depreciation is recaptured at up to 25%, and gains may owe capital-gains tax (a 1031 exchange can defer both). Figures are a year-1 estimate at your 24.0% rate — not tax advice; consult a CPA.
Schools (NCES district)
- District
- Collier
- NCES district ID
- 1200330
- Math proficiency
- 60% ▼ -4.00%
- Reading proficiency
- 56% ▼ -2.00%
- Median HH income
- $58,275
- Composite
- 50.23/100
- National rank
- #1892
- State rank
- #16 of 73 in FL
Livability — Naples
- Score
- 80/100
- State rank
- #126
- US rank
- #1903
Category grades
Schools grade is shown separately in the Schools card above.
Census & demographics
- Census place
- Naples, FL
- County
- Collier County · 396,295 people
- City population
- 344,941
- Metro
- Naples-Marco Island, FL
- Population (ZIP)
- 11,179
- Household income
- $130,929
- Rent vs Own
- Severe rent burden
- 333.0
Population outlook (Collier County) Hauer SSP2
- Today (2025)
- 420,858 people
- By 2030
- 450,054 · +6.9%
- By 2040
- 502,232 · +19.3%
- By 2050
- 544,932 · +29.5%
- By 2075
- 627,203 · +49.0%
- By 2100
- 659,015 · +56.6%
Race, ethnicity, and origin ACS 2023
- Neighborhood character
- Predominantly White (79%)
- Race & ethnicity
- White 79% Hispanic / Latino 9% Two or more races 8% Black 8% Asian 1%
- Hispanic origin (detail)
- Cuban 6%
- Common ancestry
- Hispanic 4% Lithuanian 4% Romanian 4%
- Foreign-born
- 17% · Canada, China
- Languages at home
- 87% English-only · Spanish 7% French/Haitian/Cajun 4% German/W. Germanic 1%
Political lean MEDSL · Collier
- 2024 margin
- Solid R (+33.1) · D 33.1% · R 66.2%
- 2008→2024 swing
- -10.6pp toward R · 2008: -22.5pp · 2024: -33.1pp
- All cycles
- 2024: R+33.1 2020: R+24.7 2016: R+26.0 2012: R+30.1 2008: R+22.5
Not yet ingested
- Civics
- —
Market trends
- HPI YoY
- ▲ 4.08%
- Current HPI
- 328.2755
- Rent YoY
- ▲ 8.75%
- Metro
- Naples-Marco Island, FL
- State GDP YoY
- ▲ 3.28%
- F500 in state
- 36
Industry mix (Fortune 500 HQ in FL)
| Industry | F500 HQs | Revenue |
|---|---|---|
| Industrial Technology | 2 | $29B |
|
||
| Insurance | 2 | $17B |
|
||
| Retail | 1 | $60B |
|
||
| Technology Distribution | 1 | $58B |
|
||
| Homebuilding | 1 | $35B |
|
||
| Technology Manufacturing | 1 | $35B |
|
||
Price history
+118.8% since first listed10 events — show timeline
- 2026-05-13 Relisted — NAPLESMLS
- 2026-03-26 Listing Removed — NAPLESMLS
- 2026-03-01 Price Changed $350,000 NAPLESMLS
- 2026-01-20 Price Changed $395,000 NAPLESMLS
- 2025-10-24 Listed $419,000 NAPLESMLS
- 2025-05-01 Listing Removed — NAPLESMLS
- 2024-11-05 Listed $519,000 NAPLESMLS
- 2024-10-01 Listing Removed — NAPLESMLS
- 2024-04-12 Listed $519,000 NAPLESMLS
- 2003-12-03 Sold (Public Records) $160,000 Public Records
Property tax history
+12.5%/yrLatest (2025): $3,403 · +230.7% YoY. Source: county tax records.
Cash-flow waterfall
monthlySold comps — $/sqft
last 12 mo · ≤1 miLoading sold comps…