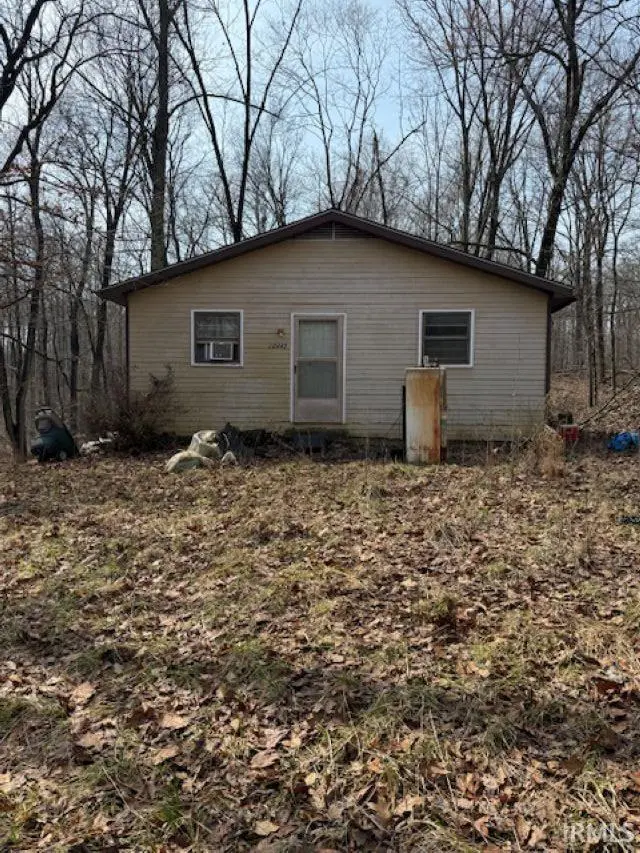
10443 E Lake Edward Dr · Huntingburg, IN
Flood risk 1/10 · Minimal
- FEMA flood zone
- X (unshaded)
- Chance of flooding over 30 yrs
- 0.0%
- Est. flood insurance / yr
- $473 – $860
Fire risk 1/10 · Minimal
- Est. fire insurance / yr
- $717 – $1,331
Heat risk 4/10 · Minor
- Hot days now (above 106°F)
- 7 days/yr
- Hot days in 30 yrs
- 19 days/yr
Wind risk 2/10 · Minimal
- Chance of severe wind over 30 yrs
- 2.0%
Air-quality risk 4/10 · Minor
- Unhealthy air days now
- 4 days/yr
- Unhealthy air days in 30 yrs
- 6 days/yr
Risk factors via First Street. Map © Google.
Why this score? — see what drove the B- grade
The composite is a weighted blend of 9 inputs, each scored 0–100. Each bar is that input's sub-score; the figure is the points it added to the 100-point composite (weight × sub-score).
- Cash flow +30.0/30.0
- 1% rule +10.0/10.0
- DSCR +10.0/10.0
- ARV discount +7.5/15.0
- Livability +3.2/5.0
- Schools +2.9/10.0
- Rent growth +2.5/5.0
- Condition / age +2.5/5.0
- Appreciation +0.0/10.0
$45,000
🖨 Deal sheet 📄 Offer letter ✓ Due diligence
Listing remarks MLS
Looking for a getaway property? This could be great investment for a summer retreat. Secluded, One bedroom, One bath home on half an acre in Lake Edward!
Key facts
- 0.53 acre lot
- Built 1981
- Listed 58 days
Neighborhood map
What this means for you Summary
Snapshot
- This is a 1-bed/1.0-bath single-family listed at $45k.
Deal economics
- At list price, monthly cash flow is $333 ($4k/yr) — positive.
- The deal already cash-flows at list — no discount required.
- Meets the 1% rule at list price ($875 rent vs $45k).
- Recommended offer: $44k (3.0% below list) — sets the bar for market timing.
Location & tenants
- Location reads 65/100 on livability (#333 in IN) — a middle-class / working-renter tenant base. Strengths: cost of living A+, housing A, crime A-; Watch: health & safety C-, schools D+, employment D+.
- Pike County School Corporation (rural): math 29% / reading 39% proficiency, ranked #203 of 301 in IN (top 67%) — families likely to look elsewhere, expect single-tenant / working-renter base with shorter leases.
- Market conditions: 60 active listings in the ZIP; 7 units permitted in Pike County in 2024 (0 in 5+ unit buildings).
Forward outlook
- Local home prices are declining (-3.0%/yr); year-one equity from $311 of loan paydown is wiped out by about $1k of value loss. Plan a longer hold.
- Pike County population projected at -20% by 2050 — secular population decline; favor cash flow + early exit over multi-decade hold.
- At projected returns (-3.0% appreciation + 3.0% rent growth), your $13k cash investment doubles in ~4 years — after that, you're playing with house money.
Negotiation context
- It's been on market 58 days — a 3% lower offer ($44k) is reasonable based on typical stale-listing flexibility.
- 5 sale attempts since 11y ago; this cycle's ask has dropped $45k (50%) from the opening price — seller is motivated, your offer sets the floor, not the list.
Risks & watch-outs
- Watch-outs: property tax is 2.8% of price.
Questions for the listing agent
- It's been on market 58 days. Have you received any prior offers? Is the seller open to a 3% concession, seller financing, or rate buy-down credit?
- Property tax is high relative to price — has the assessment been appealed recently, and will the sale trigger a re-assessment?
- Is there a deadline driving the sale (1031 exchange, divorce, estate, relocation)? That informs how much negotiation room exists.
- Schools are D-rated, which usually means shorter tenancies and higher turnover. Who's the typical renter profile here, and what's been the actual vacancy rate?
- What's the average days-on-market for RENTAL listings here right now (not sales)? A rising rental-DOM trend means longer vacancies and softer asking-rent achievability than the comps imply.
- What's the recent tenant-quality profile in this submarket — average credit score on applications, eviction rate, late-payment / NSF rate, and stable-employment percentage? A property-management company in the area should have these aggregated.
- How much new for-sale + rental construction is in the pipeline within 1–3 miles? Heavy new supply typically softens prices + rents 12–24 months out; constrained supply supports both.
Investment metrics
- 1% rule
- 1.95% ✓
- Cap rate
- 15.17%
- Cash-on-cash
- 31.71%
- DSCR
- 2.41
- GRM
- 4.3
CMA / ARV
No comps found within radius.
Projected returns pro-forma
-3.0% appreciation · 3.0% rent growth · sell at horizon
- IRR
- 26.7%
- Equity multiple
- 2.11×
- Total profit
- $13,955
- Equity at exit
- $6,710
- IRR
- 34.3%
- Equity multiple
- 4.15×
- Total profit
- $39,629
- Equity at exit
- $3,891
Cash invested: $12,600 (down + closing). Projections, not guarantees.
Landlord ↔ Tenant lean methodology
- Overall (STATE)
- 90 Strongly Landlord-Friendly
- State Indiana
- 90 Strongly Landlord-Friendly · R+11
- County
- — inherits STATE
- City
- — inherits STATE
ZIP-level market 47542
- Home prices YoY
- -18.1%
- Active inventory
- 60
- Price-to-rent
- 4.3×
Monthly cashflow live
- Estimated rent
- $875 medium interval (Pro) →
- Mortgage (P&I)
- −$236
- Tax from tax record
- −$104 /mo · $1,246/yr
- Insurance
- −$19
- HOA
- −$0
- Vacancy / Maint / Mgmt
- −$184
- Net cashflow
- $333
Break-even live
UW: 25.0% down · 7.5% · 30yr · 1.5% tax · 5.0% vac · 8.0% maint · 8.0% mgmt
Financing live
Cash to close
- Down payment
- $11,250
- Closing costs
- $1,350
- Reserves months
- —
- Total cash needed
- —
Loan-product check · same deal, 3 products live
Conventional
25% down · 7.5% · 30yr
- Down + closing
- —
- Monthly P&I
- —
- Monthly cashflow
- —
- DSCR
- —
- Eligible?
- —
Personal DTI + credit; lowest rate.
DSCR
20% down · 8.5% · 30yr
- Down + closing
- —
- Monthly P&I
- —
- Monthly cashflow
- —
- DSCR
- —
- Eligible?
- —
No personal income docs; deal must DSCR.
Hard money
10% down · 12.0% · 12mo
- Down + closing
- —
- Monthly P&I
- —
- Monthly cashflow
- —
- DSCR
- —
- Eligible?
- —
Short-term bridge; refi at stabilization.
Listing history 12 events
-
2026-06-04days on market $45,000 Active 58 DOM
-
2026-06-02days on market $45,000 Active 57 DOM
-
2026-06-01days on market $45,000 Active 56 DOM
-
2026-05-31days on market $45,000 Active 55 DOM
-
2026-05-31days on market $45,000 Active 54 DOM
-
2026-04-29price $45,000 153-char remark
Show marketing remark (153 chars)
Looking for a getaway property? This could be great investment for a summer retreat. Secluded, One bedroom, One bath home on half an acre in Lake Edward!
-
2026-04-06$90,000 Active 153-char remark
Show marketing remark (153 chars)
Looking for a getaway property? This could be great investment for a summer retreat. Secluded, One bedroom, One bath home on half an acre in Lake Edward!
-
2018-03-23soldstatus $111,000
-
2018-02-01$119,000
-
2017-05-22$117,000
-
2016-09-27$140,000
-
2015-11-02$140,000
ⓘ Source: listings_history table (triggers on properties + properties_extension) + one-shot
backfill from property_details.listing_events for pre-trigger history.
Tax reassessment forecast IN · Partial reset (capped growth)
- Current annual tax
- $1,246 · $104/mo
- Projected year-2 tax
- $1,246 · $104/mo
- Expected delta
- $0/yr ($0/mo · 0.0%)
ⓘ Screening estimate from a state-policy table — verify with the county assessor before closing.
Climate risk First Street
- Flood 1/10 Low FEMA zone X (unshaded) · 0% chance over 30 yrs
- Wildfire 1/10 Low
- Heat 4/10 Moderate 7 d/yr ≥106°F today · 19 d/yr by 30 yrs out
- Wind 2/10 Low 2% chance of damaging wind over 30 yrs
- Air quality 4/10 Moderate 4 unhealthy d/yr today · 6 by 30 yrs out
Nearby sold comps map
Loading sold comps map…
Walkable amenities ~0.75 mi
Loading nearby amenities…
Taxation est. · year 1
- Rental income
- $10,504
- − Mortgage interest
- −$2,521
- − Property taxes
- −$1,246
- − Insurance
- −$225
- − Repairs & maintenance
- −$840
- − Management
- −$840
- − Depreciation
- −$1,309
- Taxable income
- $3,522
- Est. tax owed @ 24.0%
- −$845
- After-tax cash flow
- $3,150/yr
For passive investors: Depreciation is non-cash, so a rental often shows a tax loss while cash-flowing — sheltering income. Rental losses are passive: they offset passive income freely, and up to $25,000/yr can offset ordinary (W-2) income if you actively participate and your MAGI is under $100k (phasing out to $0 by $150k); unused losses carry forward. On sale, claimed depreciation is recaptured at up to 25%, and gains may owe capital-gains tax (a 1031 exchange can defer both). Figures are a year-1 estimate at your 24.0% rate — not tax advice; consult a CPA.
Schools (NCES district)
- District
- Pike County School Corporation
- NCES district ID
- 1808900
- Math proficiency
- 29% ▼ -6.00%
- Reading proficiency
- 39% ▼ -2.00%
- Median HH income
- $43,646
- Composite
- 28.88/100
- National rank
- #6642
- State rank
- #203 of 301 in IN
Livability — Huntingburg
- Score
- 65/100
- State rank
- #333
- US rank
- #12867
Category grades
Schools grade is shown separately in the Schools card above.
Census & demographics
- City population
- 10,034
- Population (ZIP)
- 10,034
Population outlook (Pike County) Hauer SSP2
- Today (2025)
- 11,816 people
- By 2030
- 11,348 · -4.0%
- By 2040
- 10,351 · -12.4%
- By 2050
- 9,410 · -20.4%
- By 2075
- 7,638 · -35.4%
- By 2100
- 6,118 · -48.2%
Race, ethnicity, and origin ACS 2023
- Neighborhood character
- Predominantly White (71%)
- Race & ethnicity
- White 71% Hispanic / Latino 25% Two or more races 12% Black 2%
- Hispanic origin (detail)
- Mexican 6% Puerto Rican 3%
- Common ancestry
- Lithuanian 1% Serbian 1%
- Foreign-born
- 12% · Canada
- Languages at home
- 83% English-only · Spanish 16%
Political lean MEDSL · Pike
- 2024 margin
- Solid R (+54.9) · D 21.9% · R 76.7% · Other 1.4%
- 2008→2024 swing
- -46.2pp toward R · 2008: -8.6pp · 2024: -54.9pp
- All cycles
- 2024: R+54.9 2020: R+52.7 2016: R+51.9 2012: R+25.4 2008: R+8.6
Not yet ingested
- Civics
- —
Market trends
- HPI YoY
- ▼ -46.45%
- Current HPI
- 209.5365
- Rent YoY
- —
- Metro
- —
- State GDP YoY
- ▲ 2.90%
- F500 in state
- 18
Industry mix (Fortune 500 HQ in IN)
| Industry | F500 HQs | Revenue |
|---|---|---|
| Industrial Machinery | 2 | $37B |
|
||
| Healthcare | 1 | $177B |
|
||
| Pharmaceuticals | 1 | $45B |
|
||
| Metals / Steel | 1 | $18B |
|
||
| Agriculture | 1 | $17B |
|
||
| Packaging | 1 | $12B |
|
||
Price history
-67.9% since first listed7 events — show timeline
- 2026-04-29 Price Changed $45,000 IRMLS
- 2026-04-06 Listed $90,000 IRMLS
- 2018-03-23 Sold (MLS) $111,000 IRMLS
- 2018-02-01 Listed $119,000 IRMLS
- 2017-05-22 Listed $117,000 IRMLS
- 2016-09-27 Listed $140,000 IRMLS
- 2015-11-02 Listed $140,000 IRMLS
Property tax history
+4.7%/yrLatest (2024): $1,246 · +4.7% YoY. Source: county tax records.
Cash-flow waterfall
monthlySold comps — $/sqft
last 12 mo · ≤1 miLoading sold comps…