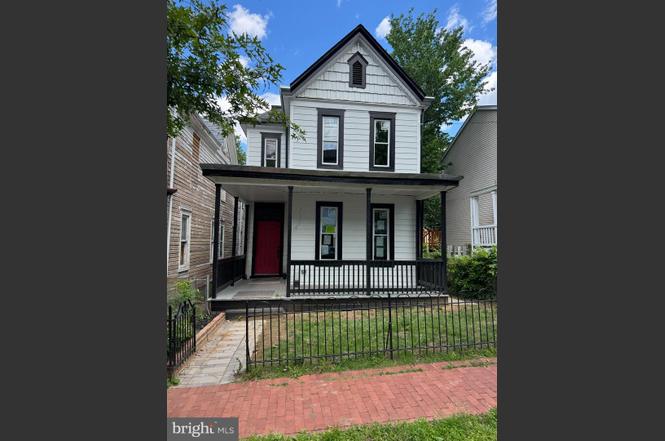
1358 Valley Pl SE · Washington, DC
Flood risk 3/10 · Minor
- FEMA flood zone
- X (unshaded)
- Chance of flooding over 30 yrs
- 0.2%
- Est. flood insurance / yr
- $507 – $1,088
Fire risk 1/10 · Minimal
- Est. fire insurance / yr
- $631 – $1,173
Heat risk 7/10 · Major
- Hot days now (above 104°F)
- 7 days/yr
- Hot days in 30 yrs
- 15 days/yr
Wind risk 4/10 · Minor
- Chance of severe wind over 30 yrs
- 21.0%
Air-quality risk 4/10 · Minor
- Unhealthy air days now
- 4 days/yr
- Unhealthy air days in 30 yrs
- 5 days/yr
Risk factors via First Street. Map © Google.
Why this score? — see what drove the C- grade
The composite is a weighted blend of 9 inputs, each scored 0–100. Each bar is that input's sub-score; the figure is the points it added to the 100-point composite (weight × sub-score).
- ARV discount +15.0/15.0
- Cash flow +14.8/30.0
- DSCR +4.5/10.0
- 1% rule +4.1/10.0
- Livability +3.7/5.0
- Schools +3.6/10.0
- Rent growth +3.5/5.0
- Condition / age +2.5/5.0
- Appreciation +0.0/10.0
$300,000
🖨 Deal sheet (PDF) 📄 Offer letter ✓ Due diligence
Listing remarks
Auction Property. In Collaboration with Alex Cooper Auctioneers. List price is Opening Bid at The Online Only Auction Sale to Be Held on The Auctioneers Website – Bidding begins Thursday, June 25 and ends Tuesday, June 30, 2026 at 12:30 PM. Beautifully renovated Victorian-style detached home in historic Anacostia offering 3 bedrooms and 2.5 baths with approximately 1,364± sq ft above grade. This thoughtfully updated residence blends classic D. C. charm with modern finishes throughout. The main level features an open-concept layout with hardwood floors, a gourmet kitchen with quartz countertops, oversized island, white cabinetry, and stainless-steel appliances, along with a powd
Key facts
- Wood flooring
- Parking pad
- Oversized island
Tags
Property features AI
Exterior
- Parking: On-street parking; Off-street parking
- Utilities: Public water; Public sewer; 200+ amp electric service; Natural gas hot water
- Home design: Detached property; Effective remodel in 2022; Historic designation noted
- Construction: Built year reported by assessor; Foundation: Other; Above- and below-grade structures noted
- Exterior features: Wood fencing; No tidal water
Interior
- Kitchen: Built-in microwave; Dishwasher; Disposal; Icemaker; Refrigerator; Stainless steel appliances
- Bedrooms: Three bedrooms on the first upper level
- Flooring: Hardwood floors
- Bathrooms: Two full bathrooms (all upper levels); One half bathroom on the main level
- Heating & cooling: Hot water heating; Natural gas heating fuel; Central air conditioning (electric)
- Interior features: Open floor plan with combined dining and living areas; Gourmet kitchen; Master bath(s); Upgraded countertops; Wood floors; High walls and drywall
- Laundry & utility: Washer and dryer in unit on the main floor; Exhaust fan
Neighborhood map
What this means for you Summary
Snapshot
- This is a 3-bed/2.5-bath single-family listed at $300k.
Deal economics
- At list price, monthly cash flow is $85 ($1k/yr) — positive.
- The deal already cash-flows at list — no discount required.
- To meet the 1% rule (rent ≥ 1% of price), the offer needs to be $273k (8.9% below list).
- Recommended offer: $273k (9.0% below list) — sets the bar for market timing.
- Cap rate 6.6% vs local median 2.5% in Washington — top-decile yield for the area; either an underpriced asset or a hidden risk that comps aren't pricing in. Stress-test before assuming the spread holds.
Location & tenants
- Location reads 73/100 on livability (#1 in DC) — a middle-class / working-renter tenant base. Strengths: amenities A+, commute A+, employment A+; Watch: crime F, cost of living F.
- District Of Columbia Public Schools (urban): math 33% / reading 40% proficiency, ranked #8 of 32 in DC (top 25%) — families likely to look elsewhere, expect single-tenant / working-renter base with shorter leases; 65% free/reduced lunch — lower-income household profile, screen leases tightly.
- Zoned schools: Savoy Es (238 students, 0% FRL); Kramer Ms (203 students, 0% FRL); Anacostia Hs (287 students, 0% FRL) — zoned schools average 0% FRL vs 65% district-wide (65 pts lower); this property's tenant base skews higher-income than the district average.
- Market conditions: Rents rising (+3.9%/yr); 298 active listings in the ZIP; 40 comparable units currently listed for rent nearby; rentals at typical pace (median 22d on market — plan ~3-4 weeks tenant-placement turnaround); 1,737 units permitted in District of Columbia in 2024 (1,506 in 5+ unit buildings).
- At $2,732/mo this rent would consume 61% of the median local household income ($54k/yr) (locally 5148% of renters already pay >50% of income on rent) — very limited rent-growth headroom before tenants either downsize or default.
Forward outlook
- Local home prices are declining (-3.0%/yr); year-one equity from $2k of loan paydown is wiped out by about $9k of value loss. Plan a longer hold.
- District of Columbia County population projected at +50% by 2050 — long-run rental-demand tailwind backs the buy-and-hold thesis.
Negotiation context
- It's been on market 111 days — a 9% lower offer ($273k) is reasonable based on typical stale-listing flexibility.
- 12 sale attempts since 28y ago; this cycle's ask has dropped $250k (45%) from the opening price — seller is motivated, your offer sets the floor, not the list.
Risks & watch-outs
- Watch-outs: built in 1905 — expect roof / HVAC / electrical / plumbing capex.
- Climate carrying-cost: extreme-heat days projected 7→15/yr by 2055 (HVAC capex compounding) — expect insurance premiums to compound above CPI over the hold.
Questions for the listing agent
- It's been on market 111 days. Have you received any prior offers? Is the seller open to a 9% concession, seller financing, or rate buy-down credit?
- Built in 1905 — when were the roof, HVAC, electrical panel, plumbing, and water heater last replaced?
- Why hasn't it sold? Are there any deal-killer items the seller is aware of (foundation, flood, title, zoning, code violations)?
- Is there a deadline driving the sale (1031 exchange, divorce, estate, relocation)? That informs how much negotiation room exists.
- Crime grade is F in this area — have there been break-ins, vandalism, or insurance claims at this property in the last 3 years? What carrier currently insures it and at what premium?
- What's the average days-on-market for RENTAL listings here right now (not sales)? A rising rental-DOM trend means longer vacancies and softer asking-rent achievability than the comps imply.
- What's the recent tenant-quality profile in this submarket — average credit score on applications, eviction rate, late-payment / NSF rate, and stable-employment percentage? A property-management company in the area should have these aggregated.
- How much new for-sale + rental construction is in the pipeline within 1–3 miles? Heavy new supply typically softens prices + rents 12–24 months out; constrained supply supports both.
Investment metrics
- 1% rule
- 0.91% ✗
- Cap rate
- 6.63%
- Cash-on-cash
- 1.21%
- DSCR
- 1.05
- GRM
- 9.2
CMA / ARV
- ARV (on-the-fly)
- $368,280
- Comps found
- 5
Show comp detail 5 sales within ~0.75 mi
| Address | Dist | Beds/Ba | Sqft | Sold | Price | $/sf | Match |
|---|---|---|---|---|---|---|---|
| 1226 U St SE | 0.27mi | 3/1.0 | 1,477 (+8%) | 1mo | $290,000 | $196 | 67 |
| 1340 Valley Pl SE | 0.04mi | 3/1.5 | 1,444 (+6%) | 22mo | $535,000 | $370 | 66 |
| 1724 W St SE | 0.38mi | 4/2.5 (+1) | 1,479 (+8%) | 3mo | $400,000 | $270 | 61 |
| 2016 14th St SE | 0.20mi | 3/3.5 | 1,516 (+11%) | 13mo | $581,600 | $384 | 57 |
| 1253 Sumner Rd SE | 0.55mi | 3/2.0 | 1,296 (-5%) | 16mo | $280,000 | $216 | 50 |
Match score weights: distance 35% · size 25% · config 20% · recency 20%. Top-matched comps best support the ARV.
Projected returns pro-forma
-3.0% appreciation · 3.86% rent growth · sell at horizon
- IRR
- -13.4%
- Equity multiple
- 0.51×
- Total profit
- $-40,774
- Equity at exit
- $44,731
- IRR
- -3.2%
- Equity multiple
- 0.78×
- Total profit
- $-18,412
- Equity at exit
- $25,939
Cash invested: $84,000 (down + closing). Projections, not guarantees.
Landlord ↔ Tenant lean methodology
- Overall (CITY)
- 0 Strongly Tenant-Friendly
- State District of Columbia
- 12 Strongly Tenant-Friendly · D+43
- County
- — inherits STATE
- City Washington
- 0 Strongly Tenant-Friendly · D+43
ZIP-level market 20020
- Rents YoY
- 3.9%
- Active inventory
- 298
- Price-to-rent
- 9.2×
Monthly cashflow live
- Estimated rent
- $2,732 high interval (Pro) →
- Mortgage (P&I)
- −$1,573
- Tax est. 1.5%
- −$375 /mo · $4,500/yr
- Insurance
- −$125
- HOA
- −$0
- Vacancy / Maint / Mgmt
- −$574
- Net cashflow
- $85
Break-even live
Sensitivity live
| Price | -10% $292 | -5% $189 | +0% $85 | +5% $-19 | +10% $-122 |
|---|---|---|---|---|---|
| Rent | -10% $-131 | -5% $-23 | +0% $85 | +5% $193 | +10% $301 |
| Rate | -1.0pp $236 | -0.5pp $161 | base $85 | +0.5pp $7 | +1.0pp $-72 |
UW: 25.0% down · 7.5% · 30yr · 1.5% tax · 5.0% vac · 8.0% maint · 8.0% mgmt
Financing live
Cash to close
- Down payment
- $75,000
- Closing costs
- $9,000
- Reserves months
- —
- Total cash needed
- —
Loan-product check · same deal, 3 products live
Conventional
25% down · 7.5% · 30yr
- Down + closing
- —
- Monthly P&I
- —
- Monthly cashflow
- —
- DSCR
- —
- Eligible?
- —
Personal DTI + credit; lowest rate.
DSCR
20% down · 8.5% · 30yr
- Down + closing
- —
- Monthly P&I
- —
- Monthly cashflow
- —
- DSCR
- —
- Eligible?
- —
No personal income docs; deal must DSCR.
Hard money
10% down · 12.0% · 12mo
- Down + closing
- —
- Monthly P&I
- —
- Monthly cashflow
- —
- DSCR
- —
- Eligible?
- —
Short-term bridge; refi at stabilization.
Rent comps 40 comps
| Address | Beds | Baths | Sqft | Rent | $/sqft | DOM | Units | Dist |
|---|---|---|---|---|---|---|---|---|
| 2227 14th St SE Washington, DC | 3.0 | 1.0 | 1222 | $2,495 | $2.04 | 26d | 1 | 0.05mi |
| 1328 Morris Rd SE Washington, DC | 3.0 | 2.5 | 1372 | $3,250 | $2.37 | 19d | 1 | 0.16mi |
| 1351 Morris Rd SE Unit Upstairs Washington, DC | 3.0 | 2.0 | 1522 | $2,700 | $1.77 | 6d | 1 | 0.18mi |
| 1505 West St SE Unit 1 Washington, DC | 3.0 | 2.5 | 1632 | $3,300 | $2.02 | 0d | 1 | 0.19mi |
| 1430 V St SE Washington, DC | 3.0 | 2.0 | 1680 | $3,100 | $1.85 | 26d | 1 | 0.20mi |
| 1308 Talbert Ct SE Washington, DC | 3.0 | 2.5 | 1446 | $2,995 | $2.07 | 7d | 1 | 0.21mi |
| 1300 Dexter Ter SE Washington, DC | 2.0 | 1.5 | 1100 | $2,600 | $2.36 | 26d | 1 | 0.23mi |
| 1214 U St SE Washington, DC | 3.0 | 2.5 | 1350 | $3,375 | $2.50 | 26d | 1 | 0.26mi |
| 2322 Shannon Pl SE Washington, DC | 3.0 | 3.5 | 1800 | $2,800 | $1.56 | 26d | 1 | 0.30mi |
| 2648 Bowen Rd SE Washington, DC | 3.0 | 1.5 | 1220 | $2,500 | $2.05 | 26d | 1 | 0.31mi |
| 1516 Marion Barry Ave SE Unit 301 Washington, DC | 3.0 | 2.0 | 1100 | $1,795 | $1.63 | 9d | 1 | 0.32mi |
| 1527 Morris Rd SE Washington, DC | 3.0 | 2.5 | 1508 | $2,700 | $1.79 | 9d | 1 | 0.36mi |
| 2501 Sayles Pl SE #9 Washington, DC | 2.0 | 2.0 | 1157 | $2,500 | $2.16 | 26d | 1 | 0.36mi |
| 2501 Sayles Pl SE #9 Washington, DC | 2.0 | 2.0 | 1157 | $2,500 | $2.16 | 12d | 1 | 0.36mi |
| 1802 14th St SE Washington, DC | 3.0 | 2.0 | 1800 | $2,800 | $1.56 | 26d | 1 | 0.36mi |
| 1705 W St SE Washington, DC | 4.0 | 2.0 | 1550 | $2,500 | $1.61 | 4d | 1 | 0.37mi |
| 1750 Galen St SE Washington, DC | 3.0 | 3.0 | 1138 | $2,300 | $2.02 | 5d | 1 | 0.39mi |
| 2629 Douglass Rd SE Washington, DC | 2.0–3.0 | 1.0–1.5 | 888 | $2,245 | $2.53 | 3d | 13 | 0.43mi |
| 2609 Douglass Rd SE #402 Washington, DC | 2.0 | 2.0 | 990 | $2,200 | $2.22 | 26d | 1 | 0.51mi |
| 1953 19th Pl SE Apt 301 Washington, DC | 3.0 | 1.0 | 980 | $5,301 | $5.41 | 26d | 1 | 0.52mi |
| 1953 19th Pl SE Apt 104 Washington, DC | 3.0 | 1.0 | 980 | $2,800 | $2.86 | 7d | 1 | 0.52mi |
| 1634 Ridge Pl SE Washington, DC | 3.0 | 3.5 | 1248 | $3,200 | $2.56 | 26d | 1 | 0.52mi |
| 1621 R St SE Washington, DC | 3.0 | 2.0 | 1250 | $24,000 | $19.20 | 0d | 1 | 0.53mi |
| 1907 Marion Barry Ave SE Washington, DC | 2.0 | 1.0 | 900 | $1,495 | $1.66 | 26d | 1 | 0.55mi |
| 2460 James Bank Rd SE Washington, DC | 3.0 | 3.5 | 1687 | $3,190 | $1.89 | 16d | 1 | 0.56mi |
| 1612 Q St SE Washington, DC | 3.0 | 2.0 | 1737 | $2,850 | $1.64 | 0d | 1 | 0.62mi |
| 2202 U Pl SE Washington, DC | 2.0 | 1.5 | 1232 | $3,500 | $2.84 | 26d | 1 | 0.63mi |
| 650 Howard Rd SE Washington, DC | 3.0 | 1.0–2.0 | 852 | $4,431 | $5.20 | 0d | 54 | 0.70mi |
| 2300 Good Hope Rd SE Washington, DC | 2.0 | 1.0–2.0 | 1020 | $1,913 | $1.88 | 26d | 6 | 0.71mi |
| 1938 S St SE Washington, DC | 3.0 | 2.0 | 1522 | $2,999 | $1.97 | 26d | 1 | 0.72mi |
| 632 Howard Rd SE Unit 532 Washington, DC | 2.0 | 2.0 | 942 | $3,862 | $4.10 | 19d | 1 | 0.76mi |
| 632 Howard Rd SE Unit 338 Washington, DC | 2.0 | 2.0 | 926 | $3,862 | $4.17 | 18d | 1 | 0.76mi |
| 632 Howard Rd SE Washington, DC | 2.0 | 1.0–2.0 | 673 | $4,100 | $6.09 | 22d | 112 | 0.76mi |
| 632 Howard Rd SE Unit 633 Washington, DC | 2.0 | 2.0 | 942 | $3,862 | $4.10 | 21d | 1 | 0.76mi |
| 632 Howard Rd SE Unit 933 Washington, DC | 2.0 | 2.0 | 942 | $3,862 | $4.10 | 23d | 1 | 0.76mi |
| 600 Howard Rd SE Washington, DC | 2.0 | 1.0–2.5 | 805 | $6,344 | $7.88 | 3d | 89 | 0.76mi |
| 1928 Naylor Rd SE Unit 102 Washington, DC | 2.0 | 2.0 | 875 | $1,482 | $1.69 | 0d | 1 | 0.88mi |
| 1928 Naylor Rd SE Unit 503 Washington, DC | 2.0 | 2.0 | 877 | $1,595 | $1.82 | 0d | 1 | 0.88mi |
| 2215 Minnesota Ave SE Unit 18 Washington, DC | 4.0 | 2.0 | 990 | $4,500 | $4.55 | 26d | 1 | 0.91mi |
| 1955 Fairlawn Ave SE Unit 2A Washington, DC | 2.0 | 2.0 | 1000 | $2,499 | $2.50 | 26d | 1 | 0.92mi |
Listing history 50 events
-
2026-06-21days on market $300,000 Active 111 DOM
-
2026-06-18days on market $300,000 Active 108 DOM
-
2026-06-17days on market $300,000 Active 107 DOM
-
2026-06-16days on market $300,000 Active 106 DOM
-
2026-06-15days on market $300,000 Active 105 DOM
-
2026-06-13days on market $300,000 Active 103 DOM
-
2026-06-09days on market $300,000 Active 99 DOM
-
2026-06-08days on market $300,000 Active 98 DOM
-
2026-06-07days on market $300,000 Active 97 DOM
-
2026-06-04days on market $300,000 Active 94 DOM
-
2026-06-03days on market $300,000 Active 93 DOM
-
2026-06-02days on market $300,000 Active 92 DOM
-
2026-06-01days on market $300,000 Active 91 DOM
-
2026-05-31days on market $300,000 Active 90 DOM
-
2026-05-04price $300,000
-
2026-03-02$549,900 Active
-
2026-03-02historical
-
2026-02-22price $559,900
-
2026-02-22status Active
-
2026-01-29historical
-
2025-11-26price $300,000
-
2025-09-08price $559,900
-
2025-08-09status Active
-
2025-08-04historical Active Under Contract
-
2025-07-02$579,888 Active
-
2025-06-04historical
-
2025-01-30historical
-
2025-01-29status Active
-
2025-01-27historical Active Under Contract
-
2025-01-03status Active
-
2024-12-31historical
-
2024-11-07price $579,900
-
2024-10-14price $584,900
-
2024-07-31price $594,900
-
2024-06-04$599,900 Active
-
2023-03-10historical
-
2023-01-05$579,900 Active
-
2023-01-05historical
-
2023-01-03historical
-
2022-12-09$599,000 Active
-
2022-12-06historical
-
2022-11-04price $599,000
-
2022-10-15$619,000 Active
-
2022-05-17soldstatus $300,000
-
2022-05-13soldstatus $300,000 Closed
-
2022-04-24$375,000
-
2022-04-24price $375,000
-
2022-04-24historical
-
1998-12-31soldstatus $100,000
-
1998-12-30soldstatus $100,000
ⓘ Source: listings_history table (triggers on properties + properties_extension) + one-shot
backfill from property_details.listing_events for pre-trigger history.
Climate risk First Street
- Flood 3/10 Moderate FEMA zone X (unshaded) · 20% chance over 30 yrs
- Wildfire 1/10 Low
- Heat 7/10 Severe 7 d/yr ≥104°F today · 15 d/yr by 30 yrs out
- Wind 4/10 Moderate 21% chance of damaging wind over 30 yrs
- Air quality 4/10 Moderate 4 unhealthy d/yr today · 5 by 30 yrs out
Nearby sold comps map
Loading sold comps map…
Walkable amenities ~0.75 mi
Loading nearby amenities…
Taxation est. · year 1
- Rental income
- $32,783
- − Mortgage interest
- −$16,805
- − Property taxes
- −$4,500
- − Insurance
- −$1,500
- − Repairs & maintenance
- −$2,623
- − Management
- −$2,623
- − Depreciation
- −$8,727
- Taxable loss
- −$3,994
- Est. tax savings @ 24.0%
- +$959
- After-tax cash flow
- $1,978/yr
For passive investors: Depreciation is non-cash, so a rental often shows a tax loss while cash-flowing — sheltering income. Rental losses are passive: they offset passive income freely, and up to $25,000/yr can offset ordinary (W-2) income if you actively participate and your MAGI is under $100k (phasing out to $0 by $150k); unused losses carry forward. On sale, claimed depreciation is recaptured at up to 25%, and gains may owe capital-gains tax (a 1031 exchange can defer both). Figures are a year-1 estimate at your 24.0% rate — not tax advice; consult a CPA.
Schools (NCES district)
- District
- District Of Columbia Public Schools
- NCES district ID
- 1100030
- Math proficiency
- 33% ▲ 3.00%
- Reading proficiency
- 40% ▲ 5.00%
- Median HH income
- $67,671
- Composite
- 35.84/100
- National rank
- #9606
- State rank
- #8 of 32 in DC
Livability — Washington
- Score
- 73/100
- State rank
- #1
- US rank
- #5327
Category grades
Schools grade is shown separately in the Schools card above.
Census & demographics
- Census place
- Washington, DC
- County
- District of Columbia · 671,873 people
- City population
- 671,873
- Metro
- Washington-Arlington-Alexandria, DC-VA-MD-WV
- Population (ZIP)
- 53,005
- Household income
- $54,032
- Rent vs Own
- Severe rent burden
- 5148.0
Population outlook (District of Columbia County) Hauer SSP2
- Today (2025)
- 821,926 people
- By 2030
- 899,517 · +9.4%
- By 2040
- 1,061,162 · +29.1%
- By 2050
- 1,231,493 · +49.8%
- By 2075
- 1,603,312 · +95.1%
- By 2100
- 1,847,141 · +124.7%
Race, ethnicity, and origin ACS 2023
- Neighborhood character
- Predominantly Black (90%)
- Race & ethnicity
- Black 90% Two or more races 3% Hispanic / Latino 3% White 3%
- Common ancestry
- Lithuanian 1%
- Foreign-born
- 3% · Canada
- Languages at home
- 95% English-only · Spanish 2% French/Haitian/Cajun 1%
Political lean MEDSL · District of Columbia
- 2024 margin
- Solid D (+86.1) · D 91.2% · R 5.1% · Other 3.8%
- 2008→2024 swing
- +0.1pp no change · 2008: 85.9pp · 2024: 86.1pp
- All cycles
- 2024: D+86.1 2020: D+86.8 2016: D+88.7 2012: D+84.2 2008: D+85.9
Not yet ingested
- Civics
- —
Market trends
- HPI YoY
- ▼ -415.44%
- Current HPI
- 306.5068
- Rent YoY
- ▲ 3.86%
- Metro
- Washington-Arlington-Alexandria, DC-VA-MD-WV
- State GDP YoY
- ▲ 1.33%
- F500 in state
- 6
Industry mix (Fortune 500 HQ in DC)
| Industry | F500 HQs | Revenue |
|---|---|---|
| Financial Services | 1 | $153B |
|
||
| Life Sciences / Industrials | 1 | $25B |
|
||
| Industrial Machinery | 1 | $8B |
|
||
Price history
+837.5% since first listed39 events — show timeline
- 2026-05-04 Price Changed $300,000 BRIGHT MLS
- 2026-03-02 Listing Removed — BRIGHT MLS
- 2026-03-02 Listed $549,900 BRIGHT MLS
- 2026-02-22 Price Changed $559,900 BRIGHT MLS
- 2026-02-22 Relisted — BRIGHT MLS
- 2026-01-29 Listing Removed — BRIGHT MLS
- 2025-11-26 Price Changed $300,000 BRIGHT MLS
- 2025-09-08 Price Changed $559,900 BRIGHT MLS
- 2025-08-09 Relisted — BRIGHT MLS
- 2025-08-04 Contingent — BRIGHT MLS
- 2025-07-02 Listed $579,888 BRIGHT MLS
- 2025-06-04 Coming Soon — BRIGHT MLS
- 2025-01-30 Listing Removed — BRIGHT MLS
- 2025-01-29 Relisted — BRIGHT MLS
- 2025-01-27 Contingent — BRIGHT MLS
- 2025-01-03 Relisted — BRIGHT MLS
- 2024-12-31 Listing Removed — BRIGHT MLS
- 2024-11-07 Price Changed $579,900 BRIGHT MLS
- 2024-10-14 Price Changed $584,900 BRIGHT MLS
- 2024-07-31 Price Changed $594,900 BRIGHT MLS
- 2024-06-04 Listed $599,900 BRIGHT MLS
- 2023-03-10 Listing Removed — BRIGHT MLS
- 2023-01-05 Listed $579,900 BRIGHT MLS
- 2023-01-05 Coming Soon — BRIGHT MLS
- 2023-01-03 Listing Removed — BRIGHT MLS
- 2022-12-09 Listed $599,000 BRIGHT MLS
- 2022-12-06 Listing Removed — BRIGHT MLS
- 2022-11-04 Price Changed $599,000 BRIGHT MLS
- 2022-10-15 Listed $619,000 BRIGHT MLS
- 2022-05-17 Sold (Public Records) $300,000 Public Records
- 2022-05-13 Sold (MLS) $300,000 BRIGHT MLS
- 2022-04-24 Listing Removed — BRIGHT MLS
- 2022-04-24 Price Changed $375,000 BRIGHT MLS
- 2022-04-24 Listed $375,000 BRIGHT MLS
- 1998-12-31 Sold (Public Records) $100,000 Public Records
- 1998-12-30 Sold (MLS) $100,000 MRIS
- 1998-10-15 Delisted — MRIS
- 1998-07-19 Listed $99,999 MRIS
- 1977-08-02 Sold (Public Records) $32,000 Public Records
Property tax history
+28.2%/yrLatest (2025): $31,458 · +1.7% YoY. Source: county tax records.
Cash-flow waterfall
monthlySold comps — $/sqft
last 12 mo · ≤1 miLoading sold comps…