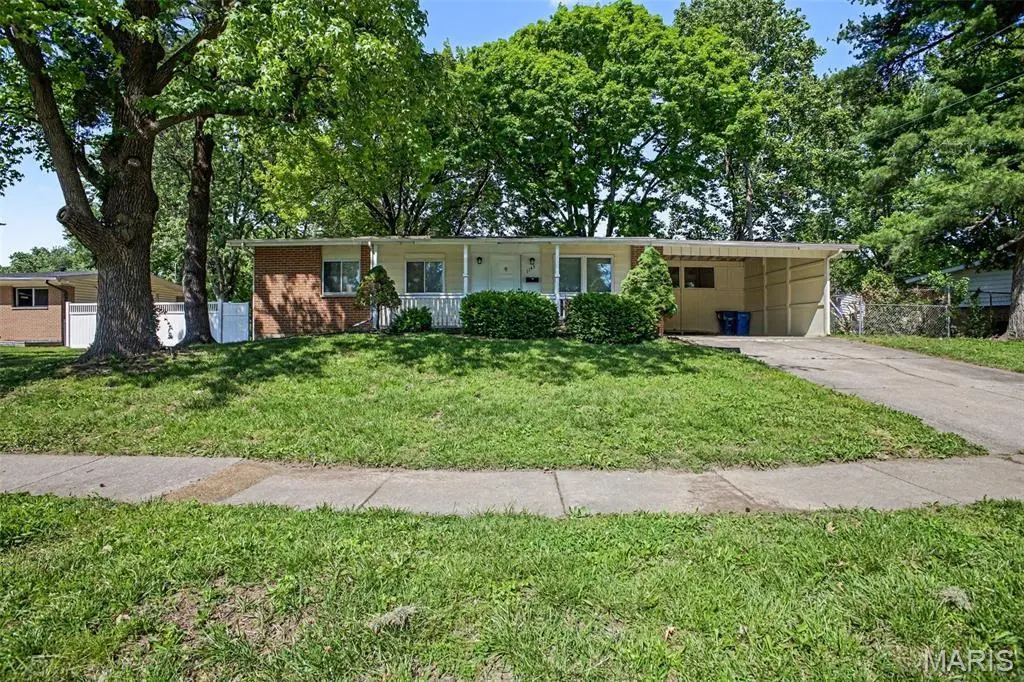
1145 Cheyenne Dr · Florissant, MO
Flood risk 1/10 · Minimal
- FEMA flood zone
- X (unshaded)
- Chance of flooding over 30 yrs
- 0.0%
- Est. flood insurance / yr
- $473 – $860
Fire risk 1/10 · Minimal
- Est. fire insurance / yr
- $1,054 – $1,958
Heat risk 5/10 · Moderate
- Hot days now (above 106°F)
- 7 days/yr
- Hot days in 30 yrs
- 21 days/yr
Wind risk 2/10 · Minimal
- Chance of severe wind over 30 yrs
- 1.0%
Air-quality risk 3/10 · Minor
- Unhealthy air days now
- 3 days/yr
- Unhealthy air days in 30 yrs
- 5 days/yr
Risk factors via First Street. Map © Google.
Why this score? — see what drove the C- grade
The composite is a weighted blend of 9 inputs, each scored 0–100. Each bar is that input's sub-score; the figure is the points it added to the 100-point composite (weight × sub-score).
- Cash flow +18.3/30.0
- Appreciation +10.0/10.0
- DSCR +5.8/10.0
- 1% rule +4.4/10.0
- Rent growth +4.4/5.0
- Livability +3.7/5.0
- Condition / age +2.5/5.0
- ARV discount +1.3/15.0
- Schools +1.2/10.0
$169,900
🖨 Deal sheet 📄 Offer letter ✓ Due diligence
Listing remarks MLS
Your search is over!!! Cozy 3 bed, 2 bathroom Florissant home ready for it's new owner and it should be you. This ranch home features vaulted ceilings, a screened in porch taking you from the large and open eat it kitchen, to the covered parking, big enough for 2 SUVs. In the finished basement you'll find a bonus room that could be used for an office or 4th bedroom as well as a rec area for that man cave or play area for for the kids Seller financing with $20,000 down with principal & interest payments of $1,228 a month. 30 year loan at 10% interest. 3bed 2 bath in Florissant is waiting for you to call it home.
Key facts
- 8,398 sq ft lot
- 2 parking spots
- Built 1960
Property features AI
Finance
- Financial info: Lease not considered
Exterior
- Parking: Covered carport (2 spaces)
- Utilities: Public water; Public sewer; Electricity available
- Home design: Single-family residence; One story
- Construction: Vinyl siding; Composition/shingle roof; Full basement
- Exterior features: Patio; Porch; Exterior lighting; Rain gutters; Asphalt road frontage on a city street; Lot dimensions approximately 59 x 95 x 117 x 152
Interior
- Kitchen: Convection oven; Gas water heater
- Bedrooms: Three bedrooms on the main level (sizes: 12 x 14, 10 x 10, 10 x 10)
- Flooring: Carpet
- Bathrooms: One full bathroom and one half bathroom (both on the main level)
- Heating & cooling: Forced-air heating (natural gas); Central electric air conditioning
- Interior features: Ceiling fans
Neighborhood map
What this means for you Summary
Snapshot
- This is a 3-bed/1.5-bath single-family listed at $170k.
Deal economics
- At list price, monthly cash flow is $157 ($2k/yr) — positive.
- The deal already cash-flows at list — no discount required.
- To meet the 1% rule (rent ≥ 1% of price), the offer needs to be $160k (5.9% below list).
- Recommended offer: $160k (5.9% below list) — sets the bar for 1% rule.
Location & tenants
- Location reads 73/100 on livability (#82 in MO) — a middle-class / working-renter tenant base. Strengths: cost of living A+, housing A+, health & safety B+; Watch: crime C-, amenities D+, commute F.
- Ferguson-Florissant R-II (suburban): math 7% / reading 20% proficiency, ranked #311 of 324 in MO (top 96%) — low school quality limits family demand, transient renter base, plan for 1-2y turnover; 70% free/reduced lunch — lower-income household profile, screen leases tightly.
- Zoned schools: Mccluer North High (math 5% / reading 28%, grade F, #487 of 521 statewide, top 93%, 1,136 students, 100% FRL) — zoned schools average 100% FRL vs 70% district-wide (30 pts higher); higher-poverty schools than district average — tighter screening recommended.
- Market conditions: Rents rising fast (+7.5%/yr); 218 active listings in the ZIP; 38 comparable units currently listed for rent nearby; rentals at typical pace (median 24d on market — plan ~3-4 weeks tenant-placement turnaround); 920 units permitted in St. Louis County in 2024 (250 in 5+ unit buildings).
Forward outlook
- In year one you build about $18k of equity ($1k loan paydown + $17k appreciation (10.0% local appreciation)).
- At projected returns (10.0% appreciation + 7.5% rent growth), your $48k cash investment doubles in ~3 years — after that, you're playing with house money.
- By year 3, paydown + projected appreciation supports a ~$46k cash-out refi (75% LTV) — recoverable capital for the next deal without selling this one.
Negotiation context
- It's been on market 30 days — a 2% lower offer ($167k) is reasonable based on typical stale-listing flexibility.
- 3 sale attempts since 5y ago with the ask held roughly flat each time — persistent listings suggest the price (not the market) is what's stuck; bring a comps-based counter.
- Current owner paid $98k; list at $170k implies a 74% gain — meaningful room to come down on a strong offer.
Risks & watch-outs
- Climate carrying-cost: extreme-heat days projected 7→21/yr by 2055 (HVAC capex compounding) — expect insurance premiums to compound above CPI over the hold.
Questions for the listing agent
- Built in 1960 — when were the roof, HVAC, electrical panel, plumbing, and water heater last replaced?
- Is there a deadline driving the sale (1031 exchange, divorce, estate, relocation)? That informs how much negotiation room exists.
- Schools are D-rated, which usually means shorter tenancies and higher turnover. Who's the typical renter profile here, and what's been the actual vacancy rate?
- What's the average days-on-market for RENTAL listings here right now (not sales)? A rising rental-DOM trend means longer vacancies and softer asking-rent achievability than the comps imply.
- What's the recent tenant-quality profile in this submarket — average credit score on applications, eviction rate, late-payment / NSF rate, and stable-employment percentage? A property-management company in the area should have these aggregated.
- How much new for-sale + rental construction is in the pipeline within 1–3 miles? Heavy new supply typically softens prices + rents 12–24 months out; constrained supply supports both.
Investment metrics
- 1% rule
- 0.94% ✗
- Cap rate
- 7.40%
- Cash-on-cash
- 3.96%
- DSCR
- 1.18
- GRM
- 8.9
CMA / ARV
- ARV (on-the-fly)
- $149,240
- Comps found
- 12
Show comp detail 12 sales within ~0.75 mi
| Address | Dist | Beds/Ba | Sqft | Sold | Price | $/sf | Match |
|---|---|---|---|---|---|---|---|
| 1065 Cheyenne Dr | 0.11mi | 3/2.0 | 1,040 (-2%) | 3mo | $172,000 | $165 | 86 |
| 2740 Holiday Hill Dr | 0.19mi | 3/1.0 | 1,107 (+4%) | 3mo | $99,900 | $90 | 80 |
| 1125 Apache Dr | 0.07mi | 3/1.0 | 957 (-10%) | 1mo | $100,000 | $104 | 77 |
| 2505 Saint Catherine St | 0.47mi | 3/1.5 | 1,040 (-2%) | 5mo | $123,000 | $118 | 70 |
| 205 Lynn Meadows Ln | 0.48mi | 3/1.0 | 1,104 (+4%) | 1mo | $135,000 | $122 | 69 |
| 1145 S Waterford Dr | 0.31mi | 3/2.0 | 984 (-8%) | 4mo | $165,000 | $168 | 68 |
| 260 Saint Edward Ln | 0.52mi | 3/2.0 | 1,092 (+2%) | 3mo | $170,000 | $156 | 67 |
| 815 Robinwood Dr | 0.37mi | 3/1.0 | 1,148 (+8%) | 2mo | $179,900 | $157 | 66 |
| 355 Saint Eugene Ln | 0.61mi | 3/1.5 | 1,092 (+2%) | 6mo | $189,000 | $173 | 63 |
| 675 Pimlico Dr | 0.63mi | 3/1.0 | 1,064 (-0%) | 8mo | $149,000 | $140 | 62 |
| 1030 Robinwood Dr | 0.26mi | 3/2.0 | 1,196 (+12%) | 5mo | $135,000 | $113 | 61 |
| 2320 Allen Dr | 0.42mi | 3/2.0 | 1,197 (+12%) | 8mo | $145,000 | $121 | 51 |
Match score weights: distance 35% · size 25% · config 20% · recency 20%. Top-matched comps best support the ARV.
Projected returns pro-forma
10.0% appreciation · 7.51% rent growth · sell at horizon
- IRR
- 28.8%
- Equity multiple
- 3.31×
- Total profit
- $110,101
- Equity at exit
- $153,059
- IRR
- 26.4%
- Equity multiple
- 8.04×
- Total profit
- $334,763
- Equity at exit
- $330,078
Cash invested: $47,572 (down + closing). Projections, not guarantees.
Landlord ↔ Tenant lean methodology
- Overall (STATE)
- 81 Strongly Landlord-Friendly
- State Missouri
- 81 Strongly Landlord-Friendly · R+10
- County
- — inherits STATE
- City
- — inherits STATE
ZIP-level market 63033
- Home prices YoY
- 2.5%
- Rents YoY
- 7.5%
- Active inventory
- 218
- Price-to-rent
- 8.9×
Monthly cashflow live
- Estimated rent
- $1,599 high interval (Pro) →
- Mortgage (P&I)
- −$891
- Tax from tax record
- −$144 /mo · $1,731/yr
- Insurance
- −$71
- HOA
- −$0
- Vacancy / Maint / Mgmt
- −$336
- Net cashflow
- $157
Break-even live
UW: 25.0% down · 7.5% · 30yr · 1.5% tax · 5.0% vac · 8.0% maint · 8.0% mgmt
Financing live
Cash to close
- Down payment
- $42,475
- Closing costs
- $5,097
- Reserves months
- —
- Total cash needed
- —
Loan-product check · same deal, 3 products live
Conventional
25% down · 7.5% · 30yr
- Down + closing
- —
- Monthly P&I
- —
- Monthly cashflow
- —
- DSCR
- —
- Eligible?
- —
Personal DTI + credit; lowest rate.
DSCR
20% down · 8.5% · 30yr
- Down + closing
- —
- Monthly P&I
- —
- Monthly cashflow
- —
- DSCR
- —
- Eligible?
- —
No personal income docs; deal must DSCR.
Hard money
10% down · 12.0% · 12mo
- Down + closing
- —
- Monthly P&I
- —
- Monthly cashflow
- —
- DSCR
- —
- Eligible?
- —
Short-term bridge; refi at stabilization.
Rent comps 38 comps
| Address | Beds | Baths | Sqft | Rent | $/sqft | DOM | Units | Dist |
|---|---|---|---|---|---|---|---|---|
| 1095 Ozment Dr Florissant, MO | 3.0 | 2.0 | 984 | $1,461 | $1.48 | 24d | 1 | 0.38mi |
| 1050 Ozment Dr Florissant, MO | 3.0 | 2.0 | 984 | $1,525 | $1.55 | 44d | 1 | 0.40mi |
| 790 Pebble Ln Florissant, MO | 3.0 | 2.0 | 1242 | $1,795 | $1.45 | 24d | 1 | 0.41mi |
| 1670 Arundel Dr Florissant, MO | 3.0 | 2.0 | 1012 | $1,450 | $1.43 | 24d | 1 | 0.43mi |
| 765 Bobbins Ln Florissant, MO | 3.0 | 1.0 | 1107 | $1,450 | $1.31 | 44d | 1 | 0.44mi |
| 100 Taney Dr Florissant, MO | 3.0 | 1.0 | 1148 | $1,495 | $1.30 | 22d | 1 | 0.47mi |
| 410 Ridge Dr Florissant, MO | 3.0 | 2.0 | 1226 | $1,650 | $1.35 | 18d | 1 | 0.52mi |
| 560 Jamaica Pl Florissant, MO | 3.0 | 2.0 | 1350 | $1,653 | $1.22 | 44d | 1 | 0.58mi |
| 50 Lynn Meadows Ln Florissant, MO | 3.0 | 1.0 | 864 | $1,450 | $1.68 | 24d | 1 | 0.59mi |
| 297 Saint Eugene Ln Florissant, MO | 2.0 | 1.0 | 1100 | $1,100 | $1.00 | 44d | 1 | 0.67mi |
| 1502 Summer Run Dr #108 Florissant, MO | 2.0 | 1.5 | 922 | $1,200 | $1.30 | 24d | 1 | 0.72mi |
| 20 Saint Benedict Ln Florissant, MO | 3.0 | 1.5 | 1092 | $1,525 | $1.40 | 20d | 1 | 0.77mi |
| 1536 Springlet Ct #31 Florissant, MO | 3.0 | 2.5 | 1161 | $1,450 | $1.25 | 8d | 1 | 0.79mi |
| 1725 Saint Catherine St Florissant, MO | 3.0 | 1.0 | 1107 | $1,800 | $1.63 | 15d | 1 | 0.84mi |
| 1600 Washington St Florissant, MO | 3.0 | 1.5 | 1095 | $1,250 | $1.14 | 20d | 1 | 0.84mi |
| 3585 Pershall Rd Ferguson, MO | 2.0 | 2.0 | 1388 | $1,400 | $1.01 | 44d | 1 | 0.85mi |
| 1545 Washington St Florissant, MO | 3.0 | 1.5 | 1337 | $2,055 | $1.54 | 3d | 1 | 0.86mi |
| 3582 Pershall Rd Unit 3631 Ferguson, MO | 2.0 | 2.0 | 1500 | $1,295 | $0.86 | 44d | 1 | 0.90mi |
| 1465 W Duchesne Dr Florissant, MO | 3.0 | 1.0 | 896 | $1,500 | $1.67 | 44d | 1 | 0.95mi |
| 1250 S New Florissant Rd Florissant, MO | 2.0 | 1.0 | 1150 | $1,500 | $1.30 | 15d | 1 | 1.03mi |
| 1180 S New Florissant Rd Florissant, MO | 3.0 | 1.0 | 925 | $1,225 | $1.32 | 24d | 1 | 1.04mi |
| 1280 Saint Catherine St Florissant, MO | 3.0 | 1.0 | 1274 | $1,600 | $1.26 | 15d | 1 | 1.08mi |
| 24 Barto Dr Saint Louis, MO | 3.0 | 1.0 | 864 | $1,400 | $1.62 | 44d | 1 | 1.17mi |
| 1004 N New Florissant Rd Florissant, MO | 2.0 | 1.0 | 719 | $1,375 | $1.91 | 24d | 1 | 1.17mi |
| 1600 Horseshoe Dr Florissant, MO | 3.0 | 2.0 | 1314 | $1,550 | $1.18 | 44d | 1 | 1.17mi |
| 5 Santa Cruz Dr Florissant, MO | 2.0 | 1.0 | 1410 | $1,411 | $1.00 | 16d | 1 | 1.18mi |
| 1045 N New Florissant Rd Florissant, MO | 2.0 | 1.0 | 783 | $1,250 | $1.60 | 15d | 1 | 1.20mi |
| 36 Connolly Dr Saint Louis, MO | 3.0 | 1.0 | 1024 | $1,149 | $1.12 | 24d | 1 | 1.22mi |
| 11 Anistasia Dr Saint Louis, MO | 3.0 | 1.5 | 1120 | $1,345 | $1.20 | 24d | 1 | 1.26mi |
| 17 Valley Dr Florissant, MO | 2.0 | 2.0 | 1356 | $1,525 | $1.12 | 44d | 1 | 1.26mi |
| 221 Barto Dr Saint Louis, MO | 3.0 | 2.0 | 958 | $1,295 | $1.35 | 20d | 1 | 1.33mi |
| 1275 N Florissant Rd Saint Louis, MO | 2.0 | 1.0 | 1008 | $1,275 | $1.26 | 24d | 1 | 1.33mi |
| 107 Anistasia Dr Saint Louis, MO | 2.0 | 2.0 | 1030 | $1,400 | $1.36 | 24d | 1 | 1.37mi |
| 1785 Trotter Way Florissant, MO | 3.0 | 2.0 | 1297 | $1,806 | $1.39 | 8d | 1 | 1.37mi |
| 46 Bascom Dr Saint Louis, MO | 2.0 | 1.0 | 932 | $1,175 | $1.26 | 44d | 1 | 1.42mi |
| 2990 Santiago Dr Florissant, MO | 2.0 | 2.0 | 984 | $1,200 | $1.22 | 44d | 1 | 1.43mi |
| 220 Du Bourg Ln Florissant, MO | 2.0 | 1.0 | 816 | $1,150 | $1.41 | 44d | 1 | 1.44mi |
| 241 Flora Dr Saint Louis, MO | 2.0 | 1.0 | 703 | $1,075 | $1.53 | 24d | 1 | 1.49mi |
Listing history 25 events
-
2026-06-18days on market $169,900 Active 30 DOM
-
2026-06-17days on market $169,900 Active 29 DOM
-
2026-06-16days on market $169,900 Active 28 DOM
-
2026-06-15days on market $169,900 Active 27 DOM
-
2026-06-13days on market $169,900 Active 25 DOM
-
2026-06-13pricedays on market $169,900 Active 24 DOM
-
2026-06-09days on market $174,900 Active 21 DOM
-
2026-06-08days on market $174,900 Active 20 DOM
-
2026-06-07days on market $174,900 Active 19 DOM
-
2026-06-05days on market $174,900 Active 16 DOM
-
2026-06-03days on market $174,900 Active 15 DOM
-
2026-06-02days on market $174,900 Active 14 DOM
-
2026-06-01days on market $174,900 Active 13 DOM
-
2026-05-31days on market $174,900 Active 12 DOM
-
2026-05-19$174,900 Active
-
2024-02-29historical $1,585
-
2024-02-13$1,585
-
2022-05-19price $1,565
-
2021-10-20soldstatus $97,500
-
2021-10-08soldstatus Closed 622-char remark
Show marketing remark (622 chars)
Your search is over!!! Cozy 3 bed, 2 bathroom Florissant home ready for it's new owner and it should be you. This ranch home features vaulted ceilings, a screened in porch taking you from the large and open eat it kitchen, to the covered parking, big enough for 2 SUVs. In the finished basement you'll find a bonus room that could be used for an office or 4th bedroom as well as a rec area for that man cave or play area for for the kids Seller financing with $20,000 down with principal & interest payments of $1,228 a month. 30 year loan at 10% interest. 3bed 2 bath in Florissant is waiting for you to call it home.
-
2021-09-09status Pending 622-char remark
Show marketing remark (622 chars)
Your search is over!!! Cozy 3 bed, 2 bathroom Florissant home ready for it's new owner and it should be you. This ranch home features vaulted ceilings, a screened in porch taking you from the large and open eat it kitchen, to the covered parking, big enough for 2 SUVs. In the finished basement you'll find a bonus room that could be used for an office or 4th bedroom as well as a rec area for that man cave or play area for for the kids Seller financing with $20,000 down with principal & interest payments of $1,228 a month. 30 year loan at 10% interest. 3bed 2 bath in Florissant is waiting for you to call it home.
-
2021-08-31$160,000 Active 622-char remark
Show marketing remark (622 chars)
Your search is over!!! Cozy 3 bed, 2 bathroom Florissant home ready for it's new owner and it should be you. This ranch home features vaulted ceilings, a screened in porch taking you from the large and open eat it kitchen, to the covered parking, big enough for 2 SUVs. In the finished basement you'll find a bonus room that could be used for an office or 4th bedroom as well as a rec area for that man cave or play area for for the kids Seller financing with $20,000 down with principal & interest payments of $1,228 a month. 30 year loan at 10% interest. 3bed 2 bath in Florissant is waiting for you to call it home.
-
2019-08-12soldstatus $82,441
-
1997-07-14soldstatus $68,000
-
1960-12-01soldstatus
ⓘ Source: listings_history table (triggers on properties + properties_extension) + one-shot
backfill from property_details.listing_events for pre-trigger history.
Tax reassessment forecast MO · Resets to sale price
- Current annual tax
- $1,731 · $144/mo
- Projected year-2 tax
- $1,731 · $144/mo
- Expected delta
- $0/yr ($0/mo · 0.0%)
ⓘ Screening estimate from a state-policy table — verify with the county assessor before closing.
Climate risk First Street
- Flood 1/10 Low FEMA zone X (unshaded) · 0% chance over 30 yrs
- Wildfire 1/10 Low
- Heat 5/10 Major 7 d/yr ≥106°F today · 21 d/yr by 30 yrs out
- Wind 2/10 Low 100% chance of damaging wind over 30 yrs
- Air quality 3/10 Moderate 3 unhealthy d/yr today · 5 by 30 yrs out
Nearby sold comps map
Loading sold comps map…
Walkable amenities ~0.75 mi
Loading nearby amenities…
Taxation est. · year 1
- Rental income
- $19,186
- − Mortgage interest
- −$9,517
- − Property taxes
- −$1,731
- − Insurance
- −$850
- − Repairs & maintenance
- −$1,535
- − Management
- −$1,535
- − Depreciation
- −$4,943
- Taxable loss
- −$924
- Est. tax savings @ 24.0%
- +$222
- After-tax cash flow
- $2,106/yr
For passive investors: Depreciation is non-cash, so a rental often shows a tax loss while cash-flowing — sheltering income. Rental losses are passive: they offset passive income freely, and up to $25,000/yr can offset ordinary (W-2) income if you actively participate and your MAGI is under $100k (phasing out to $0 by $150k); unused losses carry forward. On sale, claimed depreciation is recaptured at up to 25%, and gains may owe capital-gains tax (a 1031 exchange can defer both). Figures are a year-1 estimate at your 24.0% rate — not tax advice; consult a CPA.
Schools (NCES district)
- District
- Ferguson-Florissant R-II
- NCES district ID
- 2912010
- Math proficiency
- 7% ▼ -9.00%
- Reading proficiency
- 20% ▼ -6.00%
- Median HH income
- $44,610
- Composite
- 11.96/100
- National rank
- #9666
- State rank
- #311 of 324 in MO
Livability — Florissant
- Score
- 73/100
- State rank
- #82
- US rank
- #5406
Category grades
Schools grade is shown separately in the Schools card above.
Census & demographics
- Census place
- Florissant, MO
- County
- Saint Louis County · 888,823 people
- City population
- 69,104
- Metro
- St. Louis, MO-IL
- Population (ZIP)
- 43,056
- Household income
- $66,776
- Rent vs Own
- Severe rent burden
- 1429.0
Population outlook (St. Louis County) Hauer SSP2
- Today (2025)
- 1,025,227 people
- By 2030
- 1,028,023 · +0.3%
- By 2040
- 1,020,940 · -0.4%
- By 2050
- 1,007,280 · -1.8%
- By 2075
- 987,277 · -3.7%
- By 2100
- 921,984 · -10.1%
Race, ethnicity, and origin ACS 2023
- Neighborhood character
- Predominantly Black (71%)
- Race & ethnicity
- Black 71% White 23% Two or more races 4% Hispanic / Latino 1%
- Common ancestry
- Romanian 1% Lithuanian 1% Italian 1%
- Foreign-born
- 3% · Canada, Vietnam
- Languages at home
- 95% English-only · Spanish 1% French/Haitian/Cajun 1%
Political lean MEDSL · St. Louis
- 2024 margin
- Strong D (+23.4) · D 60.8% · R 37.4% · Other 1.7%
- 2008→2024 swing
- +3.5pp toward D · 2008: 19.9pp · 2024: 23.4pp
- All cycles
- 2024: D+23.4 2020: D+24.0 2016: D+16.2 2012: D+13.7 2008: D+19.9
Not yet ingested
- Civics
- —
Market trends
- HPI YoY
- ▲ 13.78%
- Current HPI
- 570.6
- Rent YoY
- ▲ 7.51%
- Metro
- St. Louis, MO-IL
- State GDP YoY
- ▲ 1.84%
- F500 in state
- 20
Industry mix (Fortune 500 HQ in MO)
| Industry | F500 HQs | Revenue |
|---|---|---|
| Healthcare | 1 | $163B |
|
||
| Insurance | 1 | $21B |
|
||
| Industrial Technology | 1 | $17B |
|
||
| Retail | 1 | $16B |
|
||
| Industrial Distribution | 1 | $10B |
|
||
| Utilities | 1 | $9B |
|
||
Price history
+157.2% since first listed11 events — show timeline
- 2026-05-19 Listed $174,900 MARIS as Distributed by MLS Grid
- 2024-02-29 Rental Removed $1,585 RENTLY
- 2024-02-13 Listed for Rent $1,585 RENTLY
- 2022-05-19 Price Changed $1,565 RENT.
- 2021-10-20 Sold (Public Records) $97,500 Public Records
- 2021-10-08 Sold (MLS) — MARIS as Distributed by MLS Grid
- 2021-09-09 Pending — MARIS as Distributed by MLS Grid
- 2021-08-31 Listed $160,000 MARIS as Distributed by MLS Grid
- 2019-08-12 Sold (Public Records) $82,441 Public Records
- 1997-07-14 Sold (Public Records) $68,000 Public Records
- 1960-12-01 Sold (Public Records) — Public Records
Property tax history
+1.1%/yrLatest (2022): $1,731 · +1.7% YoY. Source: county tax records.
Cash-flow waterfall
monthlySold comps — $/sqft
last 12 mo · ≤1 miLoading sold comps…