 🏗️ New Construction
817 Division St · Indianapolis city (balance), IN
Flood risk 4/10 · Minor
- FEMA flood zone
- X
- Chance of flooding over 30 yrs
- 0.24%
- Est. flood insurance / yr
- $507 – $1,088
Fire risk 1/10 · Minimal
- Est. fire insurance / yr
- $717 – $1,331
Heat risk 4/10 · Minor
- Hot days now (above 101°F)
- 7 days/yr
- Hot days in 30 yrs
- 19 days/yr
Wind risk 2/10 · Minimal
- Chance of severe wind over 30 yrs
- —
Air-quality risk 4/10 · Minor
- Unhealthy air days now
- 5 days/yr
- Unhealthy air days in 30 yrs
- 7 days/yr
Risk factors via First Street. Map © Google.
Why this score? — see what drove the C+ grade
The composite is a weighted blend of 9 inputs, each scored 0–100. Each bar is that input's sub-score; the figure is the points it added to the 100-point composite (weight × sub-score).
- Cash flow +27.6/30.0
- DSCR +9.7/10.0
- 1% rule +8.5/10.0
- ARV discount +7.5/15.0
- Rent growth +2.9/5.0
- Livability +2.5/5.0
- Condition / age +2.5/5.0
- Schools +1.4/10.0
- Appreciation +0.0/10.0
$164,900
🖨 Deal sheet 📄 Offer letter ✓ Due diligence
Listing remarks
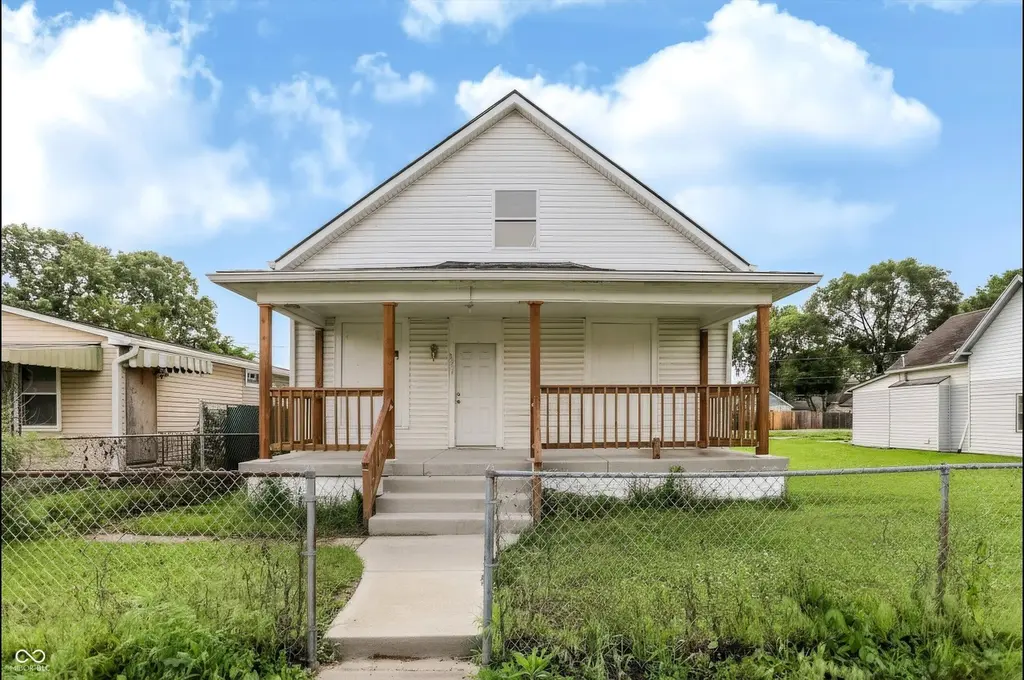
817 Division St is a classic 1940s single-family home in Indianapolis offering 2,544 sq ft of space, 4 bedrooms, and 2 baths. Featuring a brand new covered front porch with cedar beams, a detached 2-car garage, and several rooms with hardwood floors, it's a promising fixer-upper for investors or owner-occupants looking for proximity to downtown Indy! The home has brand new roof, garage, gas furnace and being sold "As-is!
Key facts
- Covered front porch
- Cedar beams
- Gas furnace
Tags
Property features AI
Exterior
- Parking: Detached 2-car garage (484 sq ft)
- Utilities: Public water; Municipal sewer connected; 200+ amp electric service; Electricity connected
- Home design: Single-family residence; Residential property under construction; Two levels
- Construction: Vinyl siding; Block foundation
- Exterior features: Covered patio/porch; Partial chain-link fence; Sidewalks; Has a view
Interior
- Kitchen: Eat-in kitchen
- Bedrooms: Four bedrooms total (one on the main level, three on the upper level)
- Flooring: Hardwood floors
- Bathrooms: Two full bathrooms (one on the main level, one on the upper level)
- Heating & cooling: Forced air heating; Central air conditioning
- Interior features: Attic access; Hardwood floors; Eat-in kitchen; Painted woodwork
- Laundry & utility: Washer/dryer hookups throughout (connections all)
Neighborhood map
What this means for you Summary
Snapshot
- This is a 3-bed/2.0-bath single-family listed at $165k.
Deal economics
- At list price, monthly cash flow is $587 ($7k/yr) — positive.
- The deal already cash-flows at list — no discount required.
- Meets the 1% rule at list price ($3k rent vs $165k).
- Recommended offer: $162k (1.5% below list) — sets the bar for market timing.
- Cap rate 9.9% vs local median 4.4% in Indianapolis city (balance) — top-decile yield for the area; either an underpriced asset or a hidden risk that comps aren't pricing in. Stress-test before assuming the spread holds.
Location & tenants
- Location reads: area grade C — affects rentability + tenant quality, not the cash-flow math above.
- Indianapolis Public Schools (urban): math 14% / reading 20% proficiency, ranked #286 of 301 in IN (top 95%) — low school quality limits family demand, transient renter base, plan for 1-2y turnover; 77% free/reduced lunch — lower-income household profile, screen leases tightly.
- Market conditions: Rents rising (+1.8%/yr); 43 active listings in the ZIP; 6 comparable units currently listed for rent nearby; rentals at typical pace (median 24d on market — plan ~3-4 weeks tenant-placement turnaround); 1,906 units permitted in Marion County in 2024 (621 in 5+ unit buildings).
- At $2,652/mo this rent would consume 49% of the median local household income ($65k/yr) (locally 1011% of renters already pay >50% of income on rent) — very limited rent-growth headroom before tenants either downsize or default.
Forward outlook
- Local home prices are declining (-3.0%/yr); year-one equity from $1k of loan paydown is wiped out by about $6k of value loss. Plan a longer hold.
- Marion County population projected at +18% by 2050 — long-run rental-demand tailwind backs the buy-and-hold thesis.
Negotiation context
- It's been on market 28 days — a 2% lower offer ($162k) is reasonable based on typical stale-listing flexibility.
- 2 sale attempts since 4y ago; this cycle's ask has dropped $10k (6%) from the opening price — seller is motivated, your offer sets the floor, not the list.
Risks & watch-outs
- Watch-outs: property tax is 2.9% of price; built in 1940 — expect roof / HVAC / electrical / plumbing capex.
Questions for the listing agent
- Built in 1940 — when were the roof, HVAC, electrical panel, plumbing, and water heater last replaced?
- Property tax is high relative to price — has the assessment been appealed recently, and will the sale trigger a re-assessment?
- Is there a deadline driving the sale (1031 exchange, divorce, estate, relocation)? That informs how much negotiation room exists.
- What's the average days-on-market for RENTAL listings here right now (not sales)? A rising rental-DOM trend means longer vacancies and softer asking-rent achievability than the comps imply.
- What's the recent tenant-quality profile in this submarket — average credit score on applications, eviction rate, late-payment / NSF rate, and stable-employment percentage? A property-management company in the area should have these aggregated.
- How much new for-sale + rental construction is in the pipeline within 1–3 miles? Heavy new supply typically softens prices + rents 12–24 months out; constrained supply supports both.
Investment metrics
- 1% rule
- 1.35% ✓
- Cap rate
- 9.89%
- Cash-on-cash
- 12.85%
- DSCR
- 1.57
- GRM
- 6.2
CMA / ARV
- ARV (on-the-fly)
- $195,888
- Comps found
- 5
Show comp detail 5 sales within ~0.75 mi
| Address | Dist | Beds/Ba | Sqft | Sold | Price | $/sf | Match |
|---|---|---|---|---|---|---|---|
| 642 Division St | 0.08mi | 3/2.0 | 2,864 (+13%) | 8mo | $220,000 | $77 | 69 |
| 825 Birch Ave | 0.18mi | 4/2.0 (+1) | 2,352 (-8%) | 15mo | $186,000 | $79 | 62 |
| 1750 W Morris St | 0.60mi | 4/2.0 (+1) | 2,376 (-7%) | 5mo | $24,900 | $10 | 52 |
| 1321 W Oliver Ave | 0.15mi | 4/2.0 (+1) | 2,905 (+14%) | 23mo | $155,500 | $54 | 45 |
| 1349 S Reisner St | 0.67mi | 3/2.0 | 2,314 (-9%) | 18mo | $200,000 | $86 | 38 |
Match score weights: distance 35% · size 25% · config 20% · recency 20%. Top-matched comps best support the ARV.
Projected returns pro-forma
-3.0% appreciation · 1.79% rent growth · sell at horizon
- IRR
- 1.3%
- Equity multiple
- 1.05×
- Total profit
- $2,617
- Equity at exit
- $29,208
- IRR
- 9.6%
- Equity multiple
- 1.70×
- Total profit
- $38,228
- Equity at exit
- $16,937
Cash invested: $54,849 (down + closing). Projections, not guarantees.
Landlord ↔ Tenant lean methodology
- Overall (STATE)
- 90 Strongly Landlord-Friendly
- State Indiana
- 90 Strongly Landlord-Friendly · R+11
- County
- — inherits STATE
- City
- — inherits STATE
ZIP-level market 46221
- Home prices YoY
- -23.7%
- Rents YoY
- 1.8%
- Active inventory
- 43
- Price-to-rent
- 5.2×
Monthly cashflow live
- Estimated rent
- $2,652 medium interval (Pro) →
- Mortgage (P&I)
- −$1,027
- Tax from tax record
- −$398 /mo · $4,781/yr
- Insurance
- −$82
- HOA
- −$0
- Vacancy / Maint / Mgmt
- −$557
- Net cashflow
- $587
Break-even live
UW: 25.0% down · 7.5% · 30yr · 1.5% tax · 5.0% vac · 8.0% maint · 8.0% mgmt
Financing live
Cash to close
- Down payment
- $48,972
- Closing costs
- $5,877
- Reserves months
- —
- Total cash needed
- —
Loan-product check · same deal, 3 products live
Conventional
25% down · 7.5% · 30yr
- Down + closing
- —
- Monthly P&I
- —
- Monthly cashflow
- —
- DSCR
- —
- Eligible?
- —
Personal DTI + credit; lowest rate.
DSCR
20% down · 8.5% · 30yr
- Down + closing
- —
- Monthly P&I
- —
- Monthly cashflow
- —
- DSCR
- —
- Eligible?
- —
No personal income docs; deal must DSCR.
Hard money
10% down · 12.0% · 12mo
- Down + closing
- —
- Monthly P&I
- —
- Monthly cashflow
- —
- DSCR
- —
- Eligible?
- —
Short-term bridge; refi at stabilization.
Rent comps 6 comps
| Address | Beds | Baths | Sqft | Rent | $/sqft | DOM | Units | Dist |
|---|---|---|---|---|---|---|---|---|
| 1551 W New York St Indianapolis, IN | 3.0 | 2.0 | 2619 | $1,600 | $0.61 | 8d | 1 | 1.11mi |
| 261 N Pershing Ave Indianapolis, IN | 2.0 | 2.0 | 1764 | $1,600 | $0.91 | 24d | 1 | 1.29mi |
| 818 Union St Indianapolis, IN | 4.0 | 4.0 | 2624 | $3,900 | $1.49 | 24d | 1 | 1.34mi |
| 822 Union St Indianapolis, IN | 3.0 | 3.0 | 2384 | $3,700 | $1.55 | 24d | 1 | 1.34mi |
| 234 N Addison St Indianapolis, IN | 3.0 | 2.0 | 1892 | $1,900 | $1.00 | 44d | 1 | 1.45mi |
| 50 N Illinois St Unit 1534468P Indianapolis, IN | 1.0–5.0 | 1.5–4.0 | 1770 | $5,395 | $3.05 | 2d | 3 | 1.47mi |
Listing history 16 events
-
2026-06-18days on market $164,900 Active 28 DOM
-
2026-06-17days on market $164,900 Active 27 DOM
-
2026-06-16days on market $164,900 Active 26 DOM
-
2026-06-15days on market $164,900 Active 25 DOM
-
2026-06-13days on market $164,900 Active 23 DOM
-
2026-06-13pricedays on market $164,900 Active 22 DOM
-
2026-06-09days on market $175,000 Active 19 DOM
-
2026-06-08days on market $175,000 Active 18 DOM
-
2026-06-07days on market $175,000 Active 17 DOM
-
2026-06-03days on market $175,000 Active 13 DOM
-
2026-06-02days on market $175,000 Active 12 DOM
-
2026-06-01days on market $175,000 Active 11 DOM
-
2026-05-31days on market $175,000 Active 10 DOM
-
2026-05-21$175,000 Active
-
2022-12-31historical
-
2022-06-23$155,000 Active
ⓘ Source: listings_history table (triggers on properties + properties_extension) + one-shot
backfill from property_details.listing_events for pre-trigger history.
Tax reassessment forecast IN · Partial reset (capped growth)
- Current annual tax
- $4,781 · $398/mo
- Projected year-2 tax
- $4,781 · $398/mo
- Expected delta
- $0/yr ($0/mo · 0.0%)
ⓘ Screening estimate from a state-policy table — verify with the county assessor before closing.
Climate risk First Street
- Flood 4/10 Moderate FEMA zone X · 24% chance over 30 yrs
- Wildfire 1/10 Low
- Heat 4/10 Moderate 7 d/yr ≥101°F today · 19 d/yr by 30 yrs out
- Wind 2/10 Low
- Air quality 4/10 Moderate 5 unhealthy d/yr today · 7 by 30 yrs out
Nearby sold comps map
Loading sold comps map…
Walkable amenities ~0.75 mi
Loading nearby amenities…
Taxation est. · year 1
- Rental income
- $31,818
- − Mortgage interest
- −$10,973
- − Property taxes
- −$4,781
- − Insurance
- −$979
- − Repairs & maintenance
- −$2,545
- − Management
- −$2,545
- − Depreciation
- −$5,699
- Taxable income
- $4,296
- Est. tax owed @ 24.0%
- −$1,031
- After-tax cash flow
- $6,018/yr
For passive investors: Depreciation is non-cash, so a rental often shows a tax loss while cash-flowing — sheltering income. Rental losses are passive: they offset passive income freely, and up to $25,000/yr can offset ordinary (W-2) income if you actively participate and your MAGI is under $100k (phasing out to $0 by $150k); unused losses carry forward. On sale, claimed depreciation is recaptured at up to 25%, and gains may owe capital-gains tax (a 1031 exchange can defer both). Figures are a year-1 estimate at your 24.0% rate — not tax advice; consult a CPA.
Schools (NCES district)
- District
- Indianapolis Public Schools
- NCES district ID
- 1804770
- Math proficiency
- 14% ▼ -7.00%
- Reading proficiency
- 20% ▼ -3.00%
- Median HH income
- $32,034
- Composite
- 13.69/100
- National rank
- #9499
- State rank
- #286 of 301 in IN
Livability — Indianapolis city (balance)
No livability data for this city. (Only ~50 U.S. cities are tracked.)
Census & demographics
- Census place
- Indianapolis city (balance), IN
- County
- Marion County · 998,460 people
- City population
- 881,119
- Metro
- Indianapolis-Carmel-Anderson, IN
- Population (ZIP)
- 27,027
- Household income
- $65,280
- Rent vs Own
- Severe rent burden
- 1011.0
Population outlook (Marion County) Hauer SSP2
- Today (2025)
- 1,025,572 people
- By 2030
- 1,065,727 · +3.9%
- By 2040
- 1,141,577 · +11.3%
- By 2050
- 1,208,920 · +17.9%
- By 2075
- 1,367,288 · +33.3%
- By 2100
- 1,438,201 · +40.2%
Race, ethnicity, and origin ACS 2023
- Neighborhood character
- Predominantly White (69%)
- Race & ethnicity
- White 69% Black 13% Hispanic / Latino 13% Two or more races 7%
- Hispanic origin (detail)
- Mexican 7%
- Common ancestry
- Italian 2% Iranian 2% Lithuanian 2%
- Foreign-born
- 9% · Canada, China
- Languages at home
- 87% English-only · Spanish 9% Arabic 1%
Political lean MEDSL · Marion
- 2024 margin
- Strong D (+27.7) · D 63.0% · R 35.3% · Other 1.7%
- 2008→2024 swing
- -0.7pp no change · 2008: 28.4pp · 2024: 27.7pp
- All cycles
- 2024: D+27.7 2020: D+29.1 2016: D+22.8 2012: D+22.2 2008: D+28.4
Not yet ingested
- Civics
- —
Market trends
- HPI YoY
- ▼ -97.56%
- Current HPI
- 313.4711
- Rent YoY
- ▲ 1.79%
- Metro
- Indianapolis-Carmel-Anderson, IN
- State GDP YoY
- ▲ 2.90%
- F500 in state
- 18
Industry mix (Fortune 500 HQ in IN)
| Industry | F500 HQs | Revenue |
|---|---|---|
| Industrial Machinery | 2 | $37B |
|
||
| Healthcare | 1 | $177B |
|
||
| Pharmaceuticals | 1 | $45B |
|
||
| Metals / Steel | 1 | $18B |
|
||
| Agriculture | 1 | $17B |
|
||
| Packaging | 1 | $12B |
|
||
Price history
+12.9% since first listed3 events — show timeline
- 2026-05-21 Listed $175,000 MIBOR as Distributed by MLS Grid
- 2022-12-31 Listing Removed — MIBOR as Distributed by MLS Grid
- 2022-06-23 Listed $155,000 MIBOR as Distributed by MLS Grid
Property tax history
+11.2%/yrLatest (2025): $4,781 · +40.4% YoY. Source: county tax records.
Cash-flow waterfall
monthlySold comps — $/sqft
last 12 mo · ≤1 miLoading sold comps…