1250 Fry Rd · Marshall, AR
Flood risk 1/10 · Minimal
- FEMA flood zone
- —
- Chance of flooding over 30 yrs
- 0.0%
- Est. flood insurance / yr
- —
Fire risk 5/10 · Moderate
- Est. fire insurance / yr
- $1,499 – $2,785
Heat risk 4/10 · Minor
- Hot days now (above 105°F)
- 7 days/yr
- Hot days in 30 yrs
- 19 days/yr
Wind risk 2/10 · Minimal
- Chance of severe wind over 30 yrs
- 1.0%
Air-quality risk 1/10 · Minimal
- Unhealthy air days now
- 0 days/yr
- Unhealthy air days in 30 yrs
- 0 days/yr
Risk factors via First Street. Map © Google.
Why this score? — see what drove the C grade
The composite is a weighted blend of 9 inputs, each scored 0–100. Each bar is that input's sub-score; the figure is the points it added to the 100-point composite (weight × sub-score).
- Cash flow +20.2/30.0
- ARV discount +7.5/15.0
- DSCR +6.4/10.0
- 1% rule +5.3/10.0
- Appreciation +5.0/10.0
- Livability +3.3/5.0
- Schools +3.2/10.0
- Rent growth +2.5/5.0
- Condition / age +2.5/5.0
$78,000
🖨 Deal sheet (PDF) 📄 Offer letter ✓ Due diligence
Listing remarks
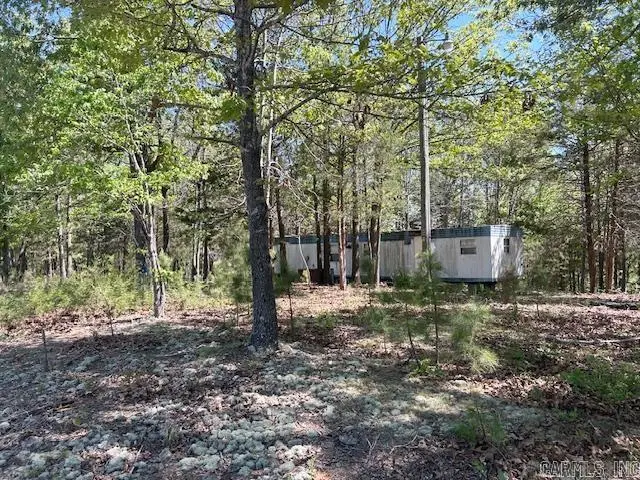
8.5 ACRES/UTILITIES ON-SITE/MINUTES TO THE BUFFALO RIVER Looking for a secluded spot that isn't off the grid. This gorgeous property features power and water already connected. Located between Yellville and Mountain Home. Great place to build your forever home or just a getaway or hunting cabin. Property is unrestricted and has an abundance of deer and turkey, great for that hunter in your life. An older mobile home is on the property and could possibly be fixed up. Must see to appreciate the beautiful piece of property.
Key facts
- Utilities on-site
- 8.5 acres
- 8.5 acre lot
Tags
Property features AI
Finance
- Other: Approximately 8.5 acres; Approx. lot size source: Courthouse / Tax Records
- Financial info: Financing available: Conventional loan or cash
Exterior
- Parking: Parking for 4+ cars
- Utilities: Public water; Municipal electric (Entergy); Wireless internet available
- Home design: Mobile home
- Construction: Metal/Vinyl siding; Metal roof; Not permanent foundation; Built as a mobile unit
- Exterior features: Partially fenced; Dirt road access; Sloped and level lot areas; Livestock allowed
Interior
- Flooring: Vinyl
- Bathrooms: 2 full bathrooms
- Heating & cooling: No heating; No cooling
- Interior features: Vinyl floors
Neighborhood map
What this means for you Summary
Snapshot
- This is a 2-bed/2.0-bath single-family listed at $78k.
Deal economics
- At list price, monthly cash flow is $98 ($1k/yr) — positive.
- The deal already cash-flows at list — no discount required.
- Meets the 1% rule at list price ($807 rent vs $78k).
- Recommended offer: $76k (3.0% below list) — sets the bar for market timing.
- Cap rate 7.8% vs local median 3.5% in Marshall — top-decile yield for the area; either an underpriced asset or a hidden risk that comps aren't pricing in. Stress-test before assuming the spread holds.
Location & tenants
- Location reads 66/100 on livability (#115 in AR) — a middle-class / working-renter tenant base. Strengths: cost of living A+, housing A+, health & safety A+; Watch: schools D+, crime D-, amenities F.
- Yellville-Summit School District (rural): math 41% / reading 37% proficiency, ranked #90 of 238 in AR (top 38%) — families likely to look elsewhere, expect single-tenant / working-renter base with shorter leases.
- Market conditions: 16 active listings in the ZIP.
Forward outlook
- In year one you build about $3k of equity ($539 loan paydown + $2k appreciation (3.0% local appreciation)).
- Searcy County population projected at -26% by 2050 — secular population decline; favor cash flow + early exit over multi-decade hold.
- At projected returns (3.0% appreciation + 3.0% rent growth), your $22k cash investment doubles in ~5 years — after that, you're playing with house money.
Negotiation context
- It's been on market 49 days — a 3% lower offer ($76k) is reasonable based on typical stale-listing flexibility.
- Current owner paid $5k; list at $78k implies a 1460% gain — meaningful room to come down on a strong offer.
Risks & watch-outs
- Climate carrying-cost: moderate wildfire risk — expect insurance premiums to compound above CPI over the hold.
Questions for the listing agent
- It's been on market 49 days. Have you received any prior offers? Is the seller open to a 3% concession, seller financing, or rate buy-down credit?
- Is there a deadline driving the sale (1031 exchange, divorce, estate, relocation)? That informs how much negotiation room exists.
- Schools are D-rated, which usually means shorter tenancies and higher turnover. Who's the typical renter profile here, and what's been the actual vacancy rate?
- Crime grade is D in this area — have there been break-ins, vandalism, or insurance claims at this property in the last 3 years? What carrier currently insures it and at what premium?
- What's the average days-on-market for RENTAL listings here right now (not sales)? A rising rental-DOM trend means longer vacancies and softer asking-rent achievability than the comps imply.
- What's the recent tenant-quality profile in this submarket — average credit score on applications, eviction rate, late-payment / NSF rate, and stable-employment percentage? A property-management company in the area should have these aggregated.
- How much new for-sale + rental construction is in the pipeline within 1–3 miles? Heavy new supply typically softens prices + rents 12–24 months out; constrained supply supports both.
Investment metrics
- 1% rule
- 1.03% ✓
- Cap rate
- 7.81%
- Cash-on-cash
- 5.41%
- DSCR
- 1.24
- GRM
- 8.1
CMA / ARV
No comps found within radius.
Projected returns pro-forma
3.0% appreciation · 3.0% rent growth · sell at horizon
- IRR
- 12.6%
- Equity multiple
- 1.72×
- Total profit
- $15,678
- Equity at exit
- $35,072
- IRR
- 14.6%
- Equity multiple
- 3.15×
- Total profit
- $47,055
- Equity at exit
- $54,050
Cash invested: $21,840 (down + closing). Projections, not guarantees.
Landlord ↔ Tenant lean methodology
- Overall (STATE)
- 92 Strongly Landlord-Friendly
- State Arkansas
- 92 Strongly Landlord-Friendly · R+14
- County
- — inherits STATE
- City
- — inherits STATE
ZIP-level market 72639
- Active inventory
- 16
- Price-to-rent
- 8.1×
Monthly cashflow live
- Estimated rent
- $807 medium interval (Pro) →
- Mortgage (P&I)
- −$409
- Tax est. 1.5%
- −$98 /mo · $1,170/yr
- Insurance
- −$32
- HOA
- −$0
- Vacancy / Maint / Mgmt
- −$169
- Net cashflow
- $98
Break-even live
Sensitivity live
| Price | -10% $152 | -5% $125 | +0% $98 | +5% $71 | +10% $45 |
|---|---|---|---|---|---|
| Rent | -10% $35 | -5% $67 | +0% $98 | +5% $130 | +10% $162 |
| Rate | -1.0pp $138 | -0.5pp $118 | base $98 | +0.5pp $78 | +1.0pp $58 |
UW: 25.0% down · 7.5% · 30yr · 1.5% tax · 5.0% vac · 8.0% maint · 8.0% mgmt
Financing live
Cash to close
- Down payment
- $19,500
- Closing costs
- $2,340
- Reserves months
- —
- Total cash needed
- —
Loan-product check · same deal, 3 products live
Conventional
25% down · 7.5% · 30yr
- Down + closing
- —
- Monthly P&I
- —
- Monthly cashflow
- —
- DSCR
- —
- Eligible?
- —
Personal DTI + credit; lowest rate.
DSCR
20% down · 8.5% · 30yr
- Down + closing
- —
- Monthly P&I
- —
- Monthly cashflow
- —
- DSCR
- —
- Eligible?
- —
No personal income docs; deal must DSCR.
Hard money
10% down · 12.0% · 12mo
- Down + closing
- —
- Monthly P&I
- —
- Monthly cashflow
- —
- DSCR
- —
- Eligible?
- —
Short-term bridge; refi at stabilization.
Listing history 19 events
-
2026-06-19days on market $78,000 Active 49 DOM
-
2026-06-18days on market $78,000 Active 48 DOM
-
2026-06-17days on market $78,000 Active 47 DOM
-
2026-06-16days on market $78,000 Active 46 DOM
-
2026-06-15days on market $78,000 Active 45 DOM
-
2026-06-14days on market $78,000 Active 43 DOM
-
2026-06-12days on market $78,000 Active 42 DOM
-
2026-06-09days on market $78,000 Active 39 DOM
-
2026-06-08days on market $78,000 Active 38 DOM
-
2026-06-07days on market $78,000 Active 37 DOM
-
2026-06-07days on market $78,000 Active 36 DOM
-
2026-06-04days on market $78,000 Active 33 DOM
-
2026-06-02days on market $78,000 Active 32 DOM
-
2026-06-01days on market $78,000 Active 31 DOM
-
2026-05-31days on market $78,000 Active 30 DOM
-
2026-05-31days on market $78,000 Active 29 DOM
-
2026-05-01$78,000 New Listing 526-char remark
-
2012-12-17soldstatus $5,000
-
1999-11-24soldstatus $11,000
ⓘ Source: listings_history table (triggers on properties + properties_extension) + one-shot
backfill from property_details.listing_events for pre-trigger history.
Climate risk First Street
- Flood 1/10 Low 0% chance over 30 yrs
- Wildfire 5/10 Major
- Heat 4/10 Moderate 7 d/yr ≥105°F today · 19 d/yr by 30 yrs out
- Wind 2/10 Low 100% chance of damaging wind over 30 yrs
- Air quality 1/10 Low 0 unhealthy d/yr today · 0 by 30 yrs out
Nearby sold comps map
Loading sold comps map…
Walkable amenities ~0.75 mi
Loading nearby amenities…
Taxation est. · year 1
- Rental income
- $9,683
- − Mortgage interest
- −$4,369
- − Property taxes
- −$1,170
- − Insurance
- −$390
- − Repairs & maintenance
- −$775
- − Management
- −$775
- − Depreciation
- −$2,269
- Taxable loss
- −$64
- Est. tax savings @ 24.0%
- +$15
- After-tax cash flow
- $1,197/yr
For passive investors: Depreciation is non-cash, so a rental often shows a tax loss while cash-flowing — sheltering income. Rental losses are passive: they offset passive income freely, and up to $25,000/yr can offset ordinary (W-2) income if you actively participate and your MAGI is under $100k (phasing out to $0 by $150k); unused losses carry forward. On sale, claimed depreciation is recaptured at up to 25%, and gains may owe capital-gains tax (a 1031 exchange can defer both). Figures are a year-1 estimate at your 24.0% rate — not tax advice; consult a CPA.
Schools (NCES district)
- District
- Yellville-Summit School District
- NCES district ID
- 0514490
- Math proficiency
- 41% ▼ -5.00%
- Reading proficiency
- 37% ▼ -2.00%
- Median HH income
- $32,234
- Composite
- 31.99/100
- National rank
- #5834
- State rank
- #90 of 238 in AR
Livability — Marshall
- Score
- 66/100
- State rank
- #115
- US rank
- #11273
Category grades
Schools grade is shown separately in the Schools card above.
Census & demographics
- Population (ZIP)
- 659
Population outlook (Searcy County) Hauer SSP2
- Today (2025)
- 7,091 people
- By 2030
- 6,656 · -6.1%
- By 2040
- 5,868 · -17.2%
- By 2050
- 5,250 · -26.0%
- By 2075
- 4,407 · -37.9%
- By 2100
- 3,834 · -45.9%
Race, ethnicity, and origin ACS 2023
- Neighborhood character
- Predominantly White (71%)
- Race & ethnicity
- White 71% Two or more races 29% Hispanic / Latino 1%
- Common ancestry
- Italian 17% English 3% Slovak 1%
- Foreign-born
- 3%
Political lean MEDSL · Searcy
- 2024 margin
- Solid R (+72.2) · D 13.2% · R 85.4% · Other 1.4%
- 2008→2024 swing
- -26.3pp toward R · 2008: -45.9pp · 2024: -72.2pp
- All cycles
- 2024: R+72.2 2020: R+69.1 2016: R+63.7 2012: R+51.0 2008: R+45.9
Not yet ingested
- Civics
- —
Market trends
- HPI YoY
- —
- Current HPI
- —
- Rent YoY
- —
- Metro
- —
- State GDP YoY
- ▲ 3.80%
- F500 in state
- 10
Industry mix (Fortune 500 HQ in AR)
| Industry | F500 HQs | Revenue |
|---|---|---|
| Retail | 1 | $681B |
|
||
| Food / Agriculture | 1 | $53B |
|
||
| Retail / Energy | 1 | $22B |
|
||
| Transportation / Logistics | 1 | $12B |
|
||
| Energy | 1 | $4B |
|
||
Price history
+609.1% since first listed3 events — show timeline
- 2026-05-01 Listed $78,000 CARMLS
- 2012-12-17 Sold (Public Records) $5,000 Public Records
- 1999-11-24 Sold (Public Records) $11,000 Public Records
Property tax history
+0.5%/yrLatest (2025): $99 · +8.4% YoY. Source: county tax records.
Cash-flow waterfall
monthlySold comps — $/sqft
last 12 mo · ≤1 miLoading sold comps…