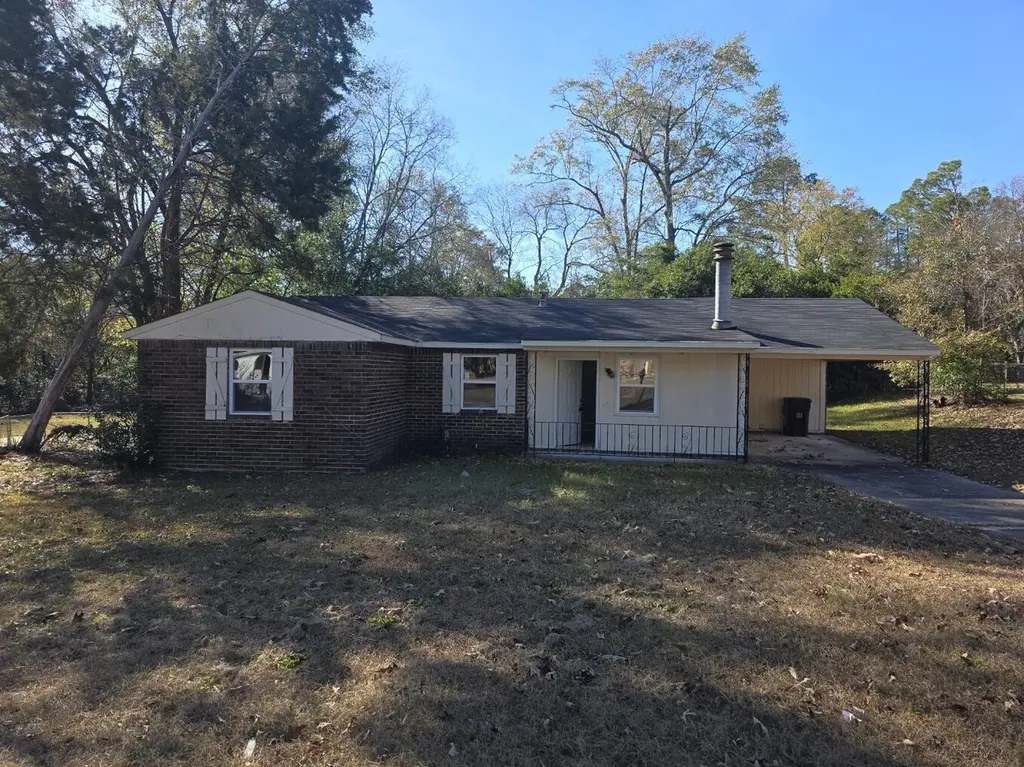
4305 Parkwood Dr · Augusta-Richmond County consolidated government (balance), GA
Flood risk 1/10 · Minimal
- FEMA flood zone
- X (unshaded)
- Chance of flooding over 30 yrs
- 0.0%
- Est. flood insurance / yr
- $507 – $1,088
Fire risk 4/10 · Minor
- Est. fire insurance / yr
- $963 – $1,789
Heat risk 7/10 · Major
- Hot days now (above 106°F)
- 7 days/yr
- Hot days in 30 yrs
- 17 days/yr
Wind risk 6/10 · Moderate
- Chance of severe wind over 30 yrs
- 72.0%
Air-quality risk 3/10 · Minor
- Unhealthy air days now
- 3 days/yr
- Unhealthy air days in 30 yrs
- 3 days/yr
Risk factors via First Street. Map © Google.
Why this score? — see what drove the D grade
The composite is a weighted blend of 9 inputs, each scored 0–100. Each bar is that input's sub-score; the figure is the points it added to the 100-point composite (weight × sub-score).
- Cash flow +15.7/30.0
- ARV discount +6.9/15.0
- DSCR +4.8/10.0
- 1% rule +4.0/10.0
- Livability +2.5/5.0
- Condition / age +2.5/5.0
- Rent growth +2.4/5.0
- Schools +1.3/10.0
- Appreciation +0.0/10.0
$189,997
🖨 Deal sheet (PDF) 📄 Offer letter ✓ Due diligence
Listing remarks
Seller offering 10,000 buyer incentive with full price offer! Great for First time home buyers! Lease Purchase options and Owner financing available! Welcome to this amazing updated 4 Bedroom and 2 full bath home. With all ceramic tile flooring throughout the whole home and with NO carpet!! New Windows. Brick fireplace in the living room. Kitchen to be updated with Brand new Dishwasher, brand new Oven be for closing, has brand new faucet, and beautiful granite counter tops and back splash. New Roof * Owner financing available with approved terms. * Lease purchase option is available with approved terms. Several more homes are available that can be bought with large portfolio.
Key facts
- Back splash
- Brick fireplace
- Granite counter tops
Tags
Property features AI
Finance
- HOA & community: Street lights in the community
Exterior
- Parking: Attached garage; Carport; Concrete parking surfaces
- Utilities: Public water; Public sewer; Cable available
- Home design: Single-family residence; One level / single story; Entry level: 1
- Construction: Concrete, brick and fiber cement construction; Composition roof; Slab foundation; Built on a 0.39-acre lot; Zoned R-1
- Exterior features: Front porch; No fencing; Has a view
Interior
- Kitchen: Built-in electric oven; Dishwasher; Eat-in kitchen
- Bedrooms: Total rooms: 10
- Flooring: Ceramic tile
- Bathrooms: 2 full bathrooms
- Heating & cooling: Central air; Ceiling fans; Fireplace(s); Natural gas heating
- Interior features: Eat-in kitchen; Window coverings; Insulated windows; Built-in electric oven; Dishwasher; Gas water heater
- Laundry & utility: Washer hookup
Neighborhood map
What this means for you Summary
Snapshot
- This is a 4-bed/2.0-bath single-family listed at $190k.
Deal economics
- At list price, monthly cash flow is $83 ($992/yr) — positive.
- The deal already cash-flows at list — no discount required.
- To meet the 1% rule (rent ≥ 1% of price), the offer needs to be $170k (10.3% below list).
- Recommended offer: $170k (10.3% below list) — sets the bar for 1% rule.
- Cap rate 6.8% vs local median 5.3% in Augusta-Richmond County consolidated government (balance) — meaningfully above typical; check what's discounted (condition, days-on-market, listing class) to confirm the premium yield is real.
Location & tenants
- Location reads: area grade D — affects rentability + tenant quality, not the cash-flow math above.
- Richmond County (urban): math 12% / reading 20% proficiency, ranked #154 of 174 in GA (top 88%) — low school quality limits family demand, transient renter base, plan for 1-2y turnover; 72% free/reduced lunch — lower-income household profile, screen leases tightly.
- Zoned schools: Hephzibah Elementary School (math 12% / reading 17%, grade F, #996 of 1,228 statewide, top 83%, 375 students, 98% FRL); Hephzibah Middle School (math 12% / reading 21%, grade F, #388 of 470 statewide, top 83%, 517 students, 98% FRL) — zoned schools average 98% FRL vs 72% district-wide (26 pts higher); higher-poverty schools than district average — tighter screening recommended.
- Market conditions: Rents soft (-0.2%/yr); 367 active listings in the ZIP; 5 comparable units currently listed for rent nearby; rentals lingering (median 45d on market — plan ~5-8 weeks vacancy on turnover, expect pricing pressure); 60% of comp listings sitting > 30 days — soft ceiling on asking rent; 561 units permitted in Richmond County in 2024 (0 in 5+ unit buildings).
- This rent runs 44% of the median local income ($46k/yr) — at the standard rent-burdened threshold; future hikes will face affordability resistance.
Forward outlook
- Local home prices are declining (-3.0%/yr); year-one equity from $1k of loan paydown is wiped out by about $6k of value loss. Plan a longer hold.
- Richmond County population projected to shrink 5% by 2050 — rents likely to lag national; underwrite the cash flow, not the appreciation.
Negotiation context
- It's been on market 41 days — a 3% lower offer ($184k) is reasonable based on typical stale-listing flexibility.
- 2 sale attempts with the ask held roughly flat each time — persistent listings suggest the price (not the market) is what's stuck; bring a comps-based counter.
Risks & watch-outs
- Climate carrying-cost: major wind risk, 72% chance of damaging wind over 30y; extreme-heat days projected 7→17/yr by 2055 (HVAC capex compounding) — expect insurance premiums to compound above CPI over the hold.
Questions for the listing agent
- It's been on market 41 days. Have you received any prior offers? Is the seller open to a 10% concession, seller financing, or rate buy-down credit?
- Built in 1979 — when were the roof, HVAC, electrical panel, plumbing, and water heater last replaced?
- Is there a deadline driving the sale (1031 exchange, divorce, estate, relocation)? That informs how much negotiation room exists.
- The area grade is low — what's the realistic commute time and amenity access for the typical tenant pool here? Any planned neighborhood developments (good or bad) we should know about?
- What's the average days-on-market for RENTAL listings here right now (not sales)? A rising rental-DOM trend means longer vacancies and softer asking-rent achievability than the comps imply.
- What's the recent tenant-quality profile in this submarket — average credit score on applications, eviction rate, late-payment / NSF rate, and stable-employment percentage? A property-management company in the area should have these aggregated.
- How much new for-sale + rental construction is in the pipeline within 1–3 miles? Heavy new supply typically softens prices + rents 12–24 months out; constrained supply supports both.
Investment metrics
- 1% rule
- 0.90% ✗
- Cap rate
- 6.81%
- Cash-on-cash
- 1.86%
- DSCR
- 1.08
- GRM
- 9.3
CMA / ARV
- ARV (median comp)
- $187,642
- List price
- $189,997
- Delta
- 1.25%
- Verdict
- FAIR
- Comps
- 20 within 1.0 mi
Show comp detail 12 sales within ~0.75 mi
| Address | Dist | Beds/Ba | Sqft | Sold | Price | $/sf | Match |
|---|---|---|---|---|---|---|---|
| 2339 Basswood Dr | 0.13mi | 3/2.0 (-1) | 1,350 (+3%) | 6mo | $199,900 | $148 | 79 |
| 2373 Richwood Dr | 0.26mi | 3/2.0 (-1) | 1,318 (+0%) | 9mo | $205,000 | $156 | 75 |
| 4204 Field Ct | 0.16mi | 4/2.0 | 1,410 (+7%) | 8mo | $195,000 | $138 | 73 |
| 2323 Woodsman Dr | 0.27mi | 3/1.5 (-1) | 1,226 (-7%) | 1mo | $154,000 | $126 | 68 |
| 2348 Fieldcrest Rd | 0.36mi | 3/2.0 (-1) | 1,450 (+10%) | 3mo | $224,000 | $154 | 59 |
| 2316 Oketo Dr | 0.59mi | 3/2.0 (-1) | 1,350 (+3%) | 5mo | $205,000 | $152 | 58 |
| 2302 Hiwatha Dr | 0.44mi | 3/2.0 (-1) | 1,245 (-5%) | 10mo | $160,000 | $129 | 57 |
| 4212 Winslow Ln | 0.67mi | 3/2.0 (-1) | 1,311 (-0%) | 9mo | $209,900 | $160 | 56 |
| 2325 Moncrieff St | 0.47mi | 3/2.0 (-1) | 1,436 (+9%) | 7mo | $209,900 | $146 | 52 |
| 2382 Travis Pines Dr | 0.59mi | 3/2.0 (-1) | 1,202 (-8%) | 8mo | $145,000 | $121 | 46 |
| 2317 Hiwatha Dr | 0.57mi | 3/2.0 (-1) | 1,138 (-13%) | 3mo | $161,950 | $142 | 44 |
| 2412 Turkey Trail Dr | 0.66mi | 3/1.0 (-1) | 1,200 (-9%) | 4mo | $59,000 | $49 | 43 |
Match score weights: distance 35% · size 25% · config 20% · recency 20%. Top-matched comps best support the ARV.
Projected returns pro-forma
-3.0% appreciation · 0.0% rent growth · sell at horizon
- IRR
- -16.6%
- Equity multiple
- 0.43×
- Total profit
- $-30,524
- Equity at exit
- $28,329
- IRR
- -14.8%
- Equity multiple
- 0.26×
- Total profit
- $-39,121
- Equity at exit
- $16,427
Cash invested: $53,199 (down + closing). Projections, not guarantees.
Landlord ↔ Tenant lean methodology
- Overall (STATE)
- 90 Strongly Landlord-Friendly
- State Georgia
- 90 Strongly Landlord-Friendly · R+3
- County
- — inherits STATE
- City
- — inherits STATE
ZIP-level market 30906
- Home prices YoY
- -21.6%
- Rents YoY
- -0.2%
- Active inventory
- 367
- Price-to-rent
- 9.3×
Monthly cashflow live
- Estimated rent
- $1,704 high interval (Pro) →
- Mortgage (P&I)
- −$996
- Tax from tax record
- −$188 /mo · $2,257/yr
- Insurance
- −$79
- HOA
- −$0
- Vacancy / Maint / Mgmt
- −$358
- Net cashflow
- $83
Break-even live
Sensitivity live
| Price | -10% $190 | -5% $136 | +0% $83 | +5% $29 | +10% $-25 |
|---|---|---|---|---|---|
| Rent | -10% $-52 | -5% $15 | +0% $83 | +5% $150 | +10% $217 |
| Rate | -1.0pp $178 | -0.5pp $131 | base $83 | +0.5pp $33 | +1.0pp $-17 |
UW: 25.0% down · 7.5% · 30yr · 1.5% tax · 5.0% vac · 8.0% maint · 8.0% mgmt
Financing live
Cash to close
- Down payment
- $47,499
- Closing costs
- $5,700
- Reserves months
- —
- Total cash needed
- —
Loan-product check · same deal, 3 products live
Conventional
25% down · 7.5% · 30yr
- Down + closing
- —
- Monthly P&I
- —
- Monthly cashflow
- —
- DSCR
- —
- Eligible?
- —
Personal DTI + credit; lowest rate.
DSCR
20% down · 8.5% · 30yr
- Down + closing
- —
- Monthly P&I
- —
- Monthly cashflow
- —
- DSCR
- —
- Eligible?
- —
No personal income docs; deal must DSCR.
Hard money
10% down · 12.0% · 12mo
- Down + closing
- —
- Monthly P&I
- —
- Monthly cashflow
- —
- DSCR
- —
- Eligible?
- —
Short-term bridge; refi at stabilization.
Rent comps 5 comps
| Address | Beds | Baths | Sqft | Rent | $/sqft | DOM | Units | Dist |
|---|---|---|---|---|---|---|---|---|
| 2302 Woodsman Dr Augusta, GA | 3.0 | 2.0 | 1436 | $1,475 | $1.03 | 24d | 1 | 0.11mi |
| 2401 Boykin Rd Hephzibah, GA | 3.0 | 2.5 | 1644 | $1,600 | $0.97 | 45d | 1 | 0.52mi |
| 4416 Hatteras Dr Augusta, GA | 3.0 | 2.0 | 1436 | $1,600 | $1.11 | 15d | 1 | 0.81mi |
| 4235 Cap Chat St Hephzibah, GA | 3.0 | 2.0 | 1300 | $1,651 | $1.27 | 45d | 1 | 0.89mi |
| 4438 Windsor Spring Rd Hephzibah, GA | 4.0 | 2.0 | 1653 | $1,900 | $1.15 | 45d | 1 | 1.20mi |
Listing history 19 events
-
2026-06-21days on market $189,997 Active 41 DOM
-
2026-06-18days on market $189,997 Active 38 DOM
-
2026-06-17days on market $189,997 Active 37 DOM
-
2026-06-16days on market $189,997 Active 36 DOM
-
2026-06-15days on market $189,997 Active 35 DOM
-
2026-06-14days on market $189,997 Active 33 DOM
-
2026-06-10days on market $189,997 Active 30 DOM
-
2026-06-09days on market $189,997 Active 29 DOM
-
2026-06-08days on market $189,997 Active 28 DOM
-
2026-06-07days on market $189,997 Active 27 DOM
-
2026-06-03days on market $189,997 Active 23 DOM
-
2026-06-02days on market $189,997 Active 22 DOM
-
2026-06-01days on market $189,997 Active 21 DOM
-
2026-05-31days on market $189,997 Active 20 DOM
-
2026-05-30days on market $189,997 Active 19 DOM
-
2026-05-11historical
-
2026-01-22price $189,997
-
2025-12-12$189,999 Active
-
2025-12-12$189,997 Active 689-char remark
ⓘ Source: listings_history table (triggers on properties + properties_extension) + one-shot
backfill from property_details.listing_events for pre-trigger history.
Tax reassessment forecast GA · Resets to sale price
- Current annual tax
- $2,257 · $188/mo
- Projected year-2 tax
- $2,257 · $188/mo
- Expected delta
- $0/yr ($0/mo · 0.0%)
ⓘ Screening estimate from a state-policy table — verify with the county assessor before closing.
Climate risk First Street
- Flood 1/10 Low FEMA zone X (unshaded) · 0% chance over 30 yrs
- Wildfire 4/10 Moderate
- Heat 7/10 Severe 7 d/yr ≥106°F today · 17 d/yr by 30 yrs out
- Wind 6/10 Major 72% chance of damaging wind over 30 yrs
- Air quality 3/10 Moderate 3 unhealthy d/yr today · 3 by 30 yrs out
Nearby sold comps map
Loading sold comps map…
Walkable amenities ~0.75 mi
Loading nearby amenities…
Taxation est. · year 1
- Rental income
- $20,449
- − Mortgage interest
- −$10,643
- − Property taxes
- −$2,257
- − Insurance
- −$950
- − Repairs & maintenance
- −$1,636
- − Management
- −$1,636
- − Depreciation
- −$5,527
- Taxable loss
- −$2,200
- Est. tax savings @ 24.0%
- +$528
- After-tax cash flow
- $1,519/yr
For passive investors: Depreciation is non-cash, so a rental often shows a tax loss while cash-flowing — sheltering income. Rental losses are passive: they offset passive income freely, and up to $25,000/yr can offset ordinary (W-2) income if you actively participate and your MAGI is under $100k (phasing out to $0 by $150k); unused losses carry forward. On sale, claimed depreciation is recaptured at up to 25%, and gains may owe capital-gains tax (a 1031 exchange can defer both). Figures are a year-1 estimate at your 24.0% rate — not tax advice; consult a CPA.
Schools (NCES district)
- District
- Richmond County
- NCES district ID
- 1304380
- Math proficiency
- 12% ▼ -9.00%
- Reading proficiency
- 20% ▼ -6.00%
- Median HH income
- $38,069
- Composite
- 13.43/100
- National rank
- #9524
- State rank
- #154 of 174 in GA
Livability — Augusta-Richmond County consolidated government (balance)
No livability data for this city. (Only ~50 U.S. cities are tracked.)
Census & demographics
- Census place
- Augusta-Richmond County consolidated government (balance), GA
- County
- Richmond County · 190,917 people
- City population
- 154,035
- Metro
- Augusta-Richmond County, GA-SC
- Population (ZIP)
- 60,423
- Household income
- $45,999
- Rent vs Own
- Severe rent burden
- 3363.0
Population outlook (Richmond County) Hauer SSP2
- Today (2025)
- 200,753 people
- By 2030
- 200,232 · -0.3%
- By 2040
- 196,813 · -2.0%
- By 2050
- 190,347 · -5.2%
- By 2075
- 172,496 · -14.1%
- By 2100
- 146,284 · -27.1%
Race, ethnicity, and origin ACS 2023
- Neighborhood character
- Majority Black (64%)
- Race & ethnicity
- Black 64% White 27% Two or more races 5% Hispanic / Latino 5%
- Common ancestry
- Lithuanian 1%
- Foreign-born
- 2% · Canada
- Languages at home
- 95% English-only · Spanish 3% German/W. Germanic 1%
Political lean MEDSL · Richmond
- 2024 margin
- Solid D (+36.1) · D 67.8% · R 31.7%
- 2008→2024 swing
- +4.3pp toward D · 2008: 31.8pp · 2024: 36.1pp
- All cycles
- 2024: D+36.1 2020: D+37.2 2016: D+32.4 2012: D+33.8 2008: D+31.8
Not yet ingested
- Civics
- —
Market trends
- HPI YoY
- ▼ -58.99%
- Current HPI
- 213.5733
- Rent YoY
- ▼ -0.25%
- Metro
- Augusta-Richmond County, GA-SC
- State GDP YoY
- ▲ 2.66%
- F500 in state
- 28
Industry mix (Fortune 500 HQ in GA)
| Industry | F500 HQs | Revenue |
|---|---|---|
| Paper / Packaging | 2 | $29B |
|
||
| Retail | 1 | $160B |
|
||
| Transportation / Logistics | 1 | $91B |
|
||
| Airlines | 1 | $62B |
|
||
| Consumer Goods | 1 | $47B |
|
||
| Utilities | 1 | $25B |
|
||
Price history
-0.0% since first listed4 events — show timeline
- 2026-05-11 Listing Removed — Hive MLS
- 2026-01-22 Price Changed $189,997 Hive MLS
- 2025-12-12 Listed $189,997 Hive MLS
- 2025-12-12 Listed $189,999 Hive MLS
Property tax history
+4.7%/yrLatest (2025): $2,257 · +10.6% YoY. Source: county tax records.
Cash-flow waterfall
monthlySold comps — $/sqft
last 12 mo · ≤1 miLoading sold comps…