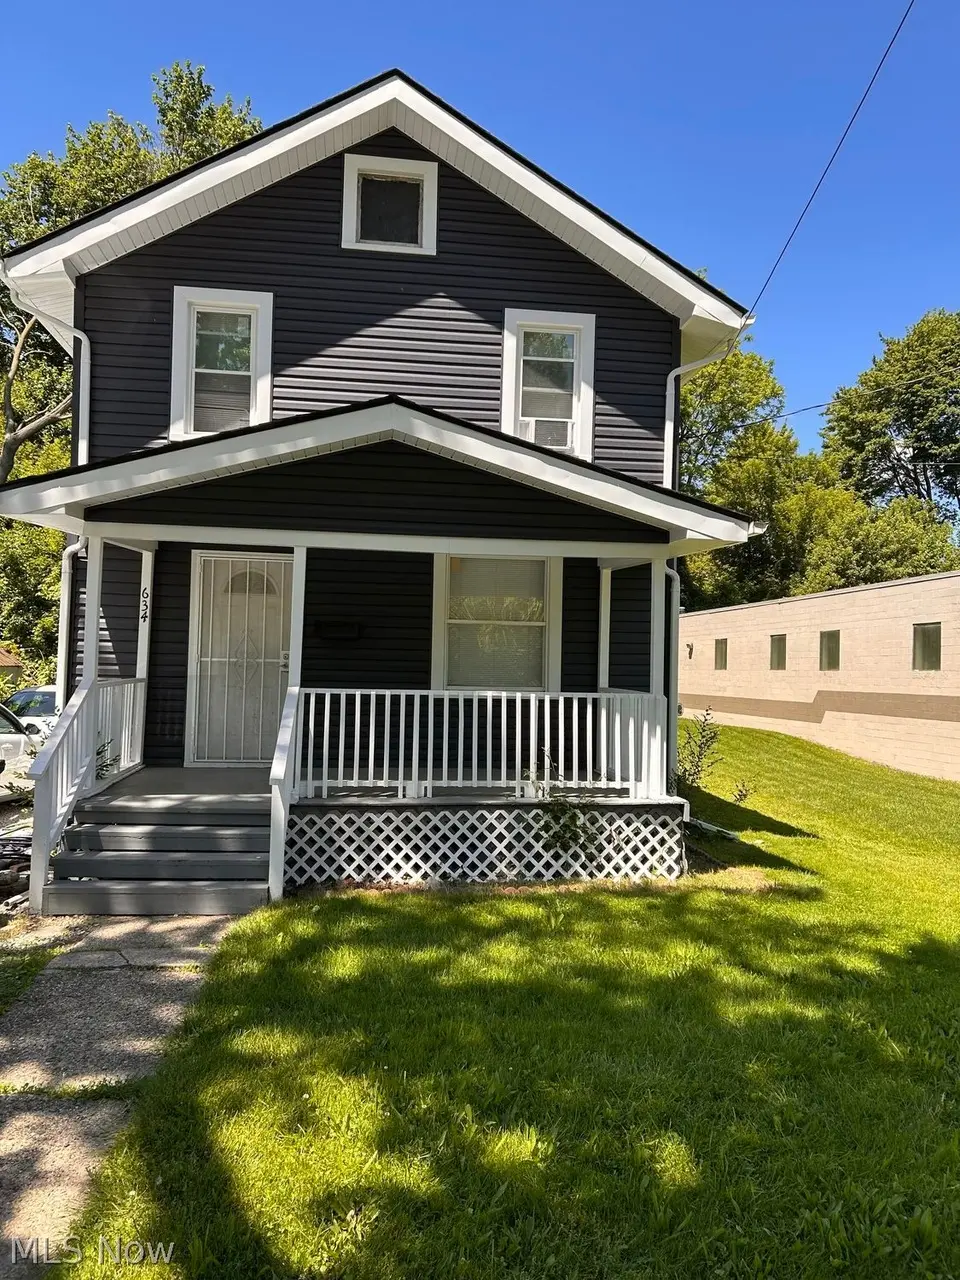
634 Spicer St · Akron, OH
Flood risk 6/10 · Moderate
- FEMA flood zone
- X (unshaded)
- Chance of flooding over 30 yrs
- 0.71%
- Est. flood insurance / yr
- $473 – $860
Fire risk 1/10 · Minimal
- Est. fire insurance / yr
- $713 – $1,323
Heat risk 3/10 · Minor
- Hot days now (above 96°F)
- 7 days/yr
- Hot days in 30 yrs
- 17 days/yr
Wind risk 1/10 · Minimal
- Chance of severe wind over 30 yrs
- —
Air-quality risk 3/10 · Minor
- Unhealthy air days now
- 2 days/yr
- Unhealthy air days in 30 yrs
- 4 days/yr
Risk factors via First Street. Map © Google.
Why this score? — see what drove the D grade
The composite is a weighted blend of 9 inputs, each scored 0–100. Each bar is that input's sub-score; the figure is the points it added to the 100-point composite (weight × sub-score).
- Cash flow +21.4/30.0
- DSCR +6.8/10.0
- 1% rule +5.6/10.0
- Livability +4.0/5.0
- Rent growth +2.5/5.0
- Condition / age +2.5/5.0
- Schools +2.1/10.0
- ARV discount +0.0/15.0
- Appreciation +0.0/10.0
$109,900
🖨 Deal sheet 📄 Offer letter ✓ Due diligence
Listing remarks MLS
Welcome to 634 Spicer St, a cozy 3-bedroom, 1-bathroom colonial home boasting 1,016 square feet of potential. This delightful property features numerous vinyl replacement windows, allowing natural light to flood the home. The basement offers plenty of storage space, has a workshop/office, and is equipped with a sump pump - ensuring peace of mind during wet weather. While this home needs some TLC, it offers a fantastic opportunity to customize and make it your own. Seller is selling this "as is" and will NOT make any repairs. Located just minutes from downtown Akron, the University of Akron, and Akron Children's Hospital, this home is perfectly situated for convenience and accessibility. Whether you're looking for a starter home or a promising investment property, 634 Spicer St has great potential.
Key facts
- Close to campus
- Updated home
- 2,822 sq ft lot
Tags
Neighborhood map
What this means for you Summary
Snapshot
- This is a 3-bed/1.0-bath single-family listed at $110k.
Deal economics
- At list price, monthly cash flow is $162 ($2k/yr) — positive.
- The deal already cash-flows at list — no discount required.
- Meets the 1% rule at list price ($1k rent vs $110k).
- Cap rate 8.1% vs local median 6.6% in Akron — meaningfully above typical; check what's discounted (condition, days-on-market, listing class) to confirm the premium yield is real.
Location & tenants
- Location reads 81/100 on livability (#104 in OH, #1,591 nationally) — a professional / high-income tenant draw. Strengths: amenities A+, commute A+, cost of living A+; Watch: crime F, employment F.
- Akron City (urban): math 22% / reading 30% proficiency, ranked #602 of 656 in OH (top 92%) — low school quality limits family demand, transient renter base, plan for 1-2y turnover; 66% free/reduced lunch — lower-income household profile, screen leases tightly.
- Market conditions: 54 active listings in the ZIP; 40 comparable units currently listed for rent nearby; rentals lingering (median 44d on market — plan ~5-8 weeks vacancy on turnover, expect pricing pressure); 50% of comp listings sitting > 30 days — soft ceiling on asking rent; lower-income renter base — watch delinquency; 1,114 units permitted in Summit County in 2024 (397 in 5+ unit buildings).
- At $1,162/mo this rent would consume 57% of the median local household income ($24k/yr) (locally 659% of renters already pay >50% of income on rent) — very limited rent-growth headroom before tenants either downsize or default.
Forward outlook
- Local home prices are declining (-3.0%/yr); year-one equity from $760 of loan paydown is wiped out by about $3k of value loss. Plan a longer hold.
- Summit County population projected to shrink 6% by 2050 — rents likely to lag national; underwrite the cash flow, not the appreciation.
Negotiation context
- Only 13 days on market — expect competitive offers; lowballing is unlikely to land.
- 8 sale attempts since 19y ago; this cycle's ask has dropped $10k (8%) from the opening price — seller is motivated, your offer sets the floor, not the list.
- Current owner paid $40k; list at $110k implies a 171% gain — meaningful room to come down on a strong offer.
Risks & watch-outs
- Watch-outs: built in 1919 — expect roof / HVAC / electrical / plumbing capex.
- Climate carrying-cost: major flood risk — expect insurance premiums to compound above CPI over the hold.
Questions for the listing agent
- Built in 1919 — when were the roof, HVAC, electrical panel, plumbing, and water heater last replaced?
- Is there a deadline driving the sale (1031 exchange, divorce, estate, relocation)? That informs how much negotiation room exists.
- Crime grade is F in this area — have there been break-ins, vandalism, or insurance claims at this property in the last 3 years? What carrier currently insures it and at what premium?
- The area grade is low — what's the realistic commute time and amenity access for the typical tenant pool here? Any planned neighborhood developments (good or bad) we should know about?
- What's the average days-on-market for RENTAL listings here right now (not sales)? A rising rental-DOM trend means longer vacancies and softer asking-rent achievability than the comps imply.
- What's the recent tenant-quality profile in this submarket — average credit score on applications, eviction rate, late-payment / NSF rate, and stable-employment percentage? A property-management company in the area should have these aggregated.
- How much new for-sale + rental construction is in the pipeline within 1–3 miles? Heavy new supply typically softens prices + rents 12–24 months out; constrained supply supports both.
Investment metrics
- 1% rule
- 1.06% ✓
- Cap rate
- 8.06%
- Cash-on-cash
- 6.32%
- DSCR
- 1.28
- GRM
- 7.9
CMA / ARV
- ARV (on-the-fly)
- $92,456
- Comps found
- 12
Show comp detail 12 sales within ~0.75 mi
| Address | Dist | Beds/Ba | Sqft | Sold | Price | $/sf | Match |
|---|---|---|---|---|---|---|---|
| 370 E Thornton St | 0.23mi | 3/1.0 | 1,015 (-0%) | 6mo | $75,500 | $74 | 84 |
| 791 Allyn St | 0.33mi | 3/1.0 | 992 (-2%) | 4mo | $85,000 | $86 | 78 |
| 685 Brown St | 0.08mi | 4/1.0 (+1) | 899 (-12%) | 8mo | $90,000 | $100 | 66 |
| 374 E Voris St | 0.22mi | 3/1.0 | 876 (-14%) | 5mo | $102,000 | $116 | 62 |
| 381 Bethwayne Ct | 0.26mi | 4/1.0 (+1) | 1,152 (+13%) | 8mo | $70,000 | $61 | 54 |
| 314 Sterling Ct | 0.44mi | 4/1.0 (+1) | 1,112 (+9%) | 9mo | $101,000 | $91 | 51 |
| 835 Inman St | 0.73mi | 3/1.0 | 1,079 (+6%) | 5mo | $81,000 | $75 | 51 |
| 807 Baird St | 0.62mi | 3/1.0 | 1,128 (+11%) | 4mo | $55,000 | $49 | 49 |
| 912 Ashland Ave | 0.53mi | 2/1.0 (-1) | 864 (-15%) | 1mo | $87,000 | $101 | 44 |
| 848 Kling St | 0.37mi | 4/2.5 (+1) | 1,160 (+14%) | 5mo | $110,000 | $95 | 44 |
| 442 Matthews St | 0.69mi | 3/1.5 | 900 (-11%) | 6mo | $90,000 | $100 | 42 |
| 917 Clay St | 0.48mi | 2/1.0 (-1) | 864 (-15%) | 8mo | $72,000 | $83 | 41 |
Match score weights: distance 35% · size 25% · config 20% · recency 20%. Top-matched comps best support the ARV.
Projected returns pro-forma
-3.0% appreciation · 3.0% rent growth · sell at horizon
- IRR
- -6.5%
- Equity multiple
- 0.76×
- Total profit
- $-7,465
- Equity at exit
- $16,386
- IRR
- 3.1%
- Equity multiple
- 1.22×
- Total profit
- $6,861
- Equity at exit
- $9,502
Cash invested: $30,772 (down + closing). Projections, not guarantees.
Landlord ↔ Tenant lean methodology
- Overall (STATE)
- 73 Landlord-Friendly
- State Ohio
- 73 Landlord-Friendly · R+6
- County
- — inherits STATE
- City
- — inherits STATE
ZIP-level market 44311
- Home prices YoY
- -28.4%
- Active inventory
- 54
- Price-to-rent
- 7.9×
Monthly cashflow live
- Estimated rent
- $1,162 high interval (Pro) →
- Mortgage (P&I)
- −$576
- Tax from tax record
- −$134 /mo · $1,607/yr
- Insurance
- −$46
- HOA
- −$0
- Vacancy / Maint / Mgmt
- −$244
- Net cashflow
- $162
Break-even live
UW: 25.0% down · 7.5% · 30yr · 1.5% tax · 5.0% vac · 8.0% maint · 8.0% mgmt
Financing live
Cash to close
- Down payment
- $27,475
- Closing costs
- $3,297
- Reserves months
- —
- Total cash needed
- —
Loan-product check · same deal, 3 products live
Conventional
25% down · 7.5% · 30yr
- Down + closing
- —
- Monthly P&I
- —
- Monthly cashflow
- —
- DSCR
- —
- Eligible?
- —
Personal DTI + credit; lowest rate.
DSCR
20% down · 8.5% · 30yr
- Down + closing
- —
- Monthly P&I
- —
- Monthly cashflow
- —
- DSCR
- —
- Eligible?
- —
No personal income docs; deal must DSCR.
Hard money
10% down · 12.0% · 12mo
- Down + closing
- —
- Monthly P&I
- —
- Monthly cashflow
- —
- DSCR
- —
- Eligible?
- —
Short-term bridge; refi at stabilization.
Rent comps 40 comps
| Address | Beds | Baths | Sqft | Rent | $/sqft | DOM | Units | Dist |
|---|---|---|---|---|---|---|---|---|
| 689 Kling St Akron, OH | 3.0 | 1.0 | 780 | $1,075 | $1.38 | 21d | 1 | 0.12mi |
| 548 Spicer St Akron, OH | 4.0 | 2.0 | 1487 | $1,100 | $0.74 | 23d | 1 | 0.17mi |
| 374 E Voris St Akron, OH | 3.0 | 1.0 | 876 | $1,150 | $1.31 | 23d | 1 | 0.21mi |
| 796 Brown St Akron, OH | 4.0 | 2.0 | 1200 | $900 | $0.75 | 43d | 1 | 0.27mi |
| 393 Cross St Unit 393 Akron, OH | 2.0 | 1.0 | 864 | $775 | $0.90 | 43d | 1 | 0.29mi |
| 356 Rankin St Akron, OH | 4.0 | 1.5 | 1186 | $1,197 | $1.01 | 23d | 1 | 0.30mi |
| 418 Power St Akron, OH | 3.0 | 1.0 | 1000 | $999 | $1.00 | 23d | 1 | 0.31mi |
| 467 Spicer St Akron, OH | 2.0 | 1.0 | 800 | $915 | $1.14 | 23d | 1 | 0.32mi |
| 420 Power St Akron, OH | 3.0 | 1.0 | 900 | $800 | $0.89 | 23d | 1 | 0.32mi |
| 484 Hammel St Akron, OH | 2.0 | 1.0 | 792 | $1,100 | $1.39 | 43d | 1 | 0.32mi |
| 461 Spicer St Akron, OH | 3.0 | 2.0 | 1000 | $995 | $0.99 | 43d | 1 | 0.33mi |
| 662 Sumner St Akron, OH | 2.0 | 1.0 | 915 | $999 | $1.09 | 43d | 1 | 0.34mi |
| 658 Sumner St Akron, OH | 2.0 | 1.0 | 915 | $999 | $1.09 | 43d | 1 | 0.34mi |
| 490 Gage St Akron, OH | 4.0 | 1.0 | 1326 | $1,053 | $0.79 | 43d | 1 | 0.35mi |
| 566 Sumner St Akron, OH | 4.0 | 1.0 | 1170 | $1,200 | $1.03 | 43d | 1 | 0.42mi |
| 885 Brown St Akron, OH | 4.0 | 2.0 | 1280 | $1,400 | $1.09 | 23d | 1 | 0.44mi |
| 600 Sherman St Akron, OH | 4.0 | 1.0–2.0 | 824 | $1,400 | $1.70 | 14d | 14 | 0.44mi |
| 907 Kling St Akron, OH | 3.0 | 1.0 | 1248 | $1,250 | $1.00 | 14d | 1 | 0.47mi |
| 287 Wheeler St Akron, OH | 3.0 | 1.0 | 1100 | $1,350 | $1.23 | 23d | 1 | 0.50mi |
| 505 Rentschler St Unit Down Akron, OH | 2.0 | 1.0 | 825 | $850 | $1.03 | 14d | 1 | 0.51mi |
| 421 Allyn St Unit 2 Akron, OH | 3.0 | 1.0 | 743 | $850 | $1.14 | 43d | 1 | 0.54mi |
| 344 Lease St Akron, OH | 3.0 | 1.0 | 1000 | $1,199 | $1.20 | 43d | 1 | 0.54mi |
| 437 Sumner St Apt A Akron, OH | 3.0 | 1.5 | 750 | $1,200 | $1.60 | 23d | 1 | 0.56mi |
| 437 Sumner St Apt D Akron, OH | 2.0 | 1.5 | 750 | $900 | $1.20 | 23d | 1 | 0.56mi |
| 878 Clark St Akron, OH | 3.0 | 2.0 | 1029 | $1,440 | $1.40 | 43d | 1 | 0.57mi |
| 629 Morgan Ave Akron, OH | 2.0 | 1.0 | 960 | $1,200 | $1.25 | 43d | 1 | 0.61mi |
| 406 Sumner St Akron, OH | 2.0–4.0 | 1.0–2.0 | 836 | $1,085 | $1.30 | 14d | 3 | 0.63mi |
| 979 Neptune Ave Akron, OH | 3.0 | 1.0 | 1248 | $1,250 | $1.00 | 23d | 1 | 0.71mi |
| 1028 Kling St Akron, OH | 4.0 | 2.0 | 1500 | $1,450 | $0.97 | 43d | 1 | 0.72mi |
| 621 Hudson Ave Akron, OH | 3.0 | 1.0 | 780 | $1,100 | $1.41 | 14d | 1 | 0.75mi |
| 1036 Neptune Ave Akron, OH | 3.0 | 1.0 | 1000 | $1,350 | $1.35 | 43d | 1 | 0.81mi |
| 1139 Marcy St Akron, OH | 4.0 | 1.5 | 1300 | $1,300 | $1.00 | 43d | 1 | 0.82mi |
| 987 Boone St Akron, OH | 3.0 | 1.0 | 1248 | $1,100 | $0.88 | 23d | 1 | 0.82mi |
| 1040 Neptune Ave Akron, OH | 4.0 | 1.0 | 1400 | $1,300 | $0.93 | 43d | 1 | 0.82mi |
| 1085 Herberich Ave Akron, OH | 4.0 | 1.0 | 1350 | $1,400 | $1.04 | 43d | 1 | 0.83mi |
| 783 E Exchange St Unit 2nd Akron, OH | 2.0 | 1.0 | 951 | $875 | $0.92 | 23d | 1 | 0.87mi |
| 801 E Exchange St Akron, OH | 2.0 | 1.0 | 850 | $925 | $1.09 | 23d | 1 | 0.90mi |
| 377 Talbot Ave Akron, OH | 2.0 | 1.0 | 1070 | $1,050 | $0.98 | 43d | 1 | 0.91mi |
| 1114 Herberich Ave Akron, OH | 4.0 | 1.0 | 1308 | $1,200 | $0.92 | 43d | 1 | 0.91mi |
| 990 Baird St Akron, OH | 3.0 | 1.0 | 1140 | $1,250 | $1.10 | 43d | 1 | 0.94mi |
Listing history 12 events
-
2026-06-18days on market $109,900 Active 13 DOM
-
2026-06-17days on market $109,900 Active 12 DOM
-
2026-06-16days on market $109,900 Active 11 DOM
-
2026-06-15price $109,900 Active 10 DOM
-
2026-06-15days on market $119,900 Active 10 DOM
-
2026-06-14days on market $119,900 Active 8 DOM
-
2026-06-13days on market $119,900 Active 7 DOM
-
2026-06-10days on market $119,900 Active 5 DOM
-
2026-06-09days on market $119,900 Active 4 DOM
-
2026-06-08days on market $119,900 Active 3 DOM
-
2026-06-07remarks 681-char remark
-
2026-06-07$119,900 Active 2 DOM
ⓘ Source: listings_history table (triggers on properties + properties_extension) + one-shot
backfill from property_details.listing_events for pre-trigger history.
Tax reassessment forecast OH · Partial reset (capped growth)
- Current annual tax
- $1,607 · $134/mo
- Projected year-2 tax
- $1,661 · $138/mo
- Expected delta
- +$54/yr (+$4/mo · 3.3%)
ⓘ Screening estimate from a state-policy table — verify with the county assessor before closing.
Climate risk First Street
- Flood 6/10 Major FEMA zone X (unshaded) · 71% chance over 30 yrs
- Wildfire 1/10 Low
- Heat 3/10 Moderate 7 d/yr ≥96°F today · 17 d/yr by 30 yrs out
- Wind 1/10 Low
- Air quality 3/10 Moderate 2 unhealthy d/yr today · 4 by 30 yrs out
Nearby sold comps map
Loading sold comps map…
Walkable amenities ~0.75 mi
Loading nearby amenities…
Taxation est. · year 1
- Rental income
- $13,947
- − Mortgage interest
- −$6,156
- − Property taxes
- −$1,607
- − Insurance
- −$550
- − Repairs & maintenance
- −$1,116
- − Management
- −$1,116
- − Depreciation
- −$3,197
- Taxable income
- $206
- Est. tax owed @ 24.0%
- −$49
- After-tax cash flow
- $1,896/yr
For passive investors: Depreciation is non-cash, so a rental often shows a tax loss while cash-flowing — sheltering income. Rental losses are passive: they offset passive income freely, and up to $25,000/yr can offset ordinary (W-2) income if you actively participate and your MAGI is under $100k (phasing out to $0 by $150k); unused losses carry forward. On sale, claimed depreciation is recaptured at up to 25%, and gains may owe capital-gains tax (a 1031 exchange can defer both). Figures are a year-1 estimate at your 24.0% rate — not tax advice; consult a CPA.
Schools (NCES district)
- District
- Akron City
- NCES district ID
- 3904348
- Math proficiency
- 22% ▼ -17.00%
- Reading proficiency
- 30% ▼ -12.00%
- Median HH income
- $33,811
- Composite
- 21.31/100
- National rank
- #8383
- State rank
- #602 of 656 in OH
Livability — Akron
- Score
- 81/100
- State rank
- #104
- US rank
- #1591
Category grades
Schools grade is shown separately in the Schools card above.
Census & demographics
- Census place
- Akron, OH
- County
- Summit County · 440,783 people
- City population
- 174,375
- Metro
- Akron, OH
- Population (ZIP)
- 7,547
- Household income
- $24,369
- Rent vs Own
- Severe rent burden
- 659.0
Population outlook (Summit County) Hauer SSP2
- Today (2025)
- 546,583 people
- By 2030
- 544,028 · -0.5%
- By 2040
- 531,363 · -2.8%
- By 2050
- 514,923 · -5.8%
- By 2075
- 481,765 · -11.9%
- By 2100
- 432,265 · -20.9%
Race, ethnicity, and origin ACS 2023
- Neighborhood character
- Diverse neighborhood (Simpson 0.60)
- Race & ethnicity
- White 53% Black 35% Two or more races 6% Hispanic / Latino 4% Asian 3%
- Common ancestry
- Lithuanian 2% Romanian 2% Slovak 2%
- Foreign-born
- 3% · Canada, Vietnam, Philippines
- Languages at home
- 95% English-only · Spanish 2% Other Asian/Pacific 1% Other Indo-European 1%
Political lean MEDSL · Summit
- 2024 margin
- Lean D (+7.0) · D 53.0% · R 46.0%
- 2008→2024 swing
- -9.6pp toward R · 2008: 16.6pp · 2024: 7.0pp
- All cycles
- 2024: D+7.0 2020: D+9.6 2016: D+8.2 2012: D+14.8 2008: D+16.6
Not yet ingested
- Civics
- —
Market trends
- HPI YoY
- ▼ -39.01%
- Current HPI
- 98.3809
- Rent YoY
- —
- Metro
- Akron, OH
- State GDP YoY
- ▲ 1.98%
- F500 in state
- 48
Industry mix (Fortune 500 HQ in OH)
| Industry | F500 HQs | Revenue |
|---|---|---|
| Insurance | 3 | $145B |
|
||
| Industrial Machinery | 3 | $49B |
|
||
| Financial Services | 3 | $24B |
|
||
| Consumer Goods | 2 | $93B |
|
||
| Aerospace / Defense | 2 | $47B |
|
||
| Utilities | 2 | $33B |
|
||
Price history
+726.9% since first listed28 events — show timeline
- 2026-06-05 Listed $119,900 MLSNOW
- 2026-03-01 Listing Removed — MLSNOW
- 2026-01-30 Price Changed $114,900 MLSNOW
- 2025-12-10 Price Changed $118,900 MLSNOW
- 2025-11-07 Price Changed $124,900 MLSNOW
- 2025-10-13 Price Changed $139,900 MLSNOW
- 2025-10-01 Listed $154,900 MLSNOW
- 2025-03-19 Sold (MLS) $40,500 MLSNOW
- 2025-03-11 Pending — MLSNOW
- 2025-03-07 Relisted — MLSNOW
- 2025-03-07 Price Changed $40,000 MLSNOW
- 2025-02-28 Relisted — MLSNOW
- 2025-01-03 Pending — MLSNOW
- 2025-01-02 Price Changed $59,900 MLSNOW
- 2024-12-19 Relisted — MLSNOW
- 2024-08-28 Pending — MLSNOW
- 2024-08-12 Price Changed $64,900 MLSNOW
- 2024-07-22 Price Changed $69,900 MLSNOW
- 2024-07-09 Price Changed $72,500 MLSNOW
- 2024-06-20 Price Changed $75,000 MLSNOW
- 2024-06-17 Relisted — MLSNOW
- 2024-06-07 Pending — MLSNOW
- 2024-05-30 Listed $79,900 MLSNOW
- 2007-08-20 Sold (MLS) $13,000 MLSNOW
- 2007-06-28 Listing Removed — MLSNOW
- 2007-03-28 Listed $15,900 MLSNOW
- 2001-03-13 Sold (Public Records) $34,000 Public Records
- 1990-03-13 Sold (Public Records) $14,500 Public Records
Property tax history
+4.5%/yrLatest (2025): $1,607 · +2.2% YoY. Source: county tax records.
Cash-flow waterfall
monthlySold comps — $/sqft
last 12 mo · ≤1 miLoading sold comps…