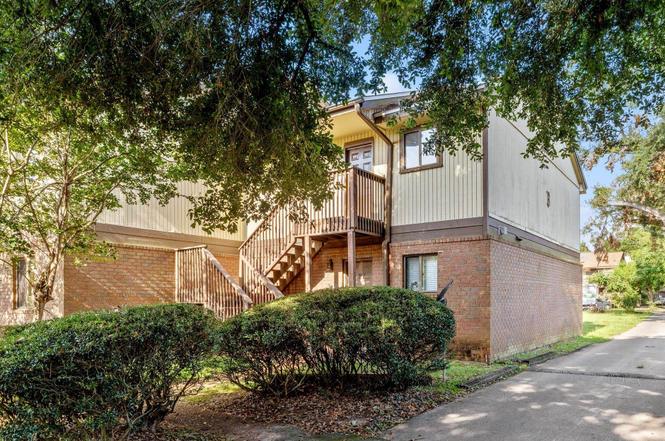
216 Dixie Dr #8 · Tallahassee, FL
Flood risk 1/10 · Minimal
- FEMA flood zone
- X (unshaded)
- Chance of flooding over 30 yrs
- 0.0%
- Est. flood insurance / yr
- $507 – $1,088
Fire risk 2/10 · Minimal
- Est. fire insurance / yr
- $947 – $1,759
Heat risk 9/10 · Severe
- Hot days now (above 108°F)
- 7 days/yr
- Hot days in 30 yrs
- 20 days/yr
Wind risk 9/10 · Severe
- Chance of severe wind over 30 yrs
- 99.0%
Air-quality risk 4/10 · Minor
- Unhealthy air days now
- 5 days/yr
- Unhealthy air days in 30 yrs
- 6 days/yr
Risk factors via First Street. Map © Google.
Why this score? — see what drove the D grade
The composite is a weighted blend of 9 inputs, each scored 0–100. Each bar is that input's sub-score; the figure is the points it added to the 100-point composite (weight × sub-score).
- Cash flow +10.3/30.0
- ARV discount +7.5/15.0
- 1% rule +6.9/10.0
- Schools +4.3/10.0
- Livability +4.3/5.0
- Rent growth +3.7/5.0
- DSCR +3.0/10.0
- Condition / age +2.5/5.0
- Appreciation +0.0/10.0
$89,900
🖨 Deal sheet (PDF) 📄 Offer letter ✓ Due diligence
Listing remarks
Come home to this completely renovated condo! New roof, new flooring, new light fixtures, new granite counter tops, new paint, renovated bathroom, and so much more! Perfect investment for student housing. Close to both campuses, Doak Campbell Stadium, entertainment and restaurants. Enjoy the summertime in the well maintained community pool and enjoy being minutes away from shopping! Move in ready! You don't want to miss this one!
Key facts
- Close to restaurants
- Renovated bathroom
- Community pool
Tags
Property features AI
Finance
- HOA & community: Association fee assessed ($3,300) covering common areas, structure maintenance, and pool(s); Community pool
Exterior
- Parking: Driveway
- Utilities: Has heating; Has cooling
- Home design: Brick construction
- Construction: Brick construction
- Exterior features: Patio; Porch; Screened porch; Paved road access; Private pool (community pool listed as a feature)
Interior
- Kitchen: Dishwasher; Disposal; Oven; Range; Refrigerator
- Bedrooms: Bedroom sizes include a 12x12 room
- Flooring: Plank flooring; Tile flooring; Vinyl flooring
- Bathrooms: 1 full bathroom
- Heating & cooling: Central heating; Electric heating; Wood heating; Central air conditioning; Ceiling fan(s); Electric cooling
- Interior features: Window treatments; Screened porch
- Laundry & utility: Washer; Dryer; Utility room
Neighborhood map
What this means for you Summary
Snapshot
- This is a 1-bed/1.0-bath condo listed at $90k.
Deal economics
- At list price, monthly cash flow is $-49 ($-586/yr) — negative.
- To cash-flow at today's rent, offer at most $83k (7.9% below list).
- Meets the 1% rule at list price ($1k rent vs $90k).
- Recommended offer: $82k (9.0% below list) — sets the bar for market timing.
- Cap rate 5.6% vs local median 4.2% in Tallahassee — top-decile yield for the area; either an underpriced asset or a hidden risk that comps aren't pricing in. Stress-test before assuming the spread holds.
Location & tenants
- Location reads 86/100 on livability (#19 in FL, #429 nationally) — a professional / high-income tenant draw. Strengths: amenities A+, commute A+, health & safety A+; Watch: employment D.
- Leon (urban): math 48% / reading 53% proficiency, ranked #33 of 73 in FL (top 45%) — acceptable for families but not a draw, mixed tenant base, ~2y average lease.
- Zoned schools: Sabal Palm Elementary School (math 29% / reading 35%, grade F, #1,797 of 2,144 statewide, top 86%, 492 students, 80% FRL); R. Frank Nims Middle School (math 20% / reading 24%, grade F, #549 of 571 statewide, top 97%, 609 students, 82% FRL); Amos P. Godby High School (math 24% / reading 32%, grade F, #464 of 667 statewide, top 70%, 1,444 students, 63% FRL) — zoned schools average 75% FRL vs 45% district-wide (30 pts higher); higher-poverty schools than district average — tighter screening recommended.
- Zoned-school proficiency averages 27% at this address vs 50% district-wide (-23 pts) — the specific schools serving this property underperform the Leon average; the district grade overstates school quality for this exact location.
- Market conditions: Rents rising fast (+4.7%/yr); 142 active listings in the ZIP; 19 comparable units currently listed for rent nearby; rentals at typical pace (median 23d on market — plan ~3-4 weeks tenant-placement turnaround); lower-income renter base — watch delinquency; 1,765 units permitted in Leon County in 2024 (975 in 5+ unit buildings).
- This rent runs 40% of the median local income ($32k/yr) — at the standard rent-burdened threshold; future hikes will face affordability resistance.
Forward outlook
- Local home prices are declining (-3.0%/yr); year-one equity from $622 of loan paydown is wiped out by about $3k of value loss. Plan a longer hold.
- Leon County population projected at +23% by 2050 — long-run rental-demand tailwind backs the buy-and-hold thesis.
Negotiation context
- It's been on market 110 days — a 9% lower offer ($82k) is reasonable based on typical stale-listing flexibility.
- 8 sale attempts since 2y ago with the ask held roughly flat each time — persistent listings suggest the price (not the market) is what's stuck; bring a comps-based counter.
Risks & watch-outs
- Watch-outs: HOA is 26% of rent.
- Climate carrying-cost: severe wind risk, 99% chance of damaging wind over 30y; extreme-heat days projected 7→20/yr by 2055 (HVAC capex compounding) — expect insurance premiums to compound above CPI over the hold.
Questions for the listing agent
- What do current leases actually rent for vs. the listed asking? Can we see a recent rent roll and the last 12 months of T-12 income?
- It's been on market 110 days. Have you received any prior offers? Is the seller open to a 9% concession, seller financing, or rate buy-down credit?
- What does the HOA fee cover, when was the last increase, and are there any pending special assessments or reserve-fund shortfalls?
- Any open or pending special assessments — roof, HVAC, plumbing, elevator, façade? What's the per-unit balance and payoff schedule, and is the seller paying it off at close or rolling it to the buyer?
- Why hasn't it sold? Are there any deal-killer items the seller is aware of (foundation, flood, title, zoning, code violations)?
- Is there a deadline driving the sale (1031 exchange, divorce, estate, relocation)? That informs how much negotiation room exists.
- Schools are B-rated — typically a magnet for longer-tenancy family renters. What's the average tenant stay here, and is there a school-zone premium baked into asking?
- The area grade is low — what's the realistic commute time and amenity access for the typical tenant pool here? Any planned neighborhood developments (good or bad) we should know about?
- What's the average days-on-market for RENTAL listings here right now (not sales)? A rising rental-DOM trend means longer vacancies and softer asking-rent achievability than the comps imply.
- What's the recent tenant-quality profile in this submarket — average credit score on applications, eviction rate, late-payment / NSF rate, and stable-employment percentage? A property-management company in the area should have these aggregated.
- How much new apartment / multifamily construction is in the pipeline within 1–3 miles? Heavy new supply (>2% of stock underway) typically softens rents 12–24 months out; light construction supports rent growth.
Investment metrics
- 1% rule
- 1.19% ✓
- Cap rate
- 5.64%
- Cash-on-cash
- -2.33%
- DSCR
- 0.90
- GRM
- 7.0
CMA / ARV
No comps found within radius.
Projected returns pro-forma
-3.0% appreciation · 4.69% rent growth · sell at horizon
- IRR
- -17.2%
- Equity multiple
- 0.38×
- Total profit
- $-15,638
- Equity at exit
- $13,404
- IRR
- -4.9%
- Equity multiple
- 0.64×
- Total profit
- $-8,992
- Equity at exit
- $7,773
Cash invested: $25,172 (down + closing). Projections, not guarantees.
Landlord ↔ Tenant lean methodology
- Overall (STATE)
- 87 Strongly Landlord-Friendly
- State Florida
- 87 Strongly Landlord-Friendly · R+3
- County
- — inherits STATE
- City
- — inherits STATE
ZIP-level market 32304
- Home prices YoY
- -21.2%
- Rents YoY
- 4.7%
- Active inventory
- 142
- Price-to-rent
- 7.0×
Monthly cashflow live
- Estimated rent
- $1,073 high interval (Pro) →
- Mortgage (P&I)
- −$471
- Tax est. 1.5%
- −$112 /mo · $1,348/yr
- Insurance
- −$37
- HOA
- −$275
- Vacancy / Maint / Mgmt
- −$225
- Net cashflow
- $-49
Break-even live
Sensitivity live
| Price | -10% $13 | -5% $-18 | +0% $-49 | +5% $-80 | +10% $-111 |
|---|---|---|---|---|---|
| Rent | -10% $-134 | -5% $-91 | +0% $-49 | +5% $-6 | +10% $36 |
| Rate | -1.0pp $-4 | -0.5pp $-26 | base $-49 | +0.5pp $-72 | +1.0pp $-96 |
UW: 25.0% down · 7.5% · 30yr · 1.5% tax · 5.0% vac · 8.0% maint · 8.0% mgmt
Financing live
Cash to close
- Down payment
- $22,475
- Closing costs
- $2,697
- Reserves months
- —
- Total cash needed
- —
Loan-product check · same deal, 3 products live
Conventional
25% down · 7.5% · 30yr
- Down + closing
- —
- Monthly P&I
- —
- Monthly cashflow
- —
- DSCR
- —
- Eligible?
- —
Personal DTI + credit; lowest rate.
DSCR
20% down · 8.5% · 30yr
- Down + closing
- —
- Monthly P&I
- —
- Monthly cashflow
- —
- DSCR
- —
- Eligible?
- —
No personal income docs; deal must DSCR.
Hard money
10% down · 12.0% · 12mo
- Down + closing
- —
- Monthly P&I
- —
- Monthly cashflow
- —
- DSCR
- —
- Eligible?
- —
Short-term bridge; refi at stabilization.
Rent comps 19 comps
| Address | Beds | Baths | Sqft | Rent | $/sqft | DOM | Units | Dist |
|---|---|---|---|---|---|---|---|---|
| 218 White Dr Tallahassee, FL | 1.0 | 1.0 | 660 | $995 | $1.51 | 23d | 1 | 0.20mi |
| 214 White Dr Unit F Tallahassee, FL | 1.0 | 1.0 | 656 | $1,200 | $1.83 | 23d | 1 | 0.22mi |
| 103 Cactus St Tallahassee, FL | 2.0–4.0 | 1.0–2.0 | 1000 | $1,195 | $1.20 | 15d | 3 | 0.24mi |
| 205 White Dr Tallahassee, FL | 1.0–4.0 | 1.0–4.0 | 1155 | $479 | $0.41 | 23d | 1 | 0.26mi |
| 2349 Horne Ave Unit C Tallahassee, FL | 2.0 | 1.0 | 680 | $1,100 | $1.62 | 15d | 1 | 0.43mi |
| 2416 Jackson Bluff Rd Tallahassee, FL | 1.0 | 1.0 | 540 | $800 | $1.48 | 23d | 1 | 0.63mi |
| 316 Ausley Rd Tallahassee, FL | 1.0–4.0 | 1.0–2.0 | 750 | $399 | $0.53 | 15d | 8 | 0.76mi |
| 2614 W Tennessee St Tallahassee, FL | 1.0–4.0 | 1.0–4.0 | 1270 | $763 | $0.60 | 23d | 14 | 0.80mi |
| 2125 Jackson Bluff Rd Tallahassee, FL | 1.0–3.0 | 1.0–2.0 | 975 | $945 | $0.97 | 23d | 4 | 0.91mi |
| 2616 Mission Rd Tallahassee, FL | 1.0–2.0 | 1.0 | 750 | $965 | $1.29 | 15d | 12 | 0.95mi |
| 1001 Ocala Rd Tallahassee, FL | 4.0 | 1.0–2.0 | 899 | $526 | $0.59 | 23d | 6 | 1.00mi |
| 207 Lovelace Dr #5 Tallahassee, FL | 1.0 | 1.0 | 480 | $800 | $1.67 | 23d | 1 | 1.09mi |
| 215 Lovelace Dr Unit 11 Tallahassee, FL | 1.0 | 1.0 | 480 | $800 | $1.67 | 23d | 1 | 1.10mi |
| 1303 Ocala Rd Tallahassee, FL | 1.0–4.0 | 1.0–2.0 | 1121 | $1,195 | $1.07 | 15d | 48 | 1.21mi |
| 1380 Ocala Rd Tallahassee, FL | 1.0 | 1.0 | 700 | $975 | $1.39 | 23d | 1 | 1.23mi |
| 2020 Continental Ave Tallahassee, FL | 1.0–2.0 | 1.0–1.5 | 850 | $1,000 | $1.18 | 23d | 3 | 1.24mi |
| 394 Prince St Unit 394-PRI Tallahassee, FL | 1.0 | 1.0 | 600 | $1,250 | $2.08 | 23d | 1 | 1.31mi |
| 1109 Greentree Ct Tallahassee, FL | 1.0 | 1.0 | 400 | $485 | $1.21 | 23d | 1 | 1.36mi |
| 253 Hayden Rd Tallahassee, FL | 1.0 | 1.0 | 495 | $1,400 | $2.83 | 15d | 3 | 1.42mi |
HOA detail condo
- Monthly dues
- $275 · $3,300/yr
- Likely covers
- pool
- Assessments
- None detected in remarks — confirm with the listing agent.
Listing history 31 events
-
2026-06-22days on market $89,900 Active 110 DOM
-
2026-06-18days on market $89,900 Active 107 DOM
-
2026-06-17days on market $89,900 Active 106 DOM
-
2026-06-16days on market $89,900 Active 105 DOM
-
2026-06-15days on market $89,900 Active 104 DOM
-
2026-06-14days on market $89,900 Active 102 DOM
-
2026-06-10days on market $89,900 Active 99 DOM
-
2026-06-09days on market $89,900 Active 98 DOM
-
2026-06-08days on market $89,900 Active 97 DOM
-
2026-06-07days on market $89,900 Active 96 DOM
-
2026-06-05days on market $89,900 Active 93 DOM
-
2026-06-03days on market $89,900 Active 92 DOM
-
2026-06-02days on market $89,900 Active 91 DOM
-
2026-06-01days on market $89,900 Active 90 DOM
-
2026-05-31days on market $89,900 Active 89 DOM
-
2026-05-30days on market $89,900 Active 88 DOM
-
2026-03-03$89,900 Active
-
2026-02-25historical
-
2025-10-21status Active
-
2025-10-06historical Contingent
-
2025-07-03$89,900 Active
-
2025-07-03historical
-
2025-05-05$94,999 Active
-
2025-05-05historical
-
2025-02-14$95,000 Active
-
2025-02-14historical
-
2024-11-15$99,900 Active
-
2024-11-15historical
-
2024-09-02$104,900 Active
-
2024-09-02historical
-
2024-08-04$109,900 Active
ⓘ Source: listings_history table (triggers on properties + properties_extension) + one-shot
backfill from property_details.listing_events for pre-trigger history.
Climate risk First Street
- Flood 1/10 Low FEMA zone X (unshaded) · 0% chance over 30 yrs
- Wildfire 2/10 Low
- Heat 9/10 Extreme 7 d/yr ≥108°F today · 20 d/yr by 30 yrs out
- Wind 9/10 Extreme 99% chance of damaging wind over 30 yrs
- Air quality 4/10 Moderate 5 unhealthy d/yr today · 6 by 30 yrs out
Nearby sold comps map
Loading sold comps map…
Walkable amenities ~0.75 mi
Loading nearby amenities…
Taxation est. · year 1
- Rental income
- $12,873
- − Mortgage interest
- −$5,036
- − Property taxes
- −$1,348
- − Insurance
- −$450
- − Repairs & maintenance
- −$1,030
- − Management
- −$1,030
- − HOA
- −$3,300
- − Depreciation
- −$2,615
- Taxable loss
- −$1,936
- Est. tax savings @ 24.0%
- +$465
- After-tax cash flow
- $-121/yr
For passive investors: Depreciation is non-cash, so a rental often shows a tax loss while cash-flowing — sheltering income. Rental losses are passive: they offset passive income freely, and up to $25,000/yr can offset ordinary (W-2) income if you actively participate and your MAGI is under $100k (phasing out to $0 by $150k); unused losses carry forward. On sale, claimed depreciation is recaptured at up to 25%, and gains may owe capital-gains tax (a 1031 exchange can defer both). Figures are a year-1 estimate at your 24.0% rate — not tax advice; consult a CPA.
Schools (NCES district)
- District
- Leon
- NCES district ID
- 1201110
- Math proficiency
- 48% ▼ -13.00%
- Reading proficiency
- 53% ▼ -5.00%
- Median HH income
- $46,339
- Composite
- 42.84/100
- National rank
- #3131
- State rank
- #33 of 73 in FL
Livability — Tallahassee
- Score
- 86/100
- State rank
- #19
- US rank
- #429
Category grades
Schools grade is shown separately in the Schools card above.
Census & demographics
- Census place
- Tallahassee, FL
- County
- Leon County · 294,472 people
- City population
- 294,472
- Metro
- Tallahassee, FL
- Population (ZIP)
- 51,673
- Household income
- $32,348
- Rent vs Own
- Severe rent burden
- 6995.0
Population outlook (Leon County) Hauer SSP2
- Today (2025)
- 315,507 people
- By 2030
- 330,677 · +4.8%
- By 2040
- 358,465 · +13.6%
- By 2050
- 386,804 · +22.6%
- By 2075
- 465,480 · +47.5%
- By 2100
- 519,959 · +64.8%
Race, ethnicity, and origin ACS 2023
- Neighborhood character
- Diverse neighborhood (Simpson 0.65)
- Race & ethnicity
- White 45% Black 36% Hispanic / Latino 10% Two or more races 7% Asian 4%
- Hispanic origin (detail)
- Mexican 2% Puerto Rican 2% Cuban 2%
- Common ancestry
- Romanian 2% Lithuanian 1% Italian 1%
- Foreign-born
- 8% · Canada, China
- Languages at home
- 86% English-only · Spanish 7% Other Indo-European 2% French/Haitian/Cajun 1%
Political lean MEDSL · Leon
- 2024 margin
- Strong D (+21.8) · D 60.3% · R 38.5% · Other 1.2%
- 2008→2024 swing
- -2.5pp toward R · 2008: 24.3pp · 2024: 21.8pp
- All cycles
- 2024: D+21.8 2020: D+28.3 2016: D+25.1 2012: D+23.6 2008: D+24.3
Not yet ingested
- Civics
- —
Market trends
- HPI YoY
- ▼ -72.04%
- Current HPI
- 267.8426
- Rent YoY
- ▲ 4.69%
- Metro
- Tallahassee, FL
- State GDP YoY
- ▲ 3.28%
- F500 in state
- 36
Industry mix (Fortune 500 HQ in FL)
| Industry | F500 HQs | Revenue |
|---|---|---|
| Industrial Technology | 2 | $29B |
|
||
| Insurance | 2 | $17B |
|
||
| Retail | 1 | $60B |
|
||
| Technology Distribution | 1 | $58B |
|
||
| Homebuilding | 1 | $35B |
|
||
| Technology Manufacturing | 1 | $35B |
|
||
Price history
-18.2% since first listed15 events — show timeline
- 2026-03-03 Listed $89,900 CATRS
- 2026-02-25 Listing Removed — CATRS
- 2025-10-21 Relisted — CATRS
- 2025-10-06 Contingent — CATRS
- 2025-07-03 Listing Removed — CATRS
- 2025-07-03 Listed $89,900 CATRS
- 2025-05-05 Listing Removed — CATRS
- 2025-05-05 Listed $94,999 CATRS
- 2025-02-14 Listing Removed — CATRS
- 2025-02-14 Listed $95,000 CATRS
- 2024-11-15 Listing Removed — CATRS
- 2024-11-15 Listed $99,900 CATRS
- 2024-09-02 Listing Removed — CATRS
- 2024-09-02 Listed $104,900 CATRS
- 2024-08-04 Listed $109,900 CATRS
Cash-flow waterfall
monthlySold comps — $/sqft
last 12 mo · ≤1 miLoading sold comps…