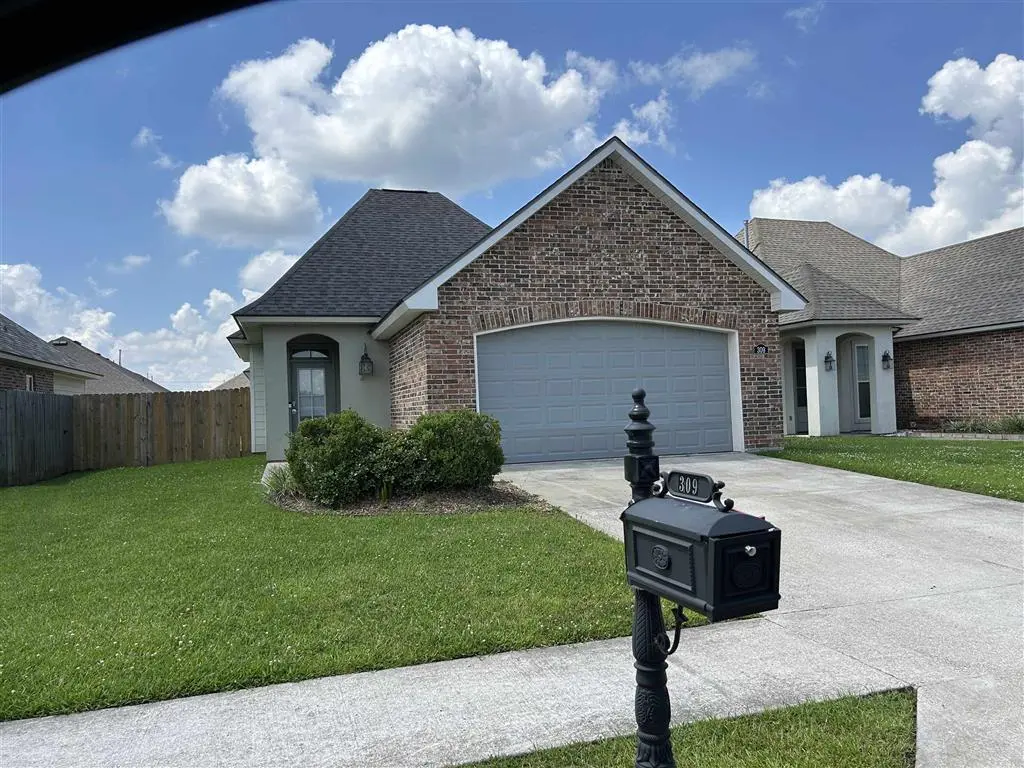
309 Paisley Pkwy · Sulphur, LA
Flood risk 4/10 · Minor
- FEMA flood zone
- X (unshaded)
- Chance of flooding over 30 yrs
- 0.13%
- Est. flood insurance / yr
- $507 – $1,088
Fire risk 3/10 · Minor
- Est. fire insurance / yr
- $1,269 – $2,357
Heat risk 9/10 · Severe
- Hot days now (above 109°F)
- 7 days/yr
- Hot days in 30 yrs
- 23 days/yr
Wind risk 9/10 · Severe
- Chance of severe wind over 30 yrs
- 99.0%
Air-quality risk 2/10 · Minimal
- Unhealthy air days now
- 1 days/yr
- Unhealthy air days in 30 yrs
- 1 days/yr
Risk factors via First Street. Map © Google.
Why this score? — see what drove the B- grade
The composite is a weighted blend of 9 inputs, each scored 0–100. Each bar is that input's sub-score; the figure is the points it added to the 100-point composite (weight × sub-score).
- Cash flow +30.0/30.0
- 1% rule +10.0/10.0
- DSCR +10.0/10.0
- ARV discount +5.6/15.0
- Livability +3.6/5.0
- Schools +3.1/10.0
- Rent growth +2.5/5.0
- Condition / age +2.5/5.0
- Appreciation +0.0/10.0
$224,000
🖨 Deal sheet (PDF) 📄 Offer letter ✓ Due diligence
Listing remarks
This 3 bed 2 bath home with great amenities to match. The home offers a split and open floor plan. The living room is inviting and homey and features custom beams on the ceiling. Living area flows effortlessly into the dining room and kitchen so when hosting game night or entertaining family and friends everyone feels included. The kitchen features stainless steel appliances, island with seating, and large walk-in pantry. Spacious master suite with his/her closets, dual sinks, separate soaking tub and walk-in shower. Two more generous sized bedrooms & bath are off the living room. Full sized laundry room and 2 car garage. Just across the street is the entrance to a neighborhood pond w
Key facts
- Dual sinks
- Island with seating
- Large walk-in pantry
Tags
Property features AI
Finance
- Other: Accessible features noted (accessible full bath)
- HOA & community: Dog park; Community street lights
Exterior
- Parking: Attached garage; Open parking; Garage
- Utilities: Public water; Public sewer; Electricity connected; Sewer connected; Water connected; Cable available; Phone not available
- Home design: Single-family house; One-story; Faces east
- Construction: Brick and HardiPlank-style siding; Shingle roof; Slab foundation; Built as a residential single-family residence
- Exterior features: Patio; Paved road frontage on a city street; Has a view; Street lights in the community
Interior
- Kitchen: Built-in range; Dishwasher; Microwave; Refrigerator; Range hood; Granite counters; Kitchen island
- Bedrooms: 3 bedrooms on the main level
- Bathrooms: 2 full bathrooms (both on the main level)
- Heating & cooling: Central heating (electric); Central air conditioning
- Interior features: Beamed ceilings; Ceiling fan(s); Granite counters; Kitchen island; Open floorplan; Soaking tub; Double vanity; Accessible full bath
- Laundry & utility: Electric dryer hookup; Electric water heater
Neighborhood map
What this means for you Summary
Snapshot
- This is a 3-bed/2.0-bath single-family listed at $224k.
Deal economics
- At list price, monthly cash flow is $1k ($17k/yr) — positive.
- The deal already cash-flows at list — no discount required.
- Meets the 1% rule at list price ($4k rent vs $224k).
- Recommended offer: $221k (1.5% below list) — sets the bar for market timing.
- Cap rate 13.9% vs local median 8.8% in Sulphur — top-decile yield for the area; either an underpriced asset or a hidden risk that comps aren't pricing in. Stress-test before assuming the spread holds.
Location & tenants
- Location reads 71/100 on livability (#48 in LA) — a middle-class / working-renter tenant base. Strengths: cost of living A+, housing A+, health & safety A; Watch: crime D-, amenities F, commute F.
- Calcasieu Parish (other): math 30% / reading 44% proficiency, ranked #29 of 98 in LA (top 30%) — families likely to look elsewhere, expect single-tenant / working-renter base with shorter leases.
- Zoned schools: Sulphur High School (math 36% / reading 53%, grade F, #58 of 265 statewide, top 23%, 2,043 students, 47% FRL).
- Market conditions: 236 active listings in the ZIP; 3 comparable units currently listed for rent nearby; rentals lingering (median 45d on market — plan ~5-8 weeks vacancy on turnover, expect pricing pressure); 67% of comp listings sitting > 30 days — soft ceiling on asking rent; 1,298 units permitted in Calcasieu Parish in 2024 (526 in 5+ unit buildings).
Forward outlook
- Local home prices are declining (-3.0%/yr); year-one equity from $2k of loan paydown is wiped out by about $7k of value loss. Plan a longer hold.
- Calcasieu County population projected at +11% by 2050 — modest demand growth; plan on rents tracking national, not racing it.
- At projected returns (-3.0% appreciation + 3.0% rent growth), your $63k cash investment doubles in ~5 years — after that, you're playing with house money.
Negotiation context
- It's been on market 23 days — a 2% lower offer ($221k) is reasonable based on typical stale-listing flexibility.
- 2 sale attempts since 3y ago; this cycle's ask has dropped $14k (6%) from the opening price — seller is motivated, your offer sets the floor, not the list.
Risks & watch-outs
- Climate carrying-cost: severe wind risk, 99% chance of damaging wind over 30y; extreme-heat days projected 7→23/yr by 2055 (HVAC capex compounding) — expect insurance premiums to compound above CPI over the hold.
Questions for the listing agent
- Is there a deadline driving the sale (1031 exchange, divorce, estate, relocation)? That informs how much negotiation room exists.
- Schools are A-rated — typically a magnet for longer-tenancy family renters. What's the average tenant stay here, and is there a school-zone premium baked into asking?
- Crime grade is D in this area — have there been break-ins, vandalism, or insurance claims at this property in the last 3 years? What carrier currently insures it and at what premium?
- What's the average days-on-market for RENTAL listings here right now (not sales)? A rising rental-DOM trend means longer vacancies and softer asking-rent achievability than the comps imply.
- What's the recent tenant-quality profile in this submarket — average credit score on applications, eviction rate, late-payment / NSF rate, and stable-employment percentage? A property-management company in the area should have these aggregated.
- How much new for-sale + rental construction is in the pipeline within 1–3 miles? Heavy new supply typically softens prices + rents 12–24 months out; constrained supply supports both.
Investment metrics
- 1% rule
- 1.63% ✓
- Cap rate
- 13.91%
- Cash-on-cash
- 27.20%
- DSCR
- 2.21
- GRM
- 5.1
CMA / ARV
- ARV (on-the-fly)
- $214,802
- Comps found
- 12
Show comp detail 12 sales within ~0.75 mi
| Address | Dist | Beds/Ba | Sqft | Sold | Price | $/sf | Match |
|---|---|---|---|---|---|---|---|
| 305 Paisley Pkwy | 0.01mi | 3/2.0 | 1,618 (+1%) | 4mo | $217,000 | $134 | 95 |
| 277 Paisley Pkwy | 0.09mi | 3/2.0 | 1,616 (+1%) | 2mo | $214,000 | $132 | 93 |
| 235 Aston Ln | 0.06mi | 3/2.0 | 1,563 (-2%) | 10mo | $214,000 | $137 | 85 |
| 308 Paisley Pkwy | 0.04mi | 3/2.0 | 1,755 (+10%) | 3mo | $233,000 | $133 | 80 |
| 216 Pipers Ln | 0.15mi | 3/2.0 | 1,738 (+8%) | 3mo | $240,000 | $138 | 76 |
| 148 Orchard Ln | 0.24mi | 3/2.0 | 1,514 (-6%) | 7mo | $207,000 | $137 | 74 |
| 329 Paisley Pkwy | 0.05mi | 3/2.0 | 1,826 (+14%) | 2mo | $221,000 | $121 | 72 |
| 109 Briar Ct | 0.49mi | 3/2.0 | 1,642 (+2%) | 7mo | $212,500 | $129 | 67 |
| 248 Long Hill Dr Dr | 0.40mi | 3/2.0 | 1,698 (+6%) | 7mo | $205,000 | $121 | 66 |
| 309 Sawyer Dr | 0.04mi | 4/2.0 (+1) | 1,786 (+11%) | 11mo | $239,500 | $134 | 64 |
| 213 Pipers Ln | 0.13mi | 4/2.0 (+1) | 1,817 (+13%) | 4mo | $248,000 | $136 | 63 |
| 337 Madison Xing | 0.38mi | 3/2.0 | 1,452 (-9%) | 8mo | $208,000 | $143 | 60 |
Match score weights: distance 35% · size 25% · config 20% · recency 20%. Top-matched comps best support the ARV.
Projected returns pro-forma
-3.0% appreciation · 3.0% rent growth · sell at horizon
- IRR
- 21.2%
- Equity multiple
- 1.86×
- Total profit
- $54,241
- Equity at exit
- $33,399
- IRR
- 29.3%
- Equity multiple
- 3.61×
- Total profit
- $163,810
- Equity at exit
- $19,367
Cash invested: $62,720 (down + closing). Projections, not guarantees.
Landlord ↔ Tenant lean methodology
- Overall (STATE)
- 90 Strongly Landlord-Friendly
- State Louisiana
- 90 Strongly Landlord-Friendly · R+12
- County
- — inherits STATE
- City
- — inherits STATE
ZIP-level market 70665
- Active inventory
- 236
- Price-to-rent
- 5.1×
Monthly cashflow live
- Estimated rent
- $3,642 medium interval (Pro) →
- Mortgage (P&I)
- −$1,175
- Tax from tax record
- −$188 /mo · $2,255/yr
- Insurance
- −$93
- HOA
- −$0
- Vacancy / Maint / Mgmt
- −$765
- Net cashflow
- $1,422
Break-even live
Sensitivity live
| Price | -10% $1,548 | -5% $1,485 | +0% $1,422 | +5% $1,358 | +10% $1,295 |
|---|---|---|---|---|---|
| Rent | -10% $1,134 | -5% $1,278 | +0% $1,422 | +5% $1,565 | +10% $1,709 |
| Rate | -1.0pp $1,534 | -0.5pp $1,479 | base $1,422 | +0.5pp $1,364 | +1.0pp $1,304 |
UW: 25.0% down · 7.5% · 30yr · 1.5% tax · 5.0% vac · 8.0% maint · 8.0% mgmt
Financing live
Cash to close
- Down payment
- $56,000
- Closing costs
- $6,720
- Reserves months
- —
- Total cash needed
- —
Loan-product check · same deal, 3 products live
Conventional
25% down · 7.5% · 30yr
- Down + closing
- —
- Monthly P&I
- —
- Monthly cashflow
- —
- DSCR
- —
- Eligible?
- —
Personal DTI + credit; lowest rate.
DSCR
20% down · 8.5% · 30yr
- Down + closing
- —
- Monthly P&I
- —
- Monthly cashflow
- —
- DSCR
- —
- Eligible?
- —
No personal income docs; deal must DSCR.
Hard money
10% down · 12.0% · 12mo
- Down + closing
- —
- Monthly P&I
- —
- Monthly cashflow
- —
- DSCR
- —
- Eligible?
- —
Short-term bridge; refi at stabilization.
Rent comps 3 comps
| Address | Beds | Baths | Sqft | Rent | $/sqft | DOM | Units | Dist |
|---|---|---|---|---|---|---|---|---|
| 293 Sawyer Dr Sulphur, LA | 4.0 | 2.0 | 2079 | $4,400 | $2.12 | 45d | 1 | 0.09mi |
| 1000 E Carlyss Blvd Sulphur, LA | 1.0–3.0 | 1.0–2.0 | 966 | $2,296 | $2.38 | 14d | 10 | 0.17mi |
| 1141 Mosswood Dr Sulphur, LA | 2.0–3.0 | 2.0–3.5 | 1332 | $2,195 | $1.65 | 45d | 1 | 1.12mi |
Listing history 19 events
-
2026-06-21days on market $224,000 Active 23 DOM
-
2026-06-19days on market $224,000 Active 21 DOM
-
2026-06-18days on market $224,000 Active 20 DOM
-
2026-06-17days on market $224,000 Active 19 DOM
-
2026-06-16days on market $224,000 Active 18 DOM
-
2026-06-15price $224,000 Active 17 DOM
-
2026-06-15days on market $237,500 Active 17 DOM
-
2026-06-14days on market $237,500 Active 15 DOM
-
2026-06-13days on market $237,500 Active 14 DOM
-
2026-06-10days on market $237,500 Active 12 DOM
-
2026-06-09days on market $237,500 Active 11 DOM
-
2026-06-08days on market $237,500 Active 10 DOM
-
2026-06-07days on market $237,500 Active 9 DOM
-
2026-06-05days on market $237,500 Active 6 DOM
-
2026-06-02days on market $237,500 Active 4 DOM
-
2026-06-01days on market $237,500 Active 3 DOM
-
2026-05-31days on market $237,500 Active 2 DOM
-
2026-05-30remarks 695-char remark
-
2026-05-30$237,500 Active 1 DOM
ⓘ Source: listings_history table (triggers on properties + properties_extension) + one-shot
backfill from property_details.listing_events for pre-trigger history.
Tax reassessment forecast LA · Resets to sale price
- Current annual tax
- $2,255 · $188/mo
- Projected year-2 tax
- $2,255 · $188/mo
- Expected delta
- $0/yr ($0/mo · 0.0%)
ⓘ Screening estimate from a state-policy table — verify with the county assessor before closing.
Climate risk First Street
- Flood 4/10 Moderate FEMA zone X (unshaded) · 13% chance over 30 yrs
- Wildfire 3/10 Moderate
- Heat 9/10 Extreme 7 d/yr ≥109°F today · 23 d/yr by 30 yrs out
- Wind 9/10 Extreme 99% chance of damaging wind over 30 yrs
- Air quality 2/10 Low 1 unhealthy d/yr today · 1 by 30 yrs out
Nearby sold comps map
Loading sold comps map…
Walkable amenities ~0.75 mi
Loading nearby amenities…
Taxation est. · year 1
- Rental income
- $43,708
- − Mortgage interest
- −$12,547
- − Property taxes
- −$2,255
- − Insurance
- −$1,120
- − Repairs & maintenance
- −$3,497
- − Management
- −$3,497
- − Depreciation
- −$6,516
- Taxable income
- $14,276
- Est. tax owed @ 24.0%
- −$3,426
- After-tax cash flow
- $13,632/yr
For passive investors: Depreciation is non-cash, so a rental often shows a tax loss while cash-flowing — sheltering income. Rental losses are passive: they offset passive income freely, and up to $25,000/yr can offset ordinary (W-2) income if you actively participate and your MAGI is under $100k (phasing out to $0 by $150k); unused losses carry forward. On sale, claimed depreciation is recaptured at up to 25%, and gains may owe capital-gains tax (a 1031 exchange can defer both). Figures are a year-1 estimate at your 24.0% rate — not tax advice; consult a CPA.
Schools (NCES district)
- District
- Calcasieu Parish
- NCES district ID
- 2200330
- Math proficiency
- 30% ▼ -39.00%
- Reading proficiency
- 44% ▼ -33.00%
- Median HH income
- $44,700
- Composite
- 31.45/100
- National rank
- #5979
- State rank
- #29 of 98 in LA
Livability — Sulphur
- Score
- 71/100
- State rank
- #48
- US rank
- #7164
Category grades
Schools grade is shown separately in the Schools card above.
Census & demographics
- Census place
- Sulphur, LA
- City population
- 27,799
- Population (ZIP)
- 12,891
Population outlook (Calcasieu County) Hauer SSP2
- Today (2025)
- 212,179 people
- By 2030
- 218,199 · +2.8%
- By 2040
- 228,486 · +7.7%
- By 2050
- 236,208 · +11.3%
- By 2075
- 251,696 · +18.6%
- By 2100
- 247,848 · +16.8%
Race, ethnicity, and origin ACS 2023
- Neighborhood character
- Predominantly White (87%)
- Race & ethnicity
- White 87% Hispanic / Latino 6% Two or more races 4% Black 3%
- Hispanic origin (detail)
- Mexican 4%
- Common ancestry
- Lithuanian 8% Italian 3% Slovak 2%
- Foreign-born
- 3% · Canada
- Languages at home
- 92% English-only · Spanish 6% French/Haitian/Cajun 1% Other Indo-European 1%
Political lean MEDSL · Calcasieu
- 2024 margin
- Solid R (+39.6) · D 29.5% · R 69.0% · Other 1.5%
- 2008→2024 swing
- -15.0pp toward R · 2008: -24.6pp · 2024: -39.6pp
- All cycles
- 2024: R+39.6 2020: R+35.2 2016: R+33.3 2012: R+28.7 2008: R+24.6
Not yet ingested
- Civics
- —
Market trends
- HPI YoY
- ▼ -91.65%
- Current HPI
- 99.2379
- Rent YoY
- —
- Metro
- —
- State GDP YoY
- ▲ 3.29%
- F500 in state
- 10
Industry mix (Fortune 500 HQ in LA)
| Industry | F500 HQs | Revenue |
|---|---|---|
| Telecommunications | 2 | $23B |
|
||
| Utilities | 1 | $12B |
|
||
| Wholesale / Distribution | 1 | $5B |
|
||
| Advertising | 1 | $2B |
|
||
Price history
+10.2% since first listed5 events — show timeline
- 2026-05-29 Listed $237,500 SWLAR
- 2024-01-31 Rental Removed $1,650 APPFOLIO
- 2023-12-08 Listed for Rent $1,650 APPFOLIO
- 2021-06-23 Sold (Public Records) $219,900 Public Records
- 2017-06-19 Sold (Public Records) $215,500 Public Records
Property tax history
-0.2%/yrLatest (2025): $2,255 · +0.8% YoY. Source: county tax records.
Cash-flow waterfall
monthlySold comps — $/sqft
last 12 mo · ≤1 miLoading sold comps…