 Multi-family
402, 406, 410 Warren St · Fayetteville, NC
Flood risk No data
- FEMA flood zone
- —
- Chance of flooding over 30 yrs
- —
- Est. flood insurance / yr
- —
Fire risk No data
- Est. fire insurance / yr
- —
Heat risk No data
- Hot days now (above threshold)
- —
- Hot days in 30 yrs
- —
Wind risk No data
- Chance of severe wind over 30 yrs
- —
Air-quality risk No data
- Unhealthy air days now
- —
- Unhealthy air days in 30 yrs
- —
Risk factors via First Street. Map © Google.
Why this score? — see what drove the B+ grade
The composite is a weighted blend of 9 inputs, each scored 0–100. Each bar is that input's sub-score; the figure is the points it added to the 100-point composite (weight × sub-score).
- Cash flow +30.0/30.0
- 1% rule +10.0/10.0
- DSCR +10.0/10.0
- Appreciation +10.0/10.0
- ARV discount +7.5/15.0
- Livability +3.8/5.0
- Schools +3.1/10.0
- Rent growth +2.5/5.0
- Condition / age +2.5/5.0
$389,000
🖨 Deal sheet 📄 Offer letter ✓ Due diligence
Multi-family units
County records classify this as Multi-Family (2-4 Unit). Listing-text estimate: 1 unit. estimate disagrees with records
Listing remarks
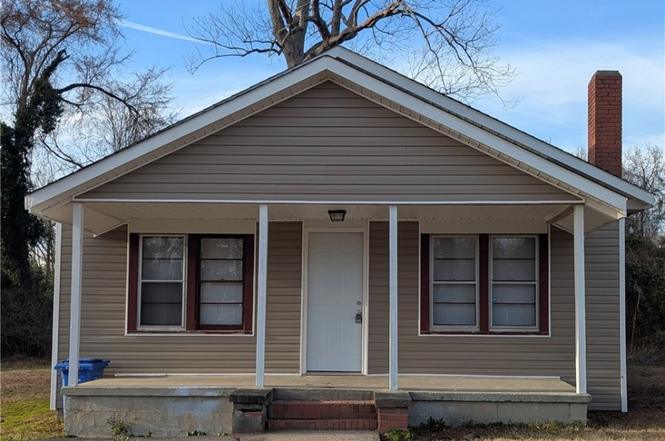
Opportunity knocks at 402, 406 & 410 Warren St. ! 3 seperate single story units all tenant occupied, currently bringing in $3450 monthly income. All units renovated in 2024 to include new HVACs, new roofs and cosmetic updates. Unit 410 not pictured but renovated similarly to the other pictured units. All photos taken prior to tenants taking occupancy. 24 hour notice required to show.
Key facts
- New hvacs
- New roofs
- Single story units
Tags
Property features AI
Finance
- Other: Address: 402, 406, 410 Warren St, Fayetteville, NC 28312; Listed by RE/MAX REAL ESTATE SERVICE
Exterior
- Utilities: Public water; Public sewer
- Home design: Multi-family residential income property; One story
- Construction: Built as multi-family (details not provided)
- Exterior features: Public water; Public sewer
Interior
- Bedrooms: Multiple dwelling units (multi-family property)
- Interior features: One-level layout
Neighborhood map
What this means for you Summary
Snapshot
- This is a multifamily listed at $389k.
Deal economics
- At list price, monthly cash flow is $7k ($81k/yr) — positive.
- The deal already cash-flows at list — no discount required.
- Meets the 1% rule at list price ($12k rent vs $389k).
- Recommended offer: $342k (12.0% below list) — sets the bar for market timing.
- Cap rate 27.2% vs local median 4.9% in Fayetteville — top-decile yield for the area; either an underpriced asset or a hidden risk that comps aren't pricing in. Stress-test before assuming the spread holds.
Location & tenants
- Location reads 75/100 on livability (#45 in NC, #4,031 nationally) — a middle-class / working-renter tenant base. Strengths: commute A+, cost of living A+, housing A+; Watch: schools C-, crime F, employment D-.
- Cumberland County Schools (urban): math 32% / reading 41% proficiency, ranked #126 of 178 in NC (top 71%) — families likely to look elsewhere, expect single-tenant / working-renter base with shorter leases.
- Market conditions: 222 active listings in the ZIP; 8 comparable units currently listed for rent nearby; rentals at typical pace (median 23d on market — plan ~3-4 weeks tenant-placement turnaround); 1,125 units permitted in Cumberland County in 2024 (104 in 5+ unit buildings).
Forward outlook
- In year one you build about $42k of equity ($3k loan paydown + $39k appreciation (10.0% local appreciation)).
- At projected returns (10.0% appreciation + 3.0% rent growth), your $109k cash investment doubles in ~1 year — after that, you're playing with house money.
- By year 2, paydown + projected appreciation supports a ~$67k cash-out refi (75% LTV) — recoverable capital for the next deal without selling this one.
Negotiation context
- It's been on market 230 days — a 12% lower offer ($342k) is reasonable based on typical stale-listing flexibility.
- 2 sale attempts; this cycle's ask has dropped $31k (7%) from the opening price — seller is motivated, your offer sets the floor, not the list.
Risks & watch-outs
- Watch-outs: built in 1940 — expect roof / HVAC / electrical / plumbing capex.
Questions for the listing agent
- It's been on market 230 days. Have you received any prior offers? Is the seller open to a 12% concession, seller financing, or rate buy-down credit?
- Built in 1940 — when were the roof, HVAC, electrical panel, plumbing, and water heater last replaced?
- Why hasn't it sold? Are there any deal-killer items the seller is aware of (foundation, flood, title, zoning, code violations)?
- Is there a deadline driving the sale (1031 exchange, divorce, estate, relocation)? That informs how much negotiation room exists.
- Crime grade is F in this area — have there been break-ins, vandalism, or insurance claims at this property in the last 3 years? What carrier currently insures it and at what premium?
- What's the average days-on-market for RENTAL listings here right now (not sales)? A rising rental-DOM trend means longer vacancies and softer asking-rent achievability than the comps imply.
- What's the recent tenant-quality profile in this submarket — average credit score on applications, eviction rate, late-payment / NSF rate, and stable-employment percentage? A property-management company in the area should have these aggregated.
- How much new apartment / multifamily construction is in the pipeline within 1–3 miles? Heavy new supply (>2% of stock underway) typically softens rents 12–24 months out; light construction supports rent growth.
Investment metrics
- 1% rule
- 3.08% ✓
- Cap rate
- 27.20%
- Cash-on-cash
- 74.66%
- DSCR
- 4.32
- GRM
- 2.7
CMA / ARV
No comps found within radius.
Show comp detail 1 sale within ~0.75 mi
| Address | Dist | Beds/Ba | Sqft | Sold | Price | $/sf | Match |
|---|---|---|---|---|---|---|---|
| 509 Cedar Creek And 402,406,410 Warren Street St | 0.03mi | —/— | 2,970 | 24mo | $245,000 | $82 | 66 |
Match score weights: distance 35% · size 25% · config 20% · recency 20%. Top-matched comps best support the ARV.
Projected returns pro-forma
10.0% appreciation · 3.0% rent growth · sell at horizon
- IRR
- 85.2%
- Equity multiple
- 6.91×
- Total profit
- $643,652
- Equity at exit
- $350,442
- IRR
- 79.6%
- Equity multiple
- 15.29×
- Total profit
- $1,556,392
- Equity at exit
- $755,741
Cash invested: $108,920 (down + closing). Projections, not guarantees.
Landlord ↔ Tenant lean methodology
- Overall (STATE)
- 85 Strongly Landlord-Friendly
- State North Carolina
- 85 Strongly Landlord-Friendly · R+3
- County
- — inherits STATE
- City
- — inherits STATE
ZIP-level market 28312
- Home prices YoY
- 6.9%
- Active inventory
- 222
- Price-to-rent
- 5.4×
Monthly cashflow live
- Estimated rent
- $11,981 high interval (Pro) →
- Mortgage (P&I)
- −$2,040
- Tax est. 1.5%
- −$486 /mo · $5,835/yr
- Insurance
- −$162
- HOA
- −$0
- Vacancy / Maint / Mgmt
- −$2,516
- Net cashflow
- $6,777
Break-even live
2-unit breakdown (identical units grouped — click to expand)
| Units | Beds | Baths | Est. rent |
|---|---|---|---|
| 2× units | 2 | 1 | $11,982 |
| #1 | 2 | 1 | $5,991 |
| #2 | 2 | 1 | $5,991 |
| Total (2 units) | $11,981 | ||
UW: 25.0% down · 7.5% · 30yr · 1.5% tax · 5.0% vac · 8.0% maint · 8.0% mgmt
Financing live
Cash to close
- Down payment
- $97,250
- Closing costs
- $11,670
- Reserves months
- —
- Total cash needed
- —
Loan-product check · same deal, 3 products live
Conventional
25% down · 7.5% · 30yr
- Down + closing
- —
- Monthly P&I
- —
- Monthly cashflow
- —
- DSCR
- —
- Eligible?
- —
Personal DTI + credit; lowest rate.
DSCR
20% down · 8.5% · 30yr
- Down + closing
- —
- Monthly P&I
- —
- Monthly cashflow
- —
- DSCR
- —
- Eligible?
- —
No personal income docs; deal must DSCR.
Hard money
10% down · 12.0% · 12mo
- Down + closing
- —
- Monthly P&I
- —
- Monthly cashflow
- —
- DSCR
- —
- Eligible?
- —
Short-term bridge; refi at stabilization.
Rent comps 8 comps
| Address | Beds | Baths | Sqft | Rent | $/sqft | DOM | Units | Dist |
|---|---|---|---|---|---|---|---|---|
| 210 S Plymouth St Unit 1 Fayetteville, NC | 3.0 | 1.0 | — | $1,150 | — | 23d | 1 | 0.27mi |
| 2109 Cattail Cir Unit 2 Fayetteville, NC | 3.0 | 2.0 | — | $675 | — | 23d | 1 | 0.46mi |
| 2502 Cattail Cir Unit 33 Fayetteville, NC | 3.0 | 2.0 | — | $675 | — | 23d | 1 | 0.47mi |
| 2115 Cattail Cir Unit 154 Fayetteville, NC | 3.0 | 2.0 | — | $13,000 | — | 13d | 1 | 0.49mi |
| 2416 Cattail Cir Unit 43 Fayetteville, NC | 3.0 | 2.0 | — | $700 | — | 13d | 1 | 0.52mi |
| 2412 Cattail Cir Unit 45 Fayetteville, NC | 3.0 | 2.0 | — | $19,000 | — | 13d | 1 | 0.54mi |
| 2241 Cattail Cir Unit 72 Fayetteville, NC | 3.0 | 2.0 | — | $16,000 | — | 13d | 1 | 0.64mi |
| 1611 Bluffside Dr Fayetteville, NC | 3.0 | 2.5–3.5 | 2112 | $1,800 | $0.85 | 23d | 3 | 1.30mi |
Listing history 7 events
-
2026-06-01statusdays on market $389,000 Pending 230 DOM
-
2026-05-31days on market $389,000 Active 229 DOM
-
2026-05-30days on market $389,000 Active 228 DOM
-
2026-05-14price $389,000
-
2026-04-14status Active
-
2026-02-06price $399,000
-
2025-10-09$420,000 Active
ⓘ Source: listings_history table (triggers on properties + properties_extension) + one-shot
backfill from property_details.listing_events for pre-trigger history.
Nearby sold comps map
Loading sold comps map…
Walkable amenities ~0.75 mi
Loading nearby amenities…
Taxation est. · year 1
- Rental income
- $143,772
- − Mortgage interest
- −$21,790
- − Property taxes
- −$5,835
- − Insurance
- −$1,945
- − Repairs & maintenance
- −$11,502
- − Management
- −$11,502
- − Depreciation
- −$11,316
- Taxable income
- $79,882
- Est. tax owed @ 24.0%
- −$19,172
- After-tax cash flow
- $62,149/yr
For passive investors: Depreciation is non-cash, so a rental often shows a tax loss while cash-flowing — sheltering income. Rental losses are passive: they offset passive income freely, and up to $25,000/yr can offset ordinary (W-2) income if you actively participate and your MAGI is under $100k (phasing out to $0 by $150k); unused losses carry forward. On sale, claimed depreciation is recaptured at up to 25%, and gains may owe capital-gains tax (a 1031 exchange can defer both). Figures are a year-1 estimate at your 24.0% rate — not tax advice; consult a CPA.
Schools (NCES district)
- District
- Cumberland County Schools
- NCES district ID
- 3700011
- Math proficiency
- 32% ▼ -2.00%
- Reading proficiency
- 41% ▼ -1.00%
- Median HH income
- $44,168
- Composite
- 31.0/100
- National rank
- #6096
- State rank
- #126 of 178 in NC
Livability — Fayetteville
- Score
- 75/100
- State rank
- #45
- US rank
- #4031
Category grades
Schools grade is shown separately in the Schools card above.
Census & demographics
- Census place
- Fayetteville, NC
- City population
- 226,118
- Population (ZIP)
- 19,889
Population outlook (Cumberland County) Hauer SSP2
- Today (2025)
- 330,855 people
- By 2030
- 333,523 · +0.8%
- By 2040
- 335,583 · +1.4%
- By 2050
- 335,325 · +1.4%
- By 2075
- 342,853 · +3.6%
- By 2100
- 340,698 · +3.0%
Race, ethnicity, and origin ACS 2023
- Neighborhood character
- Diverse neighborhood (Simpson 0.61)
- Race & ethnicity
- White 55% Black 29% Two or more races 8% Hispanic / Latino 8% Native American 2%
- Hispanic origin (detail)
- Mexican 4% Puerto Rican 2%
- Common ancestry
- Slovak 3% Serbian 2% Italian 2%
- Foreign-born
- 4% · Canada
- Languages at home
- 93% English-only · Spanish 5% French/Haitian/Cajun 1%
Political lean MEDSL · Cumberland
- 2024 margin
- D (+13.4) · D 56.1% · R 42.7% · Other 1.2%
- 2008→2024 swing
- -4.3pp toward R · 2008: 17.7pp · 2024: 13.4pp
- All cycles
- 2024: D+13.4 2020: D+16.6 2016: D+16.0 2012: D+19.7 2008: D+17.7
Not yet ingested
- Civics
- —
Market trends
- HPI YoY
- ▲ 19.75%
- Current HPI
- 306.7749
- Rent YoY
- —
- Metro
- —
- State GDP YoY
- ▲ 3.28%
- F500 in state
- 26
Industry mix (Fortune 500 HQ in NC)
| Industry | F500 HQs | Revenue |
|---|---|---|
| Financial Services | 2 | $213B |
|
||
| Retail | 2 | $95B |
|
||
| Industrial Conglomerate | 1 | $38B |
|
||
| Metals / Steel | 1 | $35B |
|
||
| Utilities | 1 | $30B |
|
||
| Industrial Machinery | 1 | $19B |
|
||
Price history
-7.4% since first listed4 events — show timeline
- 2026-05-14 Price Changed $389,000 LPRMLS
- 2026-04-14 Relisted — LPRMLS
- 2026-02-06 Price Changed $399,000 LPRMLS
- 2025-10-09 Listed $420,000 LPRMLS
Cash-flow waterfall
monthlySold comps — $/sqft
last 12 mo · ≤1 miLoading sold comps…