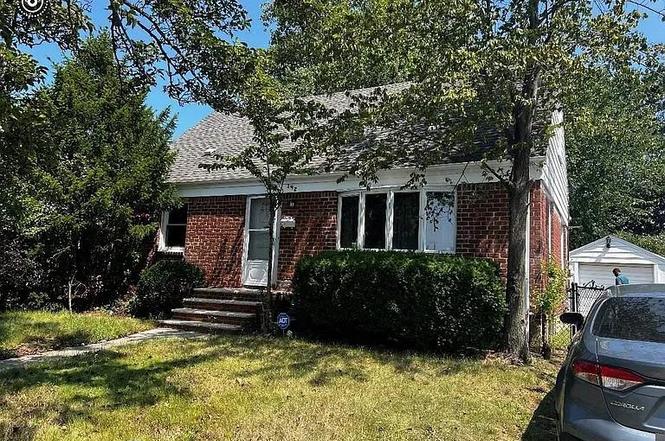
1420 Dutch Broadway · Elmont, NY
Flood risk 6/10 · Moderate
- FEMA flood zone
- X (unshaded)
- Chance of flooding over 30 yrs
- 0.72%
- Est. flood insurance / yr
- $473 – $860
Fire risk 1/10 · Minimal
- Est. fire insurance / yr
- $691 – $1,283
Heat risk 6/10 · Moderate
- Hot days now (above 97°F)
- 7 days/yr
- Hot days in 30 yrs
- 16 days/yr
Wind risk 6/10 · Moderate
- Chance of severe wind over 30 yrs
- 54.0%
Air-quality risk 3/10 · Minor
- Unhealthy air days now
- 4 days/yr
- Unhealthy air days in 30 yrs
- 4 days/yr
Risk factors via First Street. Map © Google.
Why this score? — see what drove the D+ grade
The composite is a weighted blend of 9 inputs, each scored 0–100. Each bar is that input's sub-score; the figure is the points it added to the 100-point composite (weight × sub-score).
- ARV discount +15.0/15.0
- Cash flow +10.5/30.0
- Schools +6.7/10.0
- Livability +4.0/5.0
- 1% rule +3.8/10.0
- DSCR +3.0/10.0
- Rent growth +2.5/5.0
- Condition / age +2.5/5.0
- Appreciation +0.0/10.0
$499,000
🖨 Deal sheet (PDF) 📄 Offer letter ✓ Due diligence
Listing remarks
This property is full of potential and perfect for both savvy investors and homeowners seeking additional rental income. Property offers functional living space that is comfortably sized for the area, with a layout that can easily be customized to suit your needs. Located in a well-connected neighborhood, the property offers exceptional convenience. Enjoy quick access to major roads and highways, making commuting a breeze. Nearby, you’ll find a wide range of local amenities, including shopping centers, grocery stores, banks, reputable schools, parks, and a variety of restaurants and cafe—everything you need just minutes away. Whether you're looking to expand your real estate por
Key facts
- Reputable schools
- Local amenities
- 7,228 sq ft lot
Tags
Neighborhood map
What this means for you Summary
Snapshot
- This is a 4-bed/2.0-bath single-family listed at $499k.
Deal economics
- At list price, monthly cash flow is $-254 ($-3k/yr) — negative.
- To cash-flow at today's rent, offer at most $454k (9.0% below list).
- To meet the 1% rule (rent ≥ 1% of price), the offer needs to be $437k (12.5% below list).
- Recommended offer: $437k (12.5% below list) — sets the bar for 1% rule.
- Cap rate 5.7% vs local median 3.1% in Elmont — top-decile yield for the area; either an underpriced asset or a hidden risk that comps aren't pricing in. Stress-test before assuming the spread holds.
Location & tenants
- Location reads 79/100 on livability (#134 in NY, #2,127 nationally) — a middle-class / working-renter tenant base. Strengths: commute A+, employment A+, housing A+; Watch: cost of living F.
- Valley Stream Central High School District (suburban): math 71% / reading 76% proficiency, ranked #78 of 590 in NY (top 13%) — strong family-tenant draw, lease renewals of 3-5y typical; only 17% free/reduced lunch — higher-income household profile.
- Zoned schools: Valley Stream Memorial Junior High School (math 29% / reading 66%, grade C-, #306 of 729 statewide, top 43%, 1,038 students, 40% FRL) — zoned schools average 40% FRL vs 17% district-wide (24 pts higher); higher-poverty schools than district average — tighter screening recommended.
- Zoned-school proficiency averages 48% at this address vs 74% district-wide (-26 pts) — the specific schools serving this property underperform the Valley Stream Central High School District average; the district grade overstates school quality for this exact location.
- Market conditions: 141 active listings in the ZIP; 4 comparable units currently listed for rent nearby; rentals leasing fast (median 0d on market — plan ~1-2 weeks tenant-placement turnaround); 824 units permitted in Nassau County in 2024 (153 in 5+ unit buildings).
Forward outlook
- Local home prices are declining (-3.0%/yr); year-one equity from $3k of loan paydown is wiped out by about $15k of value loss. Plan a longer hold.
- Nassau County population projected at +7% by 2050 — modest demand growth; plan on rents tracking national, not racing it.
Negotiation context
- Only 2 days on market — expect competitive offers; lowballing is unlikely to land.
- Current owner paid $190k; list at $499k implies a 163% gain — meaningful room to come down on a strong offer.
Risks & watch-outs
- Watch-outs: built in 1949 — expect roof / HVAC / electrical / plumbing capex.
- Climate carrying-cost: major flood risk; major wind risk, 54% chance of damaging wind over 30y; extreme-heat days projected 7→16/yr by 2055 (HVAC capex compounding) — expect insurance premiums to compound above CPI over the hold.
Questions for the listing agent
- What do current leases actually rent for vs. the listed asking? Can we see a recent rent roll and the last 12 months of T-12 income?
- Built in 1949 — when were the roof, HVAC, electrical panel, plumbing, and water heater last replaced?
- Is there a deadline driving the sale (1031 exchange, divorce, estate, relocation)? That informs how much negotiation room exists.
- Schools are B-rated — typically a magnet for longer-tenancy family renters. What's the average tenant stay here, and is there a school-zone premium baked into asking?
- The area grade is low — what's the realistic commute time and amenity access for the typical tenant pool here? Any planned neighborhood developments (good or bad) we should know about?
- What's the average days-on-market for RENTAL listings here right now (not sales)? A rising rental-DOM trend means longer vacancies and softer asking-rent achievability than the comps imply.
- What's the recent tenant-quality profile in this submarket — average credit score on applications, eviction rate, late-payment / NSF rate, and stable-employment percentage? A property-management company in the area should have these aggregated.
- How much new for-sale + rental construction is in the pipeline within 1–3 miles? Heavy new supply typically softens prices + rents 12–24 months out; constrained supply supports both.
Investment metrics
- 1% rule
- 0.88% ✗
- Cap rate
- 5.68%
- Cash-on-cash
- -2.18%
- DSCR
- 0.90
- GRM
- 9.5
CMA / ARV
- ARV (on-the-fly)
- $915,585
- Comps found
- 12
Show comp detail 12 sales within ~0.75 mi
| Address | Dist | Beds/Ba | Sqft | Sold | Price | $/sf | Match |
|---|---|---|---|---|---|---|---|
| 753 Wyngate Dr W | 0.32mi | 4/2.0 | 1,960 (-0%) | 1mo | $900,000 | $459 | 84 |
| 775 N Ascan St | 0.16mi | 5/2.0 (+1) | 1,956 (-1%) | 10mo | $910,000 | $465 | 79 |
| 858 W Gate | 0.20mi | 3/1.0 (-1) | 1,989 (+1%) | 6mo | $750,000 | $377 | 74 |
| 684 Dorothea Ln | 0.28mi | 5/3.0 (+1) | 1,768 (-10%) | 1mo | $930,000 | $526 | 60 |
| 525 Keller Ave | 0.47mi | 5/2.0 (+1) | 1,800 (-9%) | 0mo | $877,000 | $487 | 58 |
| 562 Arcadian Ave | 0.48mi | 4/3.0 | 1,772 (-10%) | 2mo | $865,000 | $488 | 56 |
| 27 Caroline Ave | 0.66mi | 5/2.0 (+1) | 1,988 (+1%) | 10mo | $624,000 | $314 | 54 |
| 39 Morris Pkwy | 0.75mi | 4/2.0 | 1,859 (-6%) | 6mo | $850,000 | $457 | 51 |
| 1031 Jerome Rd | 0.67mi | 4/2.0 | 1,700 (-14%) | 8mo | $925,000 | $544 | 39 |
| 884 Troy St | 0.60mi | 5/3.0 (+1) | 2,220 (+13%) | 3mo | $860,000 | $387 | 39 |
| 312 Norfeld Blvd | 0.65mi | 4/2.0 | 1,678 (-15%) | 10mo | $720,000 | $429 | 37 |
| 37 Remson St | 0.71mi | 4/3.0 | 1,702 (-14%) | 10mo | $845,000 | $496 | 32 |
Match score weights: distance 35% · size 25% · config 20% · recency 20%. Top-matched comps best support the ARV.
Projected returns pro-forma
-3.0% appreciation · 3.0% rent growth · sell at horizon
- IRR
- -19.9%
- Equity multiple
- 0.31×
- Total profit
- $-96,808
- Equity at exit
- $74,403
- IRR
- -12.6%
- Equity multiple
- 0.25×
- Total profit
- $-104,214
- Equity at exit
- $43,144
Cash invested: $139,720 (down + closing). Projections, not guarantees.
Landlord ↔ Tenant lean methodology
- Overall (STATE)
- 15 Strongly Tenant-Friendly
- State New York
- 15 Strongly Tenant-Friendly · D+10
- County
- — inherits STATE
- City
- — inherits STATE
ZIP-level market 11003
- Active inventory
- 141
- Price-to-rent
- 9.5×
Monthly cashflow live
- Estimated rent
- $4,368 medium interval (Pro) →
- Mortgage (P&I)
- −$2,617
- Tax from tax record
- −$880 /mo · $10,561/yr
- Insurance
- −$208
- HOA
- −$0
- Vacancy / Maint / Mgmt
- −$917
- Net cashflow
- $-254
Break-even live
Sensitivity live
| Price | -10% $29 | -5% $-113 | +0% $-254 | +5% $-395 | +10% $-536 |
|---|---|---|---|---|---|
| Rent | -10% $-599 | -5% $-426 | +0% $-254 | +5% $-81 | +10% $91 |
| Rate | -1.0pp $-3 | -0.5pp $-127 | base $-254 | +0.5pp $-383 | +1.0pp $-515 |
UW: 25.0% down · 7.5% · 30yr · 1.5% tax · 5.0% vac · 8.0% maint · 8.0% mgmt
Financing live
Cash to close
- Down payment
- $124,750
- Closing costs
- $14,970
- Reserves months
- —
- Total cash needed
- —
Loan-product check · same deal, 3 products live
Conventional
25% down · 7.5% · 30yr
- Down + closing
- —
- Monthly P&I
- —
- Monthly cashflow
- —
- DSCR
- —
- Eligible?
- —
Personal DTI + credit; lowest rate.
DSCR
20% down · 8.5% · 30yr
- Down + closing
- —
- Monthly P&I
- —
- Monthly cashflow
- —
- DSCR
- —
- Eligible?
- —
No personal income docs; deal must DSCR.
Hard money
10% down · 12.0% · 12mo
- Down + closing
- —
- Monthly P&I
- —
- Monthly cashflow
- —
- DSCR
- —
- Eligible?
- —
Short-term bridge; refi at stabilization.
Rent comps 4 comps
| Address | Beds | Baths | Sqft | Rent | $/sqft | DOM | Units | Dist |
|---|---|---|---|---|---|---|---|---|
| 1316 McClure Ave Elmont, NY | 4.0 | 2.5 | 1230 | $5,500 | $4.47 | 0d | 1 | 0.94mi |
| 1016 Oaks Dr Franklin Square, NY | 5.0 | 2.0 | 2026 | $4,500 | $2.22 | 0d | 1 | 0.99mi |
| 1318 Post Ave Elmont, NY | 4.0 | 2.5 | 2240 | $4,800 | $2.14 | 0d | 1 | 1.31mi |
| 103 E Saint Marks Pl Valley Stream, NY | 3.0 | 1.0 | 1758 | $3,700 | $2.10 | 0d | 1 | 1.43mi |
Listing history 4 events
-
2025-04-10status Pending
-
2025-04-04$499,000 Active
-
1996-10-03soldstatus $190,000
-
1977-05-01soldstatus $63,363
ⓘ Source: listings_history table (triggers on properties + properties_extension) + one-shot
backfill from property_details.listing_events for pre-trigger history.
Tax reassessment forecast NY · Partial reset (capped growth)
- Current annual tax
- $10,561 · $880/mo
- Projected year-2 tax
- $10,561 · $880/mo
- Expected delta
- $0/yr ($0/mo · 0.0%)
ⓘ Screening estimate from a state-policy table — verify with the county assessor before closing.
Climate risk First Street
- Flood 6/10 Major FEMA zone X (unshaded) · 72% chance over 30 yrs
- Wildfire 1/10 Low
- Heat 6/10 Major 7 d/yr ≥97°F today · 16 d/yr by 30 yrs out
- Wind 6/10 Major 54% chance of damaging wind over 30 yrs
- Air quality 3/10 Moderate 4 unhealthy d/yr today · 4 by 30 yrs out
Nearby sold comps map
Loading sold comps map…
Walkable amenities ~0.75 mi
Loading nearby amenities…
Taxation est. · year 1
- Rental income
- $52,418
- − Mortgage interest
- −$27,952
- − Property taxes
- −$10,561
- − Insurance
- −$2,495
- − Repairs & maintenance
- −$4,193
- − Management
- −$4,193
- − Depreciation
- −$14,516
- Taxable loss
- −$11,492
- Est. tax savings @ 24.0%
- +$2,758
- After-tax cash flow
- $-289/yr
For passive investors: Depreciation is non-cash, so a rental often shows a tax loss while cash-flowing — sheltering income. Rental losses are passive: they offset passive income freely, and up to $25,000/yr can offset ordinary (W-2) income if you actively participate and your MAGI is under $100k (phasing out to $0 by $150k); unused losses carry forward. On sale, claimed depreciation is recaptured at up to 25%, and gains may owe capital-gains tax (a 1031 exchange can defer both). Figures are a year-1 estimate at your 24.0% rate — not tax advice; consult a CPA.
Schools (NCES district)
- District
- Valley Stream Central High School District
- NCES district ID
- 3629520
- Math proficiency
- 71% ▼ -7.00%
- Reading proficiency
- 76% ▬ 0.00%
- Median HH income
- $94,844
- Composite
- 66.54/100
- National rank
- #418
- State rank
- #78 of 590 in NY
Livability — Elmont
- Score
- 79/100
- State rank
- #134
- US rank
- #2127
Category grades
Schools grade is shown separately in the Schools card above.
Census & demographics
- Census place
- Elmont, NY
- City population
- 44,716
- Population (ZIP)
- 44,716
Population outlook (Nassau County) Hauer SSP2
- Today (2025)
- 1,409,302 people
- By 2030
- 1,431,482 · +1.6%
- By 2040
- 1,471,607 · +4.4%
- By 2050
- 1,502,845 · +6.6%
- By 2075
- 1,575,403 · +11.8%
- By 2100
- 1,554,356 · +10.3%
Race, ethnicity, and origin ACS 2023
- Neighborhood character
- Highly diverse neighborhood (Simpson 0.74)
- Race & ethnicity
- Black 41% Hispanic / Latino 22% Asian 17% White 14% Two or more races 11%
- Hispanic origin (detail)
- Mexican 2% Puerto Rican 4% Dominican 2%
- Common ancestry
- Hispanic 12% Romanian 1%
- Foreign-born
- 43% · Canada, Jamaica, China
- Languages at home
- 53% English-only · Spanish 19% French/Haitian/Cajun 10% Other Indo-European 8%
Political lean MEDSL · Nassau
- 2024 margin
- Toss-up / Even · D 47.9% · R 52.1%
- 2008→2024 swing
- -12.6pp toward R · 2008: 8.4pp · 2024: -4.2pp
- All cycles
- 2024: R+4.2 2020: D+9.5 2016: D+5.3 2012: D+6.7 2008: D+8.4
Not yet ingested
- Civics
- —
Market trends
- HPI YoY
- ▼ -654.86%
- Current HPI
- 346.1523
- Rent YoY
- —
- Metro
- —
- State GDP YoY
- ▲ 2.60%
- F500 in state
- 92
Industry mix (Fortune 500 HQ in NY)
| Industry | F500 HQs | Revenue |
|---|---|---|
| Financial Services | 10 | $950B |
|
||
| Consumer Goods | 9 | $162B |
|
||
| Insurance | 4 | $225B |
|
||
| Telecommunications | 2 | $144B |
|
||
| Pharmaceuticals | 2 | $112B |
|
||
| Media / Entertainment | 2 | $69B |
|
||
Price history
+687.5% since first listed4 events — show timeline
- 2025-04-10 Pending — OneKey® MLS as Distributed by MLS Grid
- 2025-04-04 Listed $499,000 OneKey® MLS as Distributed by MLS Grid
- 1996-10-03 Sold (Public Records) $190,000 Public Records
- 1977-05-01 Sold (Public Records) $63,363 Public Records
Property tax history
+1.0%/yrLatest (2024): $10,561 · +1.4% YoY. Source: county tax records.
Cash-flow waterfall
monthlySold comps — $/sqft
last 12 mo · ≤1 miLoading sold comps…