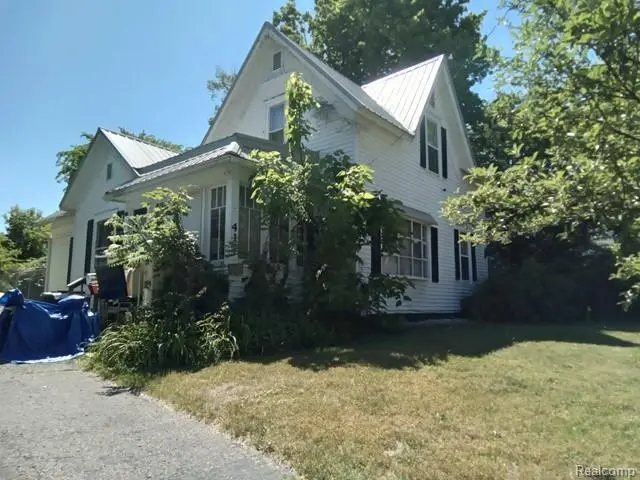
417 Chestnut St · Dowagiac, MI
Flood risk 1/10 · Minimal
- FEMA flood zone
- X (unshaded)
- Chance of flooding over 30 yrs
- 0.0%
- Est. flood insurance / yr
- $473 – $860
Fire risk 1/10 · Minimal
- Est. fire insurance / yr
- $784 – $1,456
Heat risk 2/10 · Minimal
- Hot days now (above 100°F)
- 7 days/yr
- Hot days in 30 yrs
- 16 days/yr
Wind risk 2/10 · Minimal
- Chance of severe wind over 30 yrs
- —
Air-quality risk 2/10 · Minimal
- Unhealthy air days now
- 1 days/yr
- Unhealthy air days in 30 yrs
- 2 days/yr
Risk factors via First Street. Map © Google.
Why this score? — see what drove the B- grade
The composite is a weighted blend of 9 inputs, each scored 0–100. Each bar is that input's sub-score; the figure is the points it added to the 100-point composite (weight × sub-score).
- Cash flow +30.0/30.0
- DSCR +10.0/10.0
- 1% rule +9.4/10.0
- ARV discount +7.5/15.0
- Livability +3.6/5.0
- Rent growth +2.5/5.0
- Condition / age +2.5/5.0
- Schools +2.1/10.0
- Appreciation +0.0/10.0
$69,900
🖨 Deal sheet 📄 Offer letter ✓ Due diligence
Listing remarks MLS
Discover a unique opportunity at 417 Chestnut ST, a distinguished single-family residence in Dowagiac, MI, originally constructed in 1905. This property offers a chance to own a piece of history, reimagined for contemporary living. The residence features three thoughtfully designed bedrooms, providing comfortable and private spaces for relaxation. A well-appointed bathroom serves the home, offering practical amenities. This charming home invites you to imagine the possibilities within its walls. Schedule your private viewing today and envision your future in this distinctive Dowagiac address. A full rehab will be needed but make this home your blank canvas as you reimagine your dream home.
Key facts
- 9,583 sq ft lot
- Built 1905
- Listed 9 days
Property features AI
Exterior
- Parking: No garage
- Utilities: Public water; Public sewer
- Home design: Single-family residence; Two levels; Ground-level entry
- Construction: Aluminum siding; Brick/mortar foundation
- Exterior features: Paved road access; Lot approximately 0.22 acres (67 x 146)
Interior
- Bathrooms: 1 full bathroom
- Heating & cooling: Forced air heating (natural gas); No central air conditioning
- Interior features: Unfinished basement
Neighborhood map
What this means for you Summary
Snapshot
- This is a 2-bed/1.0-bath single-family listed at $70k.
Deal economics
- At list price, monthly cash flow is $324 ($4k/yr) — positive.
- The deal already cash-flows at list — no discount required.
- Meets the 1% rule at list price ($1k rent vs $70k).
- Cap rate 11.9% vs local median 4.8% in Dowagiac — top-decile yield for the area; either an underpriced asset or a hidden risk that comps aren't pricing in. Stress-test before assuming the spread holds.
Location & tenants
- Location reads 72/100 on livability (#243 in MI) — a middle-class / working-renter tenant base. Strengths: cost of living A+, housing A+, health & safety A+; Watch: commute D, schools F, crime F.
- Dowagiac Union School District (town): math 19% / reading 31% proficiency, ranked #430 of 540 in MI (top 80%) — low school quality limits family demand, transient renter base, plan for 1-2y turnover; 66% free/reduced lunch — lower-income household profile, screen leases tightly.
- Market conditions: 85 active listings in the ZIP; 1 comparable units currently listed for rent nearby; 128 units permitted in Cass County in 2024 (0 in 5+ unit buildings).
Forward outlook
- Local home prices are declining (-3.0%/yr); year-one equity from $483 of loan paydown is wiped out by about $2k of value loss. Plan a longer hold.
- Cass County population projected at -20% by 2050 — secular population decline; favor cash flow + early exit over multi-decade hold.
- At projected returns (-3.0% appreciation + 3.0% rent growth), your $20k cash investment doubles in ~7 years — after that, you're playing with house money.
Negotiation context
- Only 10 days on market — expect competitive offers; lowballing is unlikely to land.
- 6 sale attempts since 34y ago with the ask held roughly flat each time — persistent listings suggest the price (not the market) is what's stuck; bring a comps-based counter.
- Current owner paid $55k; 27% above their basis — modest negotiation headroom, anchor on the comps not their cost.
Risks & watch-outs
- Watch-outs: built in 1905 — expect roof / HVAC / electrical / plumbing capex.
Questions for the listing agent
- Built in 1905 — when were the roof, HVAC, electrical panel, plumbing, and water heater last replaced?
- Is there a deadline driving the sale (1031 exchange, divorce, estate, relocation)? That informs how much negotiation room exists.
- Schools are F-rated, which usually means shorter tenancies and higher turnover. Who's the typical renter profile here, and what's been the actual vacancy rate?
- Crime grade is F in this area — have there been break-ins, vandalism, or insurance claims at this property in the last 3 years? What carrier currently insures it and at what premium?
- What's the average days-on-market for RENTAL listings here right now (not sales)? A rising rental-DOM trend means longer vacancies and softer asking-rent achievability than the comps imply.
- What's the recent tenant-quality profile in this submarket — average credit score on applications, eviction rate, late-payment / NSF rate, and stable-employment percentage? A property-management company in the area should have these aggregated.
- How much new for-sale + rental construction is in the pipeline within 1–3 miles? Heavy new supply typically softens prices + rents 12–24 months out; constrained supply supports both.
Investment metrics
- 1% rule
- 1.44% ✓
- Cap rate
- 11.86%
- Cash-on-cash
- 19.89%
- DSCR
- 1.89
- GRM
- 5.8
CMA / ARV
- ARV (on-the-fly)
- $141,831
- Comps found
- 12
Show comp detail 12 sales within ~0.75 mi
| Address | Dist | Beds/Ba | Sqft | Sold | Price | $/sf | Match |
|---|---|---|---|---|---|---|---|
| 104 S Lowe St | 0.15mi | 3/1.0 (+1) | 1,394 (+1%) | 9mo | $157,999 | $113 | 79 |
| 703 Main St | 0.28mi | 3/1.5 (+1) | 1,400 (+2%) | 4mo | $138,500 | $99 | 73 |
| 607 W High St | 0.23mi | 3/1.0 (+1) | 1,321 (-4%) | 10mo | $72,000 | $55 | 69 |
| 405 S Lowe St | 0.17mi | 3/1.0 (+1) | 1,202 (-13%) | 4mo | $205,000 | $171 | 62 |
| 105 Pokagon St | 0.34mi | 3/1.0 (+1) | 1,240 (-10%) | 1mo | $60,500 | $49 | 62 |
| 312 Pennsylvania Ave | 0.21mi | 2/1.0 | 1,574 (+14%) | 10mo | $121,000 | $77 | 58 |
| 526 S Front St | 0.29mi | 3/2.0 (+1) | 1,496 (+9%) | 9mo | $45,000 | $30 | 55 |
| 624 Spruce St | 0.34mi | 3/2.0 (+1) | 1,502 (+9%) | 10mo | $180,000 | $120 | 52 |
| 213 Clinton St | 0.68mi | 3/1.5 (+1) | 1,457 (+6%) | 0mo | $82,500 | $57 | 51 |
| 530 S Front St | 0.30mi | 3/1.0 (+1) | 1,176 (-15%) | 7mo | $125,000 | $106 | 51 |
| 105 James St | 0.73mi | 3/1.0 (+1) | 1,395 (+1%) | 10mo | $178,900 | $128 | 51 |
| 317 Mcomber St | 0.72mi | 3/1.0 (+1) | 1,452 (+5%) | 12mo | $150,000 | $103 | 43 |
Match score weights: distance 35% · size 25% · config 20% · recency 20%. Top-matched comps best support the ARV.
Projected returns pro-forma
-3.0% appreciation · 3.0% rent growth · sell at horizon
- IRR
- 12.0%
- Equity multiple
- 1.48×
- Total profit
- $9,341
- Equity at exit
- $10,422
- IRR
- 21.0%
- Equity multiple
- 2.78×
- Total profit
- $34,765
- Equity at exit
- $6,044
Cash invested: $19,572 (down + closing). Projections, not guarantees.
Landlord ↔ Tenant lean methodology
- Overall (STATE)
- 62 Landlord-Friendly
- State Michigan
- 62 Landlord-Friendly · EVEN
- County
- — inherits STATE
- City
- — inherits STATE
ZIP-level market 49047
- Active inventory
- 85
- Price-to-rent
- 5.8×
Monthly cashflow live
- Estimated rent
- $1,004 medium interval (Pro) →
- Mortgage (P&I)
- −$367
- Tax from tax record
- −$73 /mo · $872/yr
- Insurance
- −$29
- HOA
- −$0
- Vacancy / Maint / Mgmt
- −$211
- Net cashflow
- $324
Break-even live
UW: 25.0% down · 7.5% · 30yr · 1.5% tax · 5.0% vac · 8.0% maint · 8.0% mgmt
Financing live
Cash to close
- Down payment
- $17,475
- Closing costs
- $2,097
- Reserves months
- —
- Total cash needed
- —
Loan-product check · same deal, 3 products live
Conventional
25% down · 7.5% · 30yr
- Down + closing
- —
- Monthly P&I
- —
- Monthly cashflow
- —
- DSCR
- —
- Eligible?
- —
Personal DTI + credit; lowest rate.
DSCR
20% down · 8.5% · 30yr
- Down + closing
- —
- Monthly P&I
- —
- Monthly cashflow
- —
- DSCR
- —
- Eligible?
- —
No personal income docs; deal must DSCR.
Hard money
10% down · 12.0% · 12mo
- Down + closing
- —
- Monthly P&I
- —
- Monthly cashflow
- —
- DSCR
- —
- Eligible?
- —
Short-term bridge; refi at stabilization.
Rent comps 1 comps
| Address | Beds | Baths | Sqft | Rent | $/sqft | DOM | Units | Dist |
|---|---|---|---|---|---|---|---|---|
| 29509 Amerihost Dr Dowagiac, MI | 1.0–3.0 | 1.0–2.0 | 959 | $1,004 | $1.05 | 43d | 8 | 1.10mi |
Listing history 8 events
-
2026-06-18days on market $69,900 Active 10 DOM
-
2026-06-17days on market $69,900 Active 9 DOM
-
2026-06-16days on market $69,900 Active 8 DOM
-
2026-06-15days on market $69,900 Active 7 DOM
-
2026-06-13days on market $69,900 Active 5 DOM
-
2026-06-12days on market $69,900 Active 4 DOM
-
2026-06-09remarks 699-char remark
-
2026-06-09$69,900 Active 1 DOM
ⓘ Source: listings_history table (triggers on properties + properties_extension) + one-shot
backfill from property_details.listing_events for pre-trigger history.
Tax reassessment forecast MI · Partial reset (capped growth)
- Current annual tax
- $872 · $73/mo
- Projected year-2 tax
- $974 · $81/mo
- Expected delta
- +$102/yr (+$9/mo · 11.7%)
ⓘ Screening estimate from a state-policy table — verify with the county assessor before closing.
Climate risk First Street
- Flood 1/10 Low FEMA zone X (unshaded) · 0% chance over 30 yrs
- Wildfire 1/10 Low
- Heat 2/10 Low 7 d/yr ≥100°F today · 16 d/yr by 30 yrs out
- Wind 2/10 Low
- Air quality 2/10 Low 1 unhealthy d/yr today · 2 by 30 yrs out
Nearby sold comps map
Loading sold comps map…
Walkable amenities ~0.75 mi
Loading nearby amenities…
Taxation est. · year 1
- Rental income
- $12,042
- − Mortgage interest
- −$3,915
- − Property taxes
- −$872
- − Insurance
- −$350
- − Repairs & maintenance
- −$963
- − Management
- −$963
- − Depreciation
- −$2,033
- Taxable income
- $2,945
- Est. tax owed @ 24.0%
- −$707
- After-tax cash flow
- $3,186/yr
For passive investors: Depreciation is non-cash, so a rental often shows a tax loss while cash-flowing — sheltering income. Rental losses are passive: they offset passive income freely, and up to $25,000/yr can offset ordinary (W-2) income if you actively participate and your MAGI is under $100k (phasing out to $0 by $150k); unused losses carry forward. On sale, claimed depreciation is recaptured at up to 25%, and gains may owe capital-gains tax (a 1031 exchange can defer both). Figures are a year-1 estimate at your 24.0% rate — not tax advice; consult a CPA.
Schools (NCES district)
- District
- Dowagiac Union School District
- NCES district ID
- 2612150
- Math proficiency
- 19% ▼ -2.00%
- Reading proficiency
- 31% ▼ -1.00%
- Median HH income
- $39,741
- Composite
- 21.03/100
- National rank
- #8452
- State rank
- #430 of 540 in MI
Livability — Dowagiac
- Score
- 72/100
- State rank
- #243
- US rank
- #6087
Category grades
Schools grade is shown separately in the Schools card above.
Census & demographics
- Census place
- Dowagiac, MI
- Population (ZIP)
- 14,506
Population outlook (Cass County) Hauer SSP2
- Today (2025)
- 49,919 people
- By 2030
- 48,320 · -3.2%
- By 2040
- 44,230 · -11.4%
- By 2050
- 39,852 · -20.2%
- By 2075
- 31,440 · -37.0%
- By 2100
- 23,914 · -52.1%
Race, ethnicity, and origin ACS 2023
- Neighborhood character
- Predominantly White (81%)
- Race & ethnicity
- White 81% Hispanic / Latino 7% Two or more races 6% Black 6% Native American 2%
- Hispanic origin (detail)
- Mexican 7%
- Common ancestry
- Romanian 5% Iranian 2% Italian 2%
- Foreign-born
- 3% · Canada
- Languages at home
- 94% English-only · Spanish 4% German/W. Germanic 1%
Political lean MEDSL · Cass
- 2024 margin
- Solid R (+33.9) · D 32.5% · R 66.4% · Other 1.1%
- 2008→2024 swing
- -38.0pp toward R · 2008: 4.1pp · 2024: -33.9pp
- All cycles
- 2024: R+33.9 2020: R+28.9 2016: R+29.9 2012: R+13.7 2008: D+4.1
Not yet ingested
- Civics
- —
Market trends
- HPI YoY
- ▼ -188.04%
- Current HPI
- 186.2757
- Rent YoY
- —
- Metro
- —
- State GDP YoY
- ▲ 1.37%
- F500 in state
- 28
Industry mix (Fortune 500 HQ in MI)
| Industry | F500 HQs | Revenue |
|---|---|---|
| Automotive Parts | 3 | $48B |
|
||
| Automotive | 2 | $372B |
|
||
| Chemicals | 1 | $45B |
|
||
| Automotive Retail | 1 | $29B |
|
||
| Healthcare / Medical Devices | 1 | $23B |
|
||
| Automotive Technology | 1 | $20B |
|
||
Price history
+136.9% since first listed11 events — show timeline
- 2026-06-08 Listed $69,900 MiRealSource-MiMLS
- 2026-06-08 Listed $69,900 REALCOMP
- 2005-09-30 Sold (Public Records) $54,900 Public Records
- 2005-09-30 Sold (MLS) $54,900 REALCOMP
- 2005-09-30 Sold (MLS) $54,900 SW Michigan MLS
- 2005-08-29 Listed $54,900 REALCOMP
- 2005-08-29 Listed $54,900 SW Michigan MLS
- 1993-03-05 Sold (MLS) $28,000 REALCOMP
- 1993-03-05 Sold (MLS) $28,000 SW Michigan MLS
- 1992-11-23 Listed $29,500 REALCOMP
- 1992-11-23 Listed $29,500 SW Michigan MLS
Property tax history
+0.1%/yrLatest (2025): $872 · -29.9% YoY. Source: county tax records.
Cash-flow waterfall
monthlySold comps — $/sqft
last 12 mo · ≤1 miLoading sold comps…