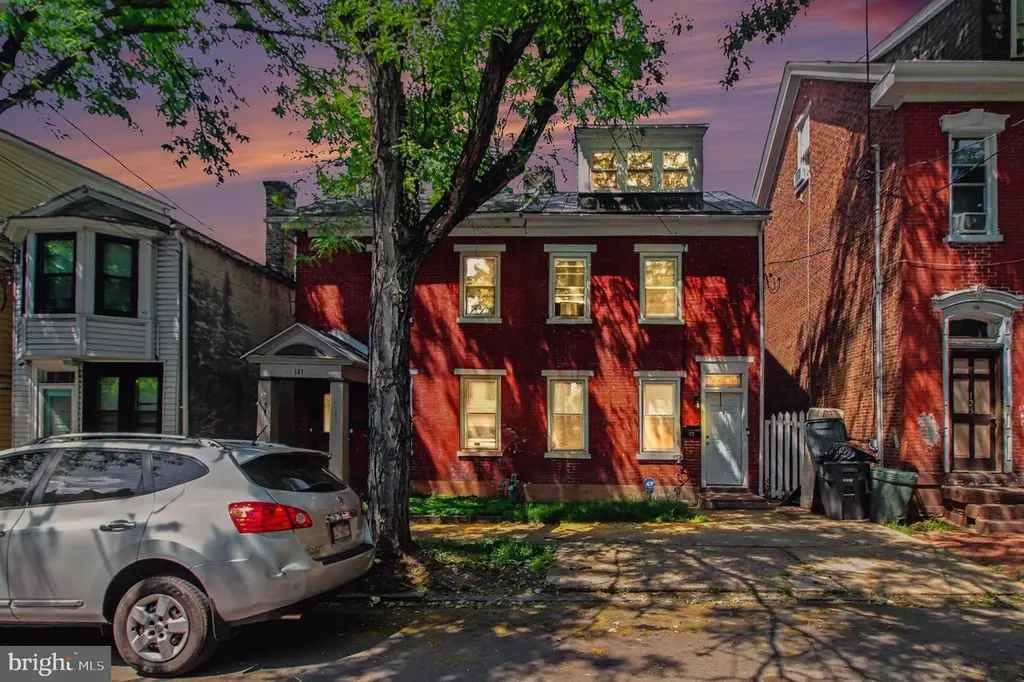
123 King St · Pottstown, PA
Flood risk 5/10 · Moderate
- FEMA flood zone
- X (unshaded)
- Chance of flooding over 30 yrs
- 0.26%
- Est. flood insurance / yr
- $473 – $860
Fire risk 1/10 · Minimal
- Est. fire insurance / yr
- $511 – $949
Heat risk 6/10 · Moderate
- Hot days now (above 101°F)
- 7 days/yr
- Hot days in 30 yrs
- 16 days/yr
Wind risk 5/10 · Moderate
- Chance of severe wind over 30 yrs
- 23.0%
Air-quality risk 3/10 · Minor
- Unhealthy air days now
- 2 days/yr
- Unhealthy air days in 30 yrs
- 4 days/yr
Risk factors via First Street. Map © Google.
Why this score? — see what drove the B- grade
The composite is a weighted blend of 9 inputs, each scored 0–100. Each bar is that input's sub-score; the figure is the points it added to the 100-point composite (weight × sub-score).
- Cash flow +24.9/30.0
- ARV discount +15.0/15.0
- DSCR +8.1/10.0
- 1% rule +6.9/10.0
- Rent growth +3.7/5.0
- Livability +3.6/5.0
- Condition / age +2.5/5.0
- Schools +1.5/10.0
- Appreciation +0.0/10.0
$160,000
🖨 Deal sheet 📄 Offer letter ✓ Due diligence
Listing remarks
Beautifully updated home in a convenient location just 10 minutes from Phoenixville with easy access to Rt. 422 and Rt. 100. Major improvements have already been completed, including a newer roof installed just 3 years ago with a 10-year warranty, updated plumbing upstairs and downstairs, a new electrical panel with updated outlets, and a newer water heater. Inside, the home features new hardwood flooring on the main level, an updated bathroom, and central air split units in every bedroom and the living room for added comfort throughout. Take a look at this home to live in or make it a great rental property!
Key facts
- Newer water heater
- New electrical panel
- Updated bathroom
Tags
Property features AI
Finance
- Financial info: Ownership is fee simple; Lease not considered
Exterior
- Parking: On-street parking
- Utilities: Public water; Public sewer; Electric service for heating, cooling, and hot water
- Home design: Semi-detached property; Above-grade and below-grade structures
- Construction: Brick construction; Stone foundation; Pets allowed with no pet restrictions
- Exterior features: Property not in a federal flood zone; Ground rent paid annually; Lot dimensions approximately 20.00 x 0.00
Interior
- Bedrooms: Three bedrooms on the first upper level; One bedroom on the second upper level
- Bathrooms: One full bathroom
- Heating & cooling: Central heating (electric); Ductless/mini-split cooling (electric); Electric hot water
- Interior features: Not furnished; Basement present (unfinished, other)
- Laundry & utility: Laundry located on the main floor
Neighborhood map
What this means for you Summary
Snapshot
- This is a 3-bed/1.0-bath townhouse listed at $160k.
Deal economics
- At list price, monthly cash flow is $341 ($4k/yr) — positive.
- The deal already cash-flows at list — no discount required.
- Meets the 1% rule at list price ($2k rent vs $160k).
- Recommended offer: $158k (1.5% below list) — sets the bar for market timing.
- Cap rate 8.9% vs local median 5.0% in Pottstown — top-decile yield for the area; either an underpriced asset or a hidden risk that comps aren't pricing in. Stress-test before assuming the spread holds.
Location & tenants
- Location reads 72/100 on livability (#643 in PA) — a middle-class / working-renter tenant base. Strengths: cost of living A+, housing A+, health & safety A+; Watch: amenities C-, employment D+, crime F.
- Pottstown SD (suburban): math 11% / reading 23% proficiency, ranked #504 of 539 in PA (top 94%) — low school quality limits family demand, transient renter base, plan for 1-2y turnover; 62% free/reduced lunch — lower-income household profile, screen leases tightly.
- Market conditions: Rents rising fast (+4.9%/yr); 202 active listings in the ZIP; 22 comparable units currently listed for rent nearby; rentals at typical pace (median 25d on market — plan ~3-4 weeks tenant-placement turnaround); 45% of comp listings sitting > 30 days — soft ceiling on asking rent; solid renter incomes; 1,936 units permitted in Montgomery County in 2024 (530 in 5+ unit buildings).
Forward outlook
- Local home prices are declining (-3.0%/yr); year-one equity from $1k of loan paydown is wiped out by about $5k of value loss. Plan a longer hold.
- Montgomery County population projected at +5% by 2050 — modest demand growth; plan on rents tracking national, not racing it.
- At projected returns (-3.0% appreciation + 4.9% rent growth), your $45k cash investment doubles in ~10 years — after that, you're playing with house money.
Negotiation context
- It's been on market 25 days — a 2% lower offer ($158k) is reasonable based on typical stale-listing flexibility.
- 3 sale attempts since 14y ago; this cycle's ask has dropped $30k (16%) from the opening price — seller is motivated, your offer sets the floor, not the list.
- Current owner paid $138k; 16% above their basis — modest negotiation headroom, anchor on the comps not their cost.
Risks & watch-outs
- Watch-outs: built in 1910 — expect roof / HVAC / electrical / plumbing capex.
- Climate carrying-cost: moderate flood risk; moderate wind risk, 23% chance of damaging wind over 30y; extreme-heat days projected 7→16/yr by 2055 (HVAC capex compounding) — expect insurance premiums to compound above CPI over the hold.
Questions for the listing agent
- Built in 1910 — when were the roof, HVAC, electrical panel, plumbing, and water heater last replaced?
- Is there a deadline driving the sale (1031 exchange, divorce, estate, relocation)? That informs how much negotiation room exists.
- Schools are B-rated — typically a magnet for longer-tenancy family renters. What's the average tenant stay here, and is there a school-zone premium baked into asking?
- Crime grade is F in this area — have there been break-ins, vandalism, or insurance claims at this property in the last 3 years? What carrier currently insures it and at what premium?
- What's the average days-on-market for RENTAL listings here right now (not sales)? A rising rental-DOM trend means longer vacancies and softer asking-rent achievability than the comps imply.
- What's the recent tenant-quality profile in this submarket — average credit score on applications, eviction rate, late-payment / NSF rate, and stable-employment percentage? A property-management company in the area should have these aggregated.
- How much new for-sale + rental construction is in the pipeline within 1–3 miles? Heavy new supply typically softens prices + rents 12–24 months out; constrained supply supports both.
Investment metrics
- 1% rule
- 1.19% ✓
- Cap rate
- 8.85%
- Cash-on-cash
- 9.14%
- DSCR
- 1.41
- GRM
- 7.0
CMA / ARV
- ARV (on-the-fly)
- $240,039
- Comps found
- 12
Show comp detail 12 sales within ~0.75 mi
| Address | Dist | Beds/Ba | Sqft | Sold | Price | $/sf | Match |
|---|---|---|---|---|---|---|---|
| 13 W 2nd St | 0.32mi | 4/1.5 (+1) | 1,618 (+0%) | 2mo | $239,900 | $148 | 76 |
| 121 S Penn St | 0.31mi | 3/2.5 | 1,520 (-6%) | 1mo | $285,000 | $188 | 69 |
| 57 W 3rd St | 0.42mi | 4/2.0 (+1) | 1,515 (-6%) | 0mo | $225,000 | $149 | 61 |
| 19 W 4th St | 0.43mi | 4/2.0 (+1) | 1,519 (-6%) | 2mo | $155,000 | $102 | 59 |
| 75 W 4th St | 0.49mi | 3/1.0 | 1,420 (-12%) | 2mo | $195,000 | $137 | 55 |
| 527 May St | 0.67mi | 3/2.5 | 1,466 (-9%) | 1mo | $289,500 | $197 | 47 |
| 368 Spruce St | 0.50mi | 4/1.0 (+1) | 1,398 (-13%) | 5mo | $234,000 | $167 | 46 |
| 22 E 6th St | 0.48mi | 4/2.0 (+1) | 1,430 (-11%) | 6mo | $215,000 | $150 | 45 |
| 474 N Franklin St | 0.67mi | 3/1.0 | 1,382 (-14%) | 5mo | $183,500 | $133 | 41 |
| 516 N Charlotte St | 0.69mi | 4/2.0 (+1) | 1,745 (+8%) | 5mo | $272,000 | $156 | 40 |
| 475 N Charlotte St | 0.64mi | 4/1.5 (+1) | 1,384 (-14%) | 3mo | $185,000 | $134 | 37 |
| 332 Oak St | 0.60mi | 4/2.0 (+1) | 1,849 (+15%) | 3mo | $192,000 | $104 | 36 |
Match score weights: distance 35% · size 25% · config 20% · recency 20%. Top-matched comps best support the ARV.
Projected returns pro-forma
-3.0% appreciation · 4.93% rent growth · sell at horizon
- IRR
- -0.2%
- Equity multiple
- 0.99×
- Total profit
- $-391
- Equity at exit
- $23,857
- IRR
- 11.4%
- Equity multiple
- 1.98×
- Total profit
- $43,900
- Equity at exit
- $13,834
Cash invested: $44,800 (down + closing). Projections, not guarantees.
Landlord ↔ Tenant lean methodology
- Overall (STATE)
- 62 Landlord-Friendly
- State Pennsylvania
- 62 Landlord-Friendly · EVEN
- County
- — inherits STATE
- City
- — inherits STATE
ZIP-level market 19464
- Rents YoY
- 4.9%
- Active inventory
- 202
- Price-to-rent
- 7.0×
Monthly cashflow live
- Estimated rent
- $1,897 high interval (Pro) →
- Mortgage (P&I)
- −$839
- Tax from tax record
- −$252 /mo · $3,021/yr
- Insurance
- −$67
- HOA
- −$0
- Vacancy / Maint / Mgmt
- −$398
- Net cashflow
- $341
Break-even live
UW: 25.0% down · 7.5% · 30yr · 1.5% tax · 5.0% vac · 8.0% maint · 8.0% mgmt
Financing live
Cash to close
- Down payment
- $40,000
- Closing costs
- $4,800
- Reserves months
- —
- Total cash needed
- —
Loan-product check · same deal, 3 products live
Conventional
25% down · 7.5% · 30yr
- Down + closing
- —
- Monthly P&I
- —
- Monthly cashflow
- —
- DSCR
- —
- Eligible?
- —
Personal DTI + credit; lowest rate.
DSCR
20% down · 8.5% · 30yr
- Down + closing
- —
- Monthly P&I
- —
- Monthly cashflow
- —
- DSCR
- —
- Eligible?
- —
No personal income docs; deal must DSCR.
Hard money
10% down · 12.0% · 12mo
- Down + closing
- —
- Monthly P&I
- —
- Monthly cashflow
- —
- DSCR
- —
- Eligible?
- —
Short-term bridge; refi at stabilization.
Rent comps 22 comps
| Address | Beds | Baths | Sqft | Rent | $/sqft | DOM | Units | Dist |
|---|---|---|---|---|---|---|---|---|
| 48 Chestnut St #2 Pottstown, PA | 3.0 | 1.0 | 1100 | $1,700 | $1.55 | 44d | 1 | 0.09mi |
| 21 Walnut St Pottstown, PA | 4.0 | 2.0 | 1791 | $2,200 | $1.23 | 5d | 1 | 0.18mi |
| 19 Beech St Pottstown, PA | 2.0 | 1.0 | 2000 | $1,650 | $0.82 | 44d | 1 | 0.25mi |
| 308 King St Unit 2 Pottstown, PA | 4.0 | 2.0 | 1958 | $2,100 | $1.07 | 44d | 1 | 0.27mi |
| 122 E 3rd St Unit 3 Pottstown, PA | 2.0 | 1.0 | 1200 | $1,400 | $1.17 | 44d | 1 | 0.27mi |
| 262 Beech St Unit 2 Pottstown, PA | 2.0 | 1.0 | 1841 | $1,550 | $0.84 | 24d | 1 | 0.29mi |
| 5 E 2nd St Pottstown, PA | 3.0 | 1.5 | 1085 | $2,000 | $1.84 | 3d | 1 | 0.29mi |
| 220 N Penn St Unit 1 Pottstown, PA | 3.0 | 1.0 | 1184 | $1,700 | $1.44 | 24d | 1 | 0.30mi |
| 130 E 4th St Unit 2 Pottstown, PA | 3.0 | 1.0 | 1808 | $1,850 | $1.02 | 44d | 1 | 0.33mi |
| 351 Union Aly Pottstown, PA | 4.0 | 1.5 | 1408 | $1,995 | $1.42 | 2d | 1 | 0.39mi |
| 365 Beech St Pottstown, PA | 4.0 | 1.0 | 1670 | $2,200 | $1.32 | 44d | 1 | 0.43mi |
| 310 N Charlotte St Pottstown, PA | 4.0 | 1.5 | 1990 | $2,100 | $1.06 | 44d | 1 | 0.45mi |
| 415 Walnut St Unit 1 Pottstown, PA | 3.0 | 1.0 | 1730 | $1,800 | $1.04 | 24d | 1 | 0.47mi |
| 457 Walnut St Pottstown, PA | 3.0 | 1.0 | 1274 | $1,600 | $1.26 | 44d | 1 | 0.55mi |
| 463 Spruce St Pottstown, PA | 4.0 | 1.5 | 1574 | $2,250 | $1.43 | 44d | 1 | 0.63mi |
| 541 Lincoln Ave Pottstown, PA | 3.0 | 1.0 | 1094 | $1,975 | $1.81 | 24d | 1 | 0.68mi |
| 614 Beech St Pottstown, PA | 3.0 | 1.5 | 1360 | $1,900 | $1.40 | 44d | 1 | 0.72mi |
| 226 Warren St Pottstown, PA | 3.0 | 1.5 | 1180 | $2,050 | $1.74 | 17d | 1 | 0.75mi |
| 657 N Charlotte St Unit 2 Pottstown, PA | 2.0 | 1.0 | 1050 | $1,700 | $1.62 | 1d | 1 | 0.88mi |
| 422 Upland St Pottstown, PA | 2.0–3.0 | 1.0–2.0 | 1082 | $1,875 | $1.73 | 1d | 5 | 0.89mi |
| 644 Kline Ave Pottstown, PA | 2.0 | 1.0–1.5 | 1103 | $2,195 | $1.99 | 1d | 2 | 0.91mi |
| 110 W Harmony Dr #107 Pottstown, PA | 2.0 | 2.0 | 1248 | $2,000 | $1.60 | 1d | 1 | 1.14mi |
Listing history 18 events
-
2026-06-15days on market $160,000 Active 25 DOM
-
2026-06-13days on market $160,000 Active 23 DOM
-
2026-06-13pricedays on market $160,000 Active 22 DOM
-
2026-06-09days on market $175,000 Active 19 DOM
-
2026-06-08days on market $175,000 Active 18 DOM
-
2026-06-07pricedays on market $175,000 Active 17 DOM
-
2026-06-04days on market $190,000 Active 14 DOM
-
2026-06-03days on market $190,000 Active 13 DOM
-
2026-06-02days on market $190,000 Active 12 DOM
-
2026-06-01days on market $190,000 Active 11 DOM
-
2026-05-31days on market $190,000 Active 10 DOM
-
2026-05-21$190,000 Active
-
2022-07-22soldstatus $137,800
-
2022-07-15soldstatus $137,800 Closed
-
2022-04-18historical
-
2021-10-18$139,900 Active
-
2013-04-11historical
-
2012-11-16$45,000
ⓘ Source: listings_history table (triggers on properties + properties_extension) + one-shot
backfill from property_details.listing_events for pre-trigger history.
Tax reassessment forecast PA · Partial reset (capped growth)
- Current annual tax
- $3,021 · $252/mo
- Projected year-2 tax
- $3,021 · $252/mo
- Expected delta
- $0/yr ($0/mo · 0.0%)
ⓘ Screening estimate from a state-policy table — verify with the county assessor before closing.
Climate risk First Street
- Flood 5/10 Major FEMA zone X (unshaded) · 26% chance over 30 yrs
- Wildfire 1/10 Low
- Heat 6/10 Major 7 d/yr ≥101°F today · 16 d/yr by 30 yrs out
- Wind 5/10 Major 23% chance of damaging wind over 30 yrs
- Air quality 3/10 Moderate 2 unhealthy d/yr today · 4 by 30 yrs out
Nearby sold comps map
Loading sold comps map…
Walkable amenities ~0.75 mi
Loading nearby amenities…
Taxation est. · year 1
- Rental income
- $22,762
- − Mortgage interest
- −$8,962
- − Property taxes
- −$3,021
- − Insurance
- −$800
- − Repairs & maintenance
- −$1,821
- − Management
- −$1,821
- − Depreciation
- −$4,655
- Taxable income
- $1,682
- Est. tax owed @ 24.0%
- −$404
- After-tax cash flow
- $3,689/yr
For passive investors: Depreciation is non-cash, so a rental often shows a tax loss while cash-flowing — sheltering income. Rental losses are passive: they offset passive income freely, and up to $25,000/yr can offset ordinary (W-2) income if you actively participate and your MAGI is under $100k (phasing out to $0 by $150k); unused losses carry forward. On sale, claimed depreciation is recaptured at up to 25%, and gains may owe capital-gains tax (a 1031 exchange can defer both). Figures are a year-1 estimate at your 24.0% rate — not tax advice; consult a CPA.
Schools (NCES district)
- District
- Pottstown SD
- NCES district ID
- 4219680
- Math proficiency
- 11% ▼ -12.00%
- Reading proficiency
- 23% ▼ -19.00%
- Median HH income
- $43,739
- Composite
- 14.78/100
- National rank
- #9390
- State rank
- #504 of 539 in PA
Livability — Pottstown
- Score
- 72/100
- State rank
- #643
- US rank
- #6257
Category grades
Schools grade is shown separately in the Schools card above.
Census & demographics
- Census place
- Pottstown, PA
- County
- Montgomery County · 712,331 people
- City population
- 49,101
- Metro
- Philadelphia-Camden-Wilmington, PA-NJ-DE-MD
- Population (ZIP)
- 49,101
- Household income
- $79,787
- Rent vs Own
- Severe rent burden
- 1797.0
Population outlook (Montgomery County) Hauer SSP2
- Today (2025)
- 856,074 people
- By 2030
- 870,887 · +1.7%
- By 2040
- 891,195 · +4.1%
- By 2050
- 896,417 · +4.7%
- By 2075
- 903,212 · +5.5%
- By 2100
- 843,240 · -1.5%
Race, ethnicity, and origin ACS 2023
- Neighborhood character
- Predominantly White (69%)
- Race & ethnicity
- White 69% Black 15% Two or more races 9% Hispanic / Latino 9% Asian 2%
- Hispanic origin (detail)
- Mexican 2% Puerto Rican 5%
- Common ancestry
- Romanian 7% Polish 2% Iranian 2%
- Foreign-born
- 6% · Canada, China
- Languages at home
- 92% English-only · Spanish 4% Arabic 1% Other Indo-European 1%
Political lean MEDSL · Montgomery
- 2024 margin
- Strong D (+22.8) · D 60.9% · R 38.1% · Other 1.1%
- 2008→2024 swing
- +2.0pp toward D · 2008: 20.8pp · 2024: 22.8pp
- All cycles
- 2024: D+22.8 2020: D+26.3 2016: D+21.1 2012: D+14.3 2008: D+20.8
Not yet ingested
- Civics
- —
Market trends
- HPI YoY
- ▼ -253.73%
- Current HPI
- 271.9399
- Rent YoY
- ▲ 4.93%
- Metro
- Philadelphia-Camden-Wilmington, PA-NJ-DE-MD
- State GDP YoY
- ▲ 1.68%
- F500 in state
- 34
Industry mix (Fortune 500 HQ in PA)
| Industry | F500 HQs | Revenue |
|---|---|---|
| Healthcare | 2 | $309B |
|
||
| Insurance | 2 | $27B |
|
||
| Telecommunications / Media | 1 | $124B |
|
||
| Industrial Distribution | 1 | $22B |
|
||
| Financial Services | 1 | $20B |
|
||
| Chemicals / Materials | 1 | $18B |
|
||
Price history
+322.2% since first listed7 events — show timeline
- 2026-05-21 Listed $190,000 BRIGHT MLS
- 2022-07-22 Sold (Public Records) $137,800 Public Records
- 2022-07-15 Sold (MLS) $137,800 BRIGHT MLS
- 2022-04-18 Listing Removed — BRIGHT MLS
- 2021-10-18 Listed $139,900 BRIGHT MLS
- 2013-04-11 Listing Removed — BRIGHT MLS
- 2012-11-16 Listed $45,000 BRIGHT MLS
Property tax history
+0.9%/yrLatest (2026): $3,021 · +5.1% YoY. Source: county tax records.
Cash-flow waterfall
monthlySold comps — $/sqft
last 12 mo · ≤1 miLoading sold comps…