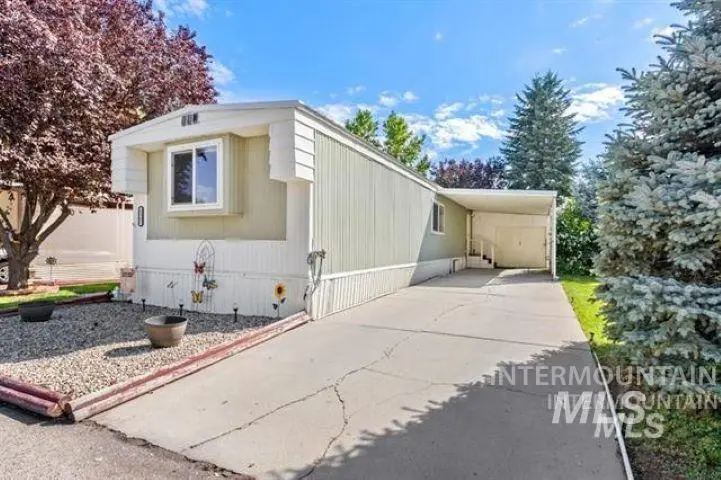
5262 N North Glen Ln #43 · Boise City, ID
Flood risk 1/10 · Minimal
- FEMA flood zone
- X (unshaded)
- Chance of flooding over 30 yrs
- 0.0%
- Est. flood insurance / yr
- $507 – $1,088
Fire risk 8/10 · Major
- Est. fire insurance / yr
- $584 – $1,086
Heat risk 4/10 · Minor
- Hot days now (above 97°F)
- 7 days/yr
- Hot days in 30 yrs
- 18 days/yr
Wind risk 1/10 · Minimal
- Chance of severe wind over 30 yrs
- —
Air-quality risk 9/10 · Severe
- Unhealthy air days now
- 19 days/yr
- Unhealthy air days in 30 yrs
- 19 days/yr
Risk factors via First Street. Map © Google.
Why this score? — see what drove the B- grade
The composite is a weighted blend of 9 inputs, each scored 0–100. Each bar is that input's sub-score; the figure is the points it added to the 100-point composite (weight × sub-score).
- Cash flow +30.0/30.0
- 1% rule +10.0/10.0
- DSCR +10.0/10.0
- Appreciation +5.0/10.0
- Schools +4.2/10.0
- Condition / age +3.8/5.0
- Rent growth +2.5/5.0
- Livability +2.5/5.0
- ARV discount +0.0/15.0
$75,000
🖨 Deal sheet 📄 Offer letter ✓ Due diligence
Listing remarks
Welcome home to Glenbrier Estates. Enjoy peaceful living in this cute 2 bed, 1 bath home, nestled at the back of the community. This private retreat offers quiet living with a covered patio surrounded by mature trees, lush landscaping, colorful flowers, and a grassy yard in highly sort after NW Boise. A full perimeter metal fence creates a pet-friendly place. Fabulous updates include a 3-year-old metal roof, newer interior paint in parts of home, and a new HVAC system, heat pump, with a water heater installed in January of 2022. The covered carport features convenient side entry access, the storage shed (with power) works as a workshop complete with a built-in workbench and a window looking
Key facts
- Covered patio
- Colorful flowers
- Lush landscaping
Tags
Property features AI
Finance
- Other: Property subtype: Mobile/Manufactured home on rented lot; Located in the Glenbrier subdivision; MLS area Boise W-Garden City
- HOA & community: Over-55 community; Mobile home park setting
Exterior
- Parking: Attached garage; Carport (2 spaces); RV access/parking; Finished driveway; 2 total covered parking spaces
- Utilities: City water service; Sewer connected; Cable connected; Broadband internet
- Home design: Mobile/manufactured home in a rented-lot community; Located in an over-55 community; Built in 1980
- Construction: Metal siding; Metal roof; Built in 1980; Shop (other structure)
- Exterior features: Full metal fencing; Covered patio/deck; Garden; Full and manual sprinkler systems; Shop on property
Interior
- Kitchen: Dishwasher; Disposal; Built-in oven/range; Refrigerator; Electric water heater; Heat pump water heater
- Bedrooms: 2 bedrooms (both on main level)
- Flooring: Carpet
- Bathrooms: 1 bathroom
- Heating & cooling: Forced air heating; Heat pump; Central air conditioning
- Interior features: Pantry; Master bedroom on main level
- Laundry & utility: Utilities include broadband internet and cable connection
Neighborhood map
What this means for you Summary
Snapshot
- This is a 2-bed/1.0-bath manufactured listed at $75k. Condition is rated good.
Deal economics
- At list price, monthly cash flow is $665 ($8k/yr) — positive.
- The deal already cash-flows at list — no discount required.
- Meets the 1% rule at list price ($1k rent vs $75k).
- Cap rate 16.9% vs local median 2.6% in Boise City — top-decile yield for the area; either an underpriced asset or a hidden risk that comps aren't pricing in. Stress-test before assuming the spread holds.
Location & tenants
- Location reads: area grade B — affects rentability + tenant quality, not the cash-flow math above.
- Boise Independent District (urban): math 42% / reading 56% proficiency, ranked #36 of 92 in ID (top 39%) — families likely to look elsewhere, expect single-tenant / working-renter base with shorter leases.
- Market conditions: 1 active listings in the ZIP; 14 comparable units currently listed for rent nearby; rentals at typical pace (median 15d on market — plan ~3-4 weeks tenant-placement turnaround); 5,129 units permitted in Ada County in 2024 (414 in 5+ unit buildings).
Forward outlook
- In year one you build about $3k of equity ($519 loan paydown + $2k appreciation (3.0% local appreciation)).
- Ada County population projected at +45% by 2050 — long-run rental-demand tailwind backs the buy-and-hold thesis.
- At projected returns (3.0% appreciation + 3.0% rent growth), your $21k cash investment doubles in ~2 years — after that, you're playing with house money.
Negotiation context
- Only 3 days on market — expect competitive offers; lowballing is unlikely to land.
- 3 sale attempts since 3y ago with the ask held roughly flat each time — persistent listings suggest the price (not the market) is what's stuck; bring a comps-based counter.
Risks & watch-outs
- Climate carrying-cost: severe wildfire risk — expect insurance premiums to compound above CPI over the hold.
Questions for the listing agent
- Is there a deadline driving the sale (1031 exchange, divorce, estate, relocation)? That informs how much negotiation room exists.
- What's the average days-on-market for RENTAL listings here right now (not sales)? A rising rental-DOM trend means longer vacancies and softer asking-rent achievability than the comps imply.
- What's the recent tenant-quality profile in this submarket — average credit score on applications, eviction rate, late-payment / NSF rate, and stable-employment percentage? A property-management company in the area should have these aggregated.
- How much new for-sale + rental construction is in the pipeline within 1–3 miles? Heavy new supply typically softens prices + rents 12–24 months out; constrained supply supports both.
Investment metrics
- 1% rule
- 2.00% ✓
- Cap rate
- 16.93%
- Cash-on-cash
- 38.00%
- DSCR
- 2.69
- GRM
- 4.2
CMA / ARV
- ARV (on-the-fly)
- $62,846
- Comps found
- 12
Show comp detail 12 sales within ~0.75 mi
| Address | Dist | Beds/Ba | Sqft | Sold | Price | $/sf | Match |
|---|---|---|---|---|---|---|---|
| 5262 N North Glen Ln #43 | 0.00mi | 2/1.0 | 938 (0%) | 0mo | $75,000 | $80 | 100 |
| 7015 W Royal Glen Ln | 0.09mi | 2/1.5 | 972 (+4%) | 1mo | $15,000 | $15 | 87 |
| 6990 W Royal Glen Ln | 0.09mi | 2/1.0 | 938 (0%) | 15mo | $44,900 | $48 | 84 |
| 5432 N Glencrest Ln | 0.02mi | 2/1.0 | 938 (0%) | 21mo | $30,000 | $32 | 82 |
| 6955 Royal Glen Ln | 0.06mi | 3/2.0 (+1) | 924 (-2%) | 9mo | $67,500 | $73 | 78 |
| 5285 N Glen | 0.07mi | 2/1.0 | 840 (-10%) | 2mo | $49,900 | $59 | 78 |
| 5637 Fairfax Ln | 0.67mi | 2/1.0 | 924 (-2%) | 1mo | $124,900 | $135 | 65 |
| 7973 Manassas | 0.64mi | 2/1.0 | 924 (-2%) | 9mo | $134,900 | $146 | 60 |
| 7837 W Manassas | 0.56mi | 2/2.0 | 924 (-2%) | 10mo | $50,000 | $54 | 59 |
| 5504 Glencrest Ln | 0.07mi | 2/2.0 | 1,044 (+11%) | 18mo | $69,900 | $67 | 59 |
| 7008 Royal Glen Ln | 0.10mi | 2/2.0 | 840 (-10%) | 20mo | $89,500 | $107 | 57 |
| 6971 Garden Glen Ln | 0.09mi | 2/2.0 | 1,056 (+13%) | 18mo | $69,500 | $66 | 56 |
Match score weights: distance 35% · size 25% · config 20% · recency 20%. Top-matched comps best support the ARV.
Projected returns pro-forma
3.0% appreciation · 3.0% rent growth · sell at horizon
- IRR
- 43.5%
- Equity multiple
- 3.45×
- Total profit
- $51,413
- Equity at exit
- $33,723
- IRR
- 43.4%
- Equity multiple
- 6.89×
- Total profit
- $123,708
- Equity at exit
- $51,972
Cash invested: $21,000 (down + closing). Projections, not guarantees.
Landlord ↔ Tenant lean methodology
- Overall (STATE)
- 91 Strongly Landlord-Friendly
- State Idaho
- 91 Strongly Landlord-Friendly · R+18
- County
- — inherits STATE
- City
- — inherits STATE
ZIP-level market 83714-2341
- Active inventory
- 1
- Price-to-rent
- 4.2×
Monthly cashflow live
- Estimated rent
- $1,498 high interval (Pro) →
- Mortgage (P&I)
- −$393
- Tax est. 1.5%
- −$94 /mo · $1,125/yr
- Insurance
- −$31
- HOA
- −$0
- Vacancy / Maint / Mgmt
- −$315
- Net cashflow
- $665
Break-even live
UW: 25.0% down · 7.5% · 30yr · 1.5% tax · 5.0% vac · 8.0% maint · 8.0% mgmt
Financing live
Cash to close
- Down payment
- $18,750
- Closing costs
- $2,250
- Reserves months
- —
- Total cash needed
- —
Loan-product check · same deal, 3 products live
Conventional
25% down · 7.5% · 30yr
- Down + closing
- —
- Monthly P&I
- —
- Monthly cashflow
- —
- DSCR
- —
- Eligible?
- —
Personal DTI + credit; lowest rate.
DSCR
20% down · 8.5% · 30yr
- Down + closing
- —
- Monthly P&I
- —
- Monthly cashflow
- —
- DSCR
- —
- Eligible?
- —
No personal income docs; deal must DSCR.
Hard money
10% down · 12.0% · 12mo
- Down + closing
- —
- Monthly P&I
- —
- Monthly cashflow
- —
- DSCR
- —
- Eligible?
- —
Short-term bridge; refi at stabilization.
Rent comps 14 comps
| Address | Beds | Baths | Sqft | Rent | $/sqft | DOM | Units | Dist |
|---|---|---|---|---|---|---|---|---|
| 5497 N Pierce Park Ln Unit 79-202 Boise, ID | 2.0 | 1.5 | 880 | $1,395 | $1.59 | 14d | 1 | 0.26mi |
| 5497 N Pierce Park Ln Unit 53-101 Boise, ID | 2.0 | 1.5 | 880 | $1,495 | $1.70 | 14d | 1 | 0.26mi |
| 5497 N Pierce Park Ln Boise, ID | 2.0 | 1.5 | 880 | $1,445 | $1.64 | 2d | 3 | 0.26mi |
| 6589 W Lucky Ln Boise, ID | 2.0 | 2.0 | 1025 | $1,450 | $1.41 | 19d | 1 | 0.38mi |
| 7570 W State St Boise, ID | 1.0–4.0 | 1.0–2.5 | 1236 | $1,817 | $1.47 | 2d | 21 | 0.43mi |
| 6474 W Lucky Ln Unit 12202 Boise, ID | 2.0 | 2.0 | 1100 | $1,500 | $1.36 | 23d | 1 | 0.45mi |
| 4807 N Fortune Ln Unit 201 Boise, ID | 2.0 | 2.0 | 925 | $1,245 | $1.35 | 14d | 1 | 0.45mi |
| 59515953 N Pierce Park Ln Unit 5951 Boise, ID | 2.0 | 1.0 | 850 | $1,450 | $1.71 | 3d | 1 | 0.49mi |
| 6200 N River Pointe Ln Garden City, ID | 1.0–3.0 | 1.0–2.0 | 1000 | $2,416 | $2.42 | 2d | 8 | 0.73mi |
| 6103 W State St Unit 6103-10 Garden City, ID | 1.0 | 1.0 | 580 | $1,150 | $1.98 | 23d | 1 | 0.85mi |
| 6103 W State St Unit 6103-12 Boise, ID | 2.0 | 1.0 | 825 | $1,350 | $1.64 | 23d | 1 | 0.85mi |
| 6043 W Port Pl Unit 104 Boise, ID | 2.0 | 2.0 | 950 | $1,345 | $1.42 | 3d | 1 | 0.86mi |
| 8255 W Limelight St Boise, ID | 1.0 | 1.0 | 724 | $1,545 | $2.13 | 2d | 3 | 0.88mi |
| 3950 N Cambria Way Boise, ID | 2.0 | 1.0 | 863 | $1,695 | $1.96 | 23d | 1 | 1.35mi |
Listing history 7 events
-
2026-05-15status Pending
-
2026-05-11$75,000 Active
-
2023-11-17historical
-
2023-10-11price $89,900
-
2023-10-04status Active
-
2023-09-11status Pending
-
2023-09-07$93,000 Active
ⓘ Source: listings_history table (triggers on properties + properties_extension) + one-shot
backfill from property_details.listing_events for pre-trigger history.
Climate risk First Street
- Flood 1/10 Low FEMA zone X (unshaded) · 0% chance over 30 yrs
- Wildfire 8/10 Severe
- Heat 4/10 Moderate 7 d/yr ≥97°F today · 18 d/yr by 30 yrs out
- Wind 1/10 Low
- Air quality 9/10 Extreme 19 unhealthy d/yr today · 19 by 30 yrs out
Nearby sold comps map
Loading sold comps map…
Walkable amenities ~0.75 mi
Loading nearby amenities…
Taxation est. · year 1
- Rental income
- $17,975
- − Mortgage interest
- −$4,201
- − Property taxes
- −$1,125
- − Insurance
- −$375
- − Repairs & maintenance
- −$1,438
- − Management
- −$1,438
- − Depreciation
- −$2,182
- Taxable income
- $7,216
- Est. tax owed @ 24.0%
- −$1,732
- After-tax cash flow
- $6,248/yr
For passive investors: Depreciation is non-cash, so a rental often shows a tax loss while cash-flowing — sheltering income. Rental losses are passive: they offset passive income freely, and up to $25,000/yr can offset ordinary (W-2) income if you actively participate and your MAGI is under $100k (phasing out to $0 by $150k); unused losses carry forward. On sale, claimed depreciation is recaptured at up to 25%, and gains may owe capital-gains tax (a 1031 exchange can defer both). Figures are a year-1 estimate at your 24.0% rate — not tax advice; consult a CPA.
Condition & rehab AI · 12 photos
This mobile home is in good condition with recent updates, including a metal roof and new HVAC system. It offers a good investment opportunity with potential for further updates to increase its value.
Value-add opportunities
- Both paint interior walls — Fresh paint enhances curb appeal and interior aesthetics
- Both update flooring in kitchen and living room — Modern flooring improves aesthetics and value
- Both install new window treatments — New curtains or blinds can enhance curb appeal and privacy
- Both landscape front yard — Landscaping can improve curb appeal and add value
Renovation cost estimate screening
Value-add ROI direction
- Both paint interior walls — Fresh paint enhances curb appeal and interior aesthetics ↑
- Both update flooring in kitchen and living room — Modern flooring improves aesthetics and value ↑
- Both install new window treatments — New curtains or blinds can enhance curb appeal and privacy ↑
- Both landscape front yard — Landscaping can improve curb appeal and add value ↑
ⓘ Cost ranges are severity-bucket heuristics (US national rule-of-thumb). Get contractor quotes + a written scope before underwriting a rehab budget.
Schools (NCES district)
- District
- Boise Independent District
- NCES district ID
- 1600360
- Math proficiency
- 42% ▼ -5.00%
- Reading proficiency
- 56% ▼ -1.00%
- Median HH income
- $49,135
- Composite
- 41.82/100
- National rank
- #3388
- State rank
- #36 of 92 in ID
Livability — Boise City
No livability data for this city. (Only ~50 U.S. cities are tracked.)
Census & demographics
- Census place
- Boise City, ID
Population outlook (Ada County) Hauer SSP2
- Today (2025)
- 535,818 people
- By 2030
- 585,751 · +9.3%
- By 2040
- 682,435 · +27.4%
- By 2050
- 775,818 · +44.8%
- By 2075
- 994,458 · +85.6%
- By 2100
- 1,148,884 · +114.4%
Not yet ingested
- Political lean
- —
- Race & ethnicity
- —
- Common origin
- —
- Civics
- —
Market trends
- HPI YoY
- —
- Current HPI
- —
- Rent YoY
- —
- Metro
- —
- State GDP YoY
- ▲ 4.51%
- F500 in state
- 6
Industry mix (Fortune 500 HQ in ID)
| Industry | F500 HQs | Revenue |
|---|---|---|
| Retail | 1 | $79B |
|
||
| Technology | 1 | $25B |
|
||
| Food / Agriculture | 1 | $6B |
|
||
Price history
-19.4% since first listed7 events — show timeline
- 2026-05-15 Pending — IMLS
- 2026-05-11 Listed $75,000 IMLS
- 2023-11-17 Listing Removed — IMLS
- 2023-10-11 Price Changed $89,900 IMLS
- 2023-10-04 Relisted — IMLS
- 2023-09-11 Pending — IMLS
- 2023-09-07 Listed $93,000 IMLS
Cash-flow waterfall
monthlySold comps — $/sqft
last 12 mo · ≤1 miLoading sold comps…