 🏗️ New Construction
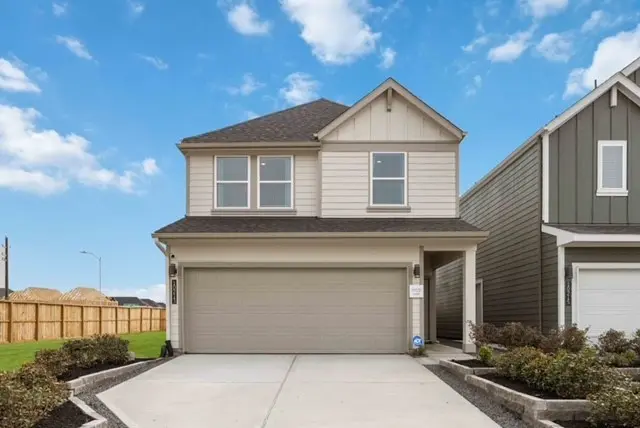
10302 Largent Hollow Trl · Houston, TX
Flood risk No data
- FEMA flood zone
- —
- Chance of flooding over 30 yrs
- —
- Est. flood insurance / yr
- —
Fire risk No data
- Est. fire insurance / yr
- —
Heat risk No data
- Hot days now (above threshold)
- —
- Hot days in 30 yrs
- —
Wind risk No data
- Chance of severe wind over 30 yrs
- —
Air-quality risk No data
- Unhealthy air days now
- —
- Unhealthy air days in 30 yrs
- —
Risk factors via First Street. Map © Google.
Why this score? — see what drove the D- grade
The composite is a weighted blend of 9 inputs, each scored 0–100. Each bar is that input's sub-score; the figure is the points it added to the 100-point composite (weight × sub-score).
- Appreciation +10.0/10.0
- ARV discount +7.5/15.0
- Cash flow +6.3/30.0
- Rent growth +3.7/5.0
- Livability +3.7/5.0
- Schools +2.7/10.0
- Condition / age +2.5/5.0
- 1% rule +1.9/10.0
- DSCR +0.6/10.0
$319,990
🖨 Deal sheet (PDF) 📄 Offer letter ✓ Due diligence
Listing remarks
The Jasmine floor plan, D. R. Horton’s newest 4 bedroom floorplan is a spacious two-story home offering 1,719 square feet of thoughtfully designed living space, complete with a two-car garage and 2.5 bathrooms. As you enter the home, you’re greeted by a charming front foyer that leads into the open-concept dining, living, and kitchen area, perfect for modern living and entertaining. The kitchen is a highlight, featuring a large island for additional storage and seating, as well as a walk-in pantry for added convenience. As you head upstairs, the second story reveals a functional layout that suits families of all sizes. At the back of the home, the private primary bedroom provide
Key facts
- Large windows
- Large island
- Two story home
Tags
Property features AI
Finance
- Other: Living area approximately 1,719; Lot about 3,397 sq ft (0.078 acres)
- HOA & community: Community managed by Inframark; Annual association fee of $1,350
Exterior
- Parking: Attached 2-car garage
- Utilities: Public water; Public sewer
- Home design: Residential property; Under construction (new construction); Single-family design (builder: DR Horton)
- Construction: Built in 2025; Cement siding; Composition roof; Slab foundation
- Exterior features: Back yard fencing; Subdivision lot; Fence
Interior
- Kitchen: Dishwasher; Garbage disposal; Microwave
- Bedrooms: Second-floor bedrooms (three bedrooms: approx. 10 x 10; 10 x 11; 10 x 10.8); Second-floor primary bedroom (approx. 14 x 11.8)
- Bathrooms: Two full bathrooms; One half bathroom
- Heating & cooling: Central heating (gas); Central electric air conditioning
- Interior features: Granite counters; Programmable thermostat; 4 total rooms; No fireplaces
- Laundry & utility: No specific laundry details listed
Neighborhood map
What this means for you Summary
Snapshot
- This is a 4-bed/2.5-bath single-family listed at $320k.
Deal economics
- At list price, monthly cash flow is $-608 ($-7k/yr) — negative.
- To cash-flow at today's rent, offer at most $252k (21.1% below list).
- To meet the 1% rule (rent ≥ 1% of price), the offer needs to be $235k (26.6% below list).
- Recommended offer: $235k (26.6% below list) — sets the bar for 1% rule.
- Cap rate 4.1% vs local median 3.2% in Houston — top-decile yield for the area; either an underpriced asset or a hidden risk that comps aren't pricing in. Stress-test before assuming the spread holds.
Location & tenants
- Location reads 74/100 on livability (#184 in TX, #4,771 nationally) — a middle-class / working-renter tenant base. Strengths: amenities A+, cost of living A+, housing A+; Watch: crime F.
- Houston ISD (urban): math 27% / reading 35% proficiency, ranked #593 of 826 in TX (top 72%) — families likely to look elsewhere, expect single-tenant / working-renter base with shorter leases; 71% free/reduced lunch — lower-income household profile, screen leases tightly.
- Zoned schools: Reynolds El (math 8% / reading 8%, grade F, #4,301 of 4,322 statewide, top 100%, 334 students, 98% FRL); Attucks Middle (math 15% / reading 22%, grade F, #1,478 of 1,662 statewide, top 90%, 439 students, 98% FRL); Worthing H S (math 22% / reading 21%, grade F, #1,377 of 1,632 statewide, top 85%, 827 students, 96% FRL) — zoned schools average 97% FRL vs 71% district-wide (26 pts higher); higher-poverty schools than district average — tighter screening recommended.
- Zoned-school proficiency averages 16% at this address vs 31% district-wide (-15 pts) — the specific schools serving this property underperform the Houston ISD average; the district grade overstates school quality for this exact location.
- Market conditions: Rents rising fast (+4.8%/yr); 321 active listings in the ZIP; 14 comparable units currently listed for rent nearby; rentals at typical pace (median 21d on market — plan ~3-4 weeks tenant-placement turnaround); lower-income renter base — watch delinquency; 29,883 units permitted in Harris County in 2024 (8,621 in 5+ unit buildings).
- At $2,350/mo this rent would consume 75% of the median local household income ($37k/yr) (locally 1446% of renters already pay >50% of income on rent) — very limited rent-growth headroom before tenants either downsize or default.
Forward outlook
- In year one you build about $36k of equity ($2k loan paydown + $34k appreciation (10.0% local appreciation)).
- Harris County population projected at +47% by 2050 — long-run rental-demand tailwind backs the buy-and-hold thesis.
- By year 2, paydown + projected appreciation supports a ~$58k cash-out refi (75% LTV) — recoverable capital for the next deal without selling this one.
Negotiation context
- It's been on market 19 days — a 2% lower offer ($315k) is reasonable based on typical stale-listing flexibility.
Questions for the listing agent
- What do current leases actually rent for vs. the listed asking? Can we see a recent rent roll and the last 12 months of T-12 income?
- What does the HOA fee cover, when was the last increase, and are there any pending special assessments or reserve-fund shortfalls?
- Is there a deadline driving the sale (1031 exchange, divorce, estate, relocation)? That informs how much negotiation room exists.
- Schools are D-rated, which usually means shorter tenancies and higher turnover. Who's the typical renter profile here, and what's been the actual vacancy rate?
- Crime grade is F in this area — have there been break-ins, vandalism, or insurance claims at this property in the last 3 years? What carrier currently insures it and at what premium?
- The area grade is low — what's the realistic commute time and amenity access for the typical tenant pool here? Any planned neighborhood developments (good or bad) we should know about?
- What's the average days-on-market for RENTAL listings here right now (not sales)? A rising rental-DOM trend means longer vacancies and softer asking-rent achievability than the comps imply.
- What's the recent tenant-quality profile in this submarket — average credit score on applications, eviction rate, late-payment / NSF rate, and stable-employment percentage? A property-management company in the area should have these aggregated.
- How much new for-sale + rental construction is in the pipeline within 1–3 miles? Heavy new supply typically softens prices + rents 12–24 months out; constrained supply supports both.
Investment metrics
- 1% rule
- 0.69% ✗
- Cap rate
- 4.15%
- Cash-on-cash
- -7.66%
- DSCR
- 0.66
- GRM
- 12.1
CMA / ARV
- ARV (on-the-fly)
- $340,362
- Comps found
- 12
Show comp detail 12 sales within ~0.75 mi
| Address | Dist | Beds/Ba | Sqft | Sold | Price | $/sf | Match |
|---|---|---|---|---|---|---|---|
| 2602 Afton Heights Way | 0.06mi | 4/2.5 | 1,719 (0%) | 2mo | $316,990 | $184 | 96 |
| 2610 Afton Heights Way | 0.07mi | 4/2.5 | 1,719 (0%) | 3mo | $319,990 | $186 | 94 |
| 10307 Sylvan Woods Trl | 0.26mi | 4/2.5 | 1,719 (0%) | 2mo | $319,990 | $186 | 86 |
| 10318 Largent Hollow Trl | 0.04mi | 3/2.5 (-1) | 1,586 (-8%) | 1mo | $313,990 | $198 | 80 |
| 2608 Afton Heights Way | 0.06mi | 3/2.5 (-1) | 1,586 (-8%) | 1mo | $313,990 | $198 | 78 |
| 2618 Afton Heights Way | 0.08mi | 3/2.5 (-1) | 1,586 (-8%) | 1mo | $299,990 | $189 | 78 |
| 2622 Afton Heights Way | 0.08mi | 3/2.5 (-1) | 1,586 (-8%) | 2mo | $310,990 | $196 | 77 |
| 2640 Afton Heights Way | 0.12mi | 3/2.5 (-1) | 1,586 (-8%) | 3mo | $313,990 | $198 | 74 |
| 10316 Largent Hollow Trl | 0.03mi | 3/2.5 (-1) | 1,486 (-14%) | 1mo | $306,990 | $207 | 70 |
| 10322 Penryn Forest Trl | 0.17mi | 3/2.5 (-1) | 1,486 (-14%) | 2mo | $304,990 | $205 | 63 |
| 10208 Penryn Forest Trl | 0.18mi | 3/2.5 (-1) | 1,486 (-14%) | 2mo | $299,990 | $202 | 62 |
| 9401 Kappa Dr | 0.72mi | 3/2.0 (-1) | 1,631 (-5%) | 1mo | $200,000 | $123 | 50 |
Match score weights: distance 35% · size 25% · config 20% · recency 20%. Top-matched comps best support the ARV.
Projected returns pro-forma
10.0% appreciation · 4.77% rent growth · sell at horizon
- IRR
- 19.4%
- Equity multiple
- 2.58×
- Total profit
- $150,981
- Equity at exit
- $306,625
- IRR
- 18.2%
- Equity multiple
- 6.08×
- Total profit
- $484,586
- Equity at exit
- $661,249
Cash invested: $95,301 (down + closing). Projections, not guarantees.
Landlord ↔ Tenant lean methodology
- Overall (STATE)
- 87 Strongly Landlord-Friendly
- State Texas
- 87 Strongly Landlord-Friendly · R+5
- County
- — inherits STATE
- City
- — inherits STATE
ZIP-level market 77051
- Home prices YoY
- 9.7%
- Rents YoY
- 4.8%
- Active inventory
- 321
- Price-to-rent
- 11.3×
Monthly cashflow live
- Estimated rent
- $2,350 high interval (Pro) →
- Mortgage (P&I)
- −$1,785
- Tax est. 1.5%
- −$425 /mo · $5,105/yr
- Insurance
- −$142
- HOA
- −$113
- Vacancy / Maint / Mgmt
- −$494
- Net cashflow
- $-608
Break-even live
Sensitivity live
| Price | -10% $-373 | -5% $-491 | +0% $-608 | +5% $-726 | +10% $-844 |
|---|---|---|---|---|---|
| Rent | -10% $-794 | -5% $-701 | +0% $-608 | +5% $-516 | +10% $-423 |
| Rate | -1.0pp $-437 | -0.5pp $-522 | base $-608 | +0.5pp $-697 | +1.0pp $-786 |
UW: 25.0% down · 7.5% · 30yr · 1.5% tax · 5.0% vac · 8.0% maint · 8.0% mgmt
Financing live
Cash to close
- Down payment
- $85,090
- Closing costs
- $10,211
- Reserves months
- —
- Total cash needed
- —
Loan-product check · same deal, 3 products live
Conventional
25% down · 7.5% · 30yr
- Down + closing
- —
- Monthly P&I
- —
- Monthly cashflow
- —
- DSCR
- —
- Eligible?
- —
Personal DTI + credit; lowest rate.
DSCR
20% down · 8.5% · 30yr
- Down + closing
- —
- Monthly P&I
- —
- Monthly cashflow
- —
- DSCR
- —
- Eligible?
- —
No personal income docs; deal must DSCR.
Hard money
10% down · 12.0% · 12mo
- Down + closing
- —
- Monthly P&I
- —
- Monthly cashflow
- —
- DSCR
- —
- Eligible?
- —
Short-term bridge; refi at stabilization.
Rent comps 14 comps
| Address | Beds | Baths | Sqft | Rent | $/sqft | DOM | Units | Dist |
|---|---|---|---|---|---|---|---|---|
| 10415 Lancaster Ln Houston, TX | 3.0–4.0 | 2.5 | 1937 | $2,735 | $1.41 | 22d | 1 | 0.18mi |
| 10514 Wellesley Terrace Trl Houston, TX | 3.0 | 3.0 | 1843 | $2,300 | $1.25 | 20d | 1 | 0.24mi |
| 2937 Amherst Meadow Ln Unit NA Houston, TX | 3.0 | 2.5 | 1820 | $2,400 | $1.32 | 6d | 1 | 0.35mi |
| 2937 Amherst Meadow Ln Houston, TX | 3.0 | 2.5 | 1820 | $2,450 | $1.35 | 24d | 1 | 0.35mi |
| 9610 Buffum St Houston, TX | 3.0 | 3.0 | 1605 | $1,799 | $1.12 | 45d | 1 | 0.52mi |
| 2910 Reed Rd Houston, TX | 3.0 | 2.0 | 1221 | $1,228 | $1.01 | 1d | 3 | 0.66mi |
| 2725 Reed Rd Houston, TX | 1.0–3.0 | 1.0–2.5 | 911 | $975 | $1.07 | 45d | 1 | 0.84mi |
| 9606 Ashville Dr Unit B Houston, TX | 3.0 | 2.0 | 1610 | $1,570 | $0.98 | 45d | 1 | 0.88mi |
| 11900 Oakmoor Pkwy Houston, TX | 1.0–3.0 | 1.0–2.0 | 892 | $1,469 | $1.65 | 4d | 12 | 1.01mi |
| 3710 Rockingham St Houston, TX | 3.0 | 2.0 | 1890 | $1,700 | $0.90 | 45d | 1 | 1.10mi |
| 12320 Chesney Downs Dr Houston, TX | 4.0 | 2.5 | 2000 | $3,500 | $1.75 | 4d | 1 | 1.40mi |
| 3002 Crown Gate Dr Unit 1568481P Houston, TX | 4.0 | 2.5 | 2195 | $3,345 | $1.52 | 1d | 1 | 1.42mi |
| 10301 Buffalo Speedway Unit 3047 Houston, TX | 3.0 | 2.0 | 1420 | $1,932 | $1.36 | 20d | 1 | 1.44mi |
| 10301 Buffalo Speedway Unit 3047 Houston, TX | 3.0 | 2.0 | 1420 | $1,961 | $1.38 | 5d | 1 | 1.44mi |
HOA detail
- Monthly dues
- $113 · $1,356/yr
Listing history 2 events
-
2026-04-13status Pending
-
2026-03-25$319,990 Active
ⓘ Source: listings_history table (triggers on properties + properties_extension) + one-shot
backfill from property_details.listing_events for pre-trigger history.
Nearby sold comps map
Loading sold comps map…
Walkable amenities ~0.75 mi
Loading nearby amenities…
Taxation est. · year 1
- Rental income
- $28,203
- − Mortgage interest
- −$19,066
- − Property taxes
- −$5,105
- − Insurance
- −$1,702
- − Repairs & maintenance
- −$2,256
- − Management
- −$2,256
- − HOA
- −$1,356
- − Depreciation
- −$9,901
- Taxable loss
- −$13,440
- Est. tax savings @ 24.0%
- +$3,226
- After-tax cash flow
- $-4,076/yr
For passive investors: Depreciation is non-cash, so a rental often shows a tax loss while cash-flowing — sheltering income. Rental losses are passive: they offset passive income freely, and up to $25,000/yr can offset ordinary (W-2) income if you actively participate and your MAGI is under $100k (phasing out to $0 by $150k); unused losses carry forward. On sale, claimed depreciation is recaptured at up to 25%, and gains may owe capital-gains tax (a 1031 exchange can defer both). Figures are a year-1 estimate at your 24.0% rate — not tax advice; consult a CPA.
Schools (NCES district)
- District
- Houston ISD
- NCES district ID
- 4823640
- Math proficiency
- 27% ▼ -18.00%
- Reading proficiency
- 35% ▼ -6.00%
- Median HH income
- $46,054
- Composite
- 26.63/100
- National rank
- #7173
- State rank
- #593 of 826 in TX
Livability — Houston
- Score
- 74/100
- State rank
- #184
- US rank
- #4771
Category grades
Schools grade is shown separately in the Schools card above.
Census & demographics
- Census place
- Houston, TX
- County
- Harris County · 4,702,590 people
- City population
- 3,226,434
- Metro
- Houston-The Woodlands-Sugar Land, TX
- Population (ZIP)
- 19,795
- Household income
- $37,415
- Rent vs Own
- Severe rent burden
- 1446.0
Population outlook (Harris County) Hauer SSP2
- Today (2025)
- 5,571,493 people
- By 2030
- 6,089,821 · +9.3%
- By 2040
- 7,142,806 · +28.2%
- By 2050
- 8,185,864 · +46.9%
- By 2075
- 10,574,329 · +89.8%
- By 2100
- 12,109,958 · +117.4%
Race, ethnicity, and origin ACS 2023
- Neighborhood character
- Predominantly Black (77%)
- Race & ethnicity
- Black 77% Hispanic / Latino 16% Two or more races 11% White 3%
- Hispanic origin (detail)
- Mexican 6% Puerto Rican 1%
- Foreign-born
- 8% · Canada, China
- Languages at home
- 88% English-only · Spanish 10%
Political lean MEDSL · Harris
- 2024 margin
- Lean D (+5.5) · D 52.0% · R 46.4% · Other 1.6%
- 2008→2024 swing
- +3.9pp toward D · 2008: 1.6pp · 2024: 5.5pp
- All cycles
- 2024: D+5.5 2020: D+13.3 2016: D+12.4 2012: D+0.1 2008: D+1.6
Not yet ingested
- Civics
- —
Market trends
- HPI YoY
- ▲ 16.02%
- Current HPI
- 180.4283
- Rent YoY
- ▲ 4.77%
- Metro
- Houston-The Woodlands-Sugar Land, TX
- State GDP YoY
- ▲ 3.95%
- F500 in state
- 110
Industry mix (Fortune 500 HQ in TX)
| Industry | F500 HQs | Revenue |
|---|---|---|
| Energy | 16 | $1,198B |
|
||
| Technology | 5 | $198B |
|
||
| Engineering / Construction | 4 | $72B |
|
||
| Energy Services | 3 | $60B |
|
||
| Utilities | 3 | $41B |
|
||
| Healthcare | 2 | $330B |
|
||
Price history
2 events — show timeline
- 2026-04-13 Pending — HARMLS
- 2026-03-25 Listed $319,990 HARMLS
Cash-flow waterfall
monthlySold comps — $/sqft
last 12 mo · ≤1 miLoading sold comps…