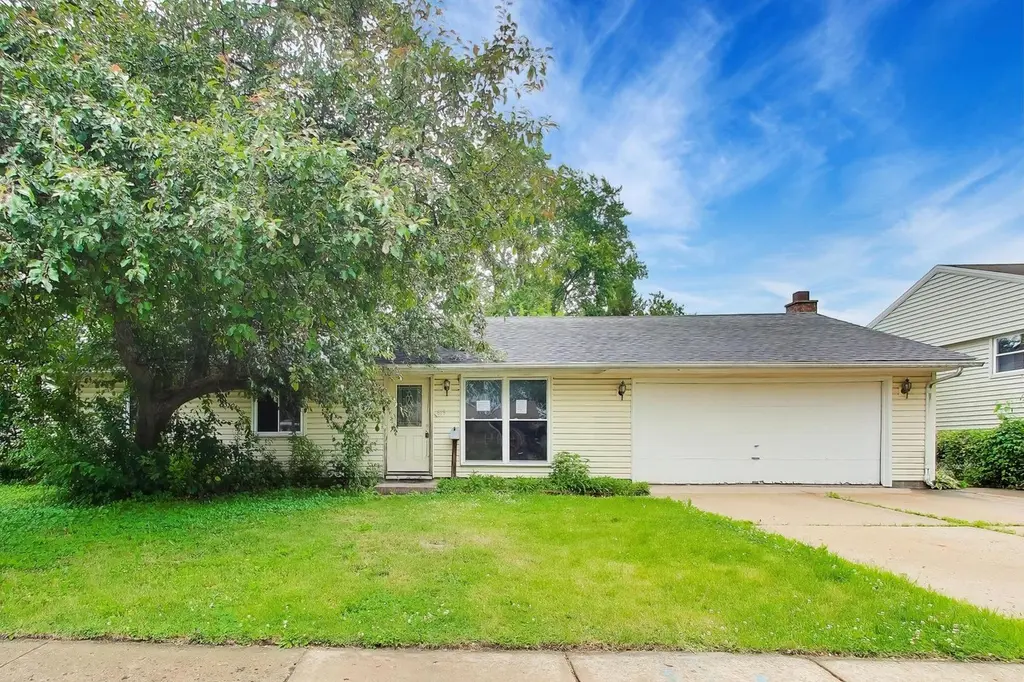
619 Parkside Cir · Streamwood, IL
Flood risk 1/10 · Minimal
- FEMA flood zone
- X (unshaded)
- Chance of flooding over 30 yrs
- 0.0%
- Est. flood insurance / yr
- $473 – $860
Fire risk 1/10 · Minimal
- Est. fire insurance / yr
- $804 – $1,492
Heat risk 2/10 · Minimal
- Hot days now (above 102°F)
- 7 days/yr
- Hot days in 30 yrs
- 14 days/yr
Wind risk 2/10 · Minimal
- Chance of severe wind over 30 yrs
- 1.0%
Air-quality risk 3/10 · Minor
- Unhealthy air days now
- 2 days/yr
- Unhealthy air days in 30 yrs
- 3 days/yr
Risk factors via First Street. Map © Google.
Why this score? — see what drove the D+ grade
The composite is a weighted blend of 9 inputs, each scored 0–100. Each bar is that input's sub-score; the figure is the points it added to the 100-point composite (weight × sub-score).
- ARV discount +13.6/15.0
- Cash flow +12.6/30.0
- 1% rule +4.6/10.0
- Livability +3.9/5.0
- DSCR +3.7/10.0
- Rent growth +3.3/5.0
- Condition / age +2.5/5.0
- Schools +1.9/10.0
- Appreciation +0.0/10.0
$295,000
🖨 Deal sheet (PDF) 📄 Offer letter ✓ Due diligence
Listing remarks
Welcome to this spacious and inviting 3-bedroom, 2-bathroom home offering an impressive combination of living space, functionality, and endless possibilities in a desirable Streamwood location. From the moment you arrive, you'll appreciate the home's welcoming presence, attractive curb appeal, and generous lot size that sets the stage for everything this property has to offer. Designed for comfortable everyday living and entertaining, the home features a thoughtful layout with multiple living areas that provide flexibility for today's lifestyle needs. Step inside to discover a bright and comfortable living room filled with natural light, creating a warm and welcoming atmosphere for family g
Key facts
- Oversized kitchen
- Bonus room
- Huge backyard
Tags
Property features AI
Finance
- Other: Living area measured from plans; Total finished area reported as 1,894
- HOA & community: No master association fee required
Exterior
- Parking: Four parking spaces total; Asphalt driveway; Owned parking
- Security: Carbon monoxide detectors
- Utilities: Public water; Public sewer
- Home design: Detached single-family home; One-story; Fee simple ownership; Built approximately 61–70 years ago; Facing/directions available via driving directions
- Construction: Vinyl siding; Asphalt roof; Concrete perimeter foundation; Built before 1978
- Exterior features: Lot dimensions approximately 69 x 40; Lot under 0.25 acre; School bus service
Interior
- Kitchen: Eating area/table space; Range; Microwave; Refrigerator
- Bedrooms: Three bedrooms (all on the main level) — primary 12 x 10; second 11 x 10; third 11 x 9
- Flooring: Ceramic tile in kitchen, living room and laundry
- Bathrooms: Two full bathrooms
- Heating & cooling: Natural gas heating; Central air conditioning; CO detectors; Ceiling fans
- Interior features: Seven total rooms; Recreation room (main level); Storage room (main level)
- Laundry & utility: In-unit laundry; Washer; Dryer; Laundry room (main level, 10 x 7)
Neighborhood map
What this means for you Summary
Snapshot
- This is a 4-bed/2.5-bath single-family listed at $295k.
Deal economics
- At list price, monthly cash flow is $-40 ($-482/yr) — negative.
- To cash-flow at today's rent, offer at most $288k (2.4% below list).
- To meet the 1% rule (rent ≥ 1% of price), the offer needs to be $283k (4.0% below list).
- Recommended offer: $283k (4.0% below list) — sets the bar for 1% rule.
- Cap rate 6.1% vs local median 4.5% in Streamwood — top-decile yield for the area; either an underpriced asset or a hidden risk that comps aren't pricing in. Stress-test before assuming the spread holds.
Location & tenants
- Location reads 78/100 on livability (#145 in IL, #2,660 nationally) — a middle-class / working-renter tenant base. Strengths: crime A+, employment A+, housing A+; Watch: commute D+, health & safety D+, amenities D.
- SD U-46 (suburban): math 19% / reading 20% proficiency, ranked #386 of 620 in IL (top 62%) — low school quality limits family demand, transient renter base, plan for 1-2y turnover.
- Zoned schools: Oakhill Elem School (math 8% / reading 8%, grade F, #1,627 of 2,056 statewide, top 81%, 444 students, 0% FRL); Canton Middle School (math 15% / reading 24%, grade F, #421 of 665 statewide, top 64%, 548 students, 0% FRL); Streamwood High School (math 17% / reading 24%, grade F, #350 of 693 statewide, top 51%, 1,976 students, 0% FRL) — zoned schools average 0% FRL vs 52% district-wide (52 pts lower); this property's tenant base skews higher-income than the district average.
- Market conditions: Rents rising (+3.1%/yr); 43 active listings in the ZIP; 12 comparable units currently listed for rent nearby; rentals at typical pace (median 27d on market — plan ~3-4 weeks tenant-placement turnaround); 42% of comp listings sitting > 30 days — soft ceiling on asking rent; solid renter incomes; 6,272 units permitted in Cook County in 2024 (4,658 in 5+ unit buildings).
- This rent runs 34% of the median local income ($101k/yr) — at the standard rent-burdened threshold; future hikes will face affordability resistance.
Forward outlook
- Local home prices are declining (-3.0%/yr); year-one equity from $2k of loan paydown is wiped out by about $9k of value loss. Plan a longer hold.
Negotiation context
- Only 12 days on market — expect competitive offers; lowballing is unlikely to land.
- 5 sale attempts with the ask held roughly flat each time — persistent listings suggest the price (not the market) is what's stuck; bring a comps-based counter.
- Current owner paid $170k; list at $295k implies a 74% gain — meaningful room to come down on a strong offer.
Questions for the listing agent
- What do current leases actually rent for vs. the listed asking? Can we see a recent rent roll and the last 12 months of T-12 income?
- Built in 1961 — when were the roof, HVAC, electrical panel, plumbing, and water heater last replaced?
- Is there a deadline driving the sale (1031 exchange, divorce, estate, relocation)? That informs how much negotiation room exists.
- Schools are D-rated, which usually means shorter tenancies and higher turnover. Who's the typical renter profile here, and what's been the actual vacancy rate?
- The area grade is low — what's the realistic commute time and amenity access for the typical tenant pool here? Any planned neighborhood developments (good or bad) we should know about?
- What's the average days-on-market for RENTAL listings here right now (not sales)? A rising rental-DOM trend means longer vacancies and softer asking-rent achievability than the comps imply.
- What's the recent tenant-quality profile in this submarket — average credit score on applications, eviction rate, late-payment / NSF rate, and stable-employment percentage? A property-management company in the area should have these aggregated.
- How much new for-sale + rental construction is in the pipeline within 1–3 miles? Heavy new supply typically softens prices + rents 12–24 months out; constrained supply supports both.
Investment metrics
- 1% rule
- 0.96% ✗
- Cap rate
- 6.13%
- Cash-on-cash
- -0.58%
- DSCR
- 0.97
- GRM
- 8.7
CMA / ARV
- ARV (on-the-fly)
- $341,172
- Comps found
- 12
Show comp detail 12 sales within ~0.75 mi
| Address | Dist | Beds/Ba | Sqft | Sold | Price | $/sf | Match |
|---|---|---|---|---|---|---|---|
| 416 Concord Dr | 0.36mi | 3/1.0 (-1) | 1,406 (+0%) | 3mo | $335,000 | $238 | 70 |
| 803 E Streamwood Blvd | 0.57mi | 4/2.0 | 1,425 (+2%) | 1mo | $352,900 | $248 | 68 |
| 401 Concord Dr | 0.45mi | 3/1.0 (-1) | 1,406 (+0%) | 2mo | $330,000 | $235 | 66 |
| 1013 Manor Dr | 0.42mi | 3/1.0 (-1) | 1,360 (-3%) | 1mo | $330,000 | $243 | 63 |
| 110 Cedar Cir | 0.39mi | 3/2.0 (-1) | 1,305 (-7%) | 2mo | $339,500 | $260 | 62 |
| 820 S Pine St | 0.40mi | 3/1.0 (-1) | 1,465 (+4%) | 2mo | $305,000 | $208 | 61 |
| 1020 S Park Blvd | 0.45mi | 4/2.0 | 1,600 (+14%) | 3mo | $260,001 | $163 | 51 |
| 1200 Nippert Dr | 0.60mi | 3/1.5 (-1) | 1,476 (+5%) | 4mo | $359,900 | $244 | 51 |
| 725 Russet Ln | 0.40mi | 3/1.0 (-1) | 1,237 (-12%) | 3mo | $226,000 | $183 | 48 |
| 815 Oriole Dr | 0.73mi | 3/3.0 (-1) | 1,550 (+10%) | 0mo | $330,000 | $213 | 41 |
| 9 Arthur Ct | 0.65mi | 3/2.5 (-1) | 1,588 (+13%) | 6mo | $395,000 | $249 | 38 |
| 128 Mccabe Dr | 0.73mi | 4/2.0 | 1,200 (-14%) | 4mo | $365,000 | $304 | 37 |
Match score weights: distance 35% · size 25% · config 20% · recency 20%. Top-matched comps best support the ARV.
Projected returns pro-forma
-3.0% appreciation · 3.1% rent growth · sell at horizon
- IRR
- -17.1%
- Equity multiple
- 0.40×
- Total profit
- $-49,888
- Equity at exit
- $43,985
- IRR
- -8.6%
- Equity multiple
- 0.46×
- Total profit
- $-44,795
- Equity at exit
- $25,506
Cash invested: $82,600 (down + closing). Projections, not guarantees.
Landlord ↔ Tenant lean methodology
- Overall (STATE)
- 43 Moderately Tenant-Leaning
- State Illinois
- 43 Moderately Tenant-Leaning · D+7
- County
- — inherits STATE
- City
- — inherits STATE
ZIP-level market 60107
- Rents YoY
- 3.1%
- Active inventory
- 43
- Price-to-rent
- 8.7×
Monthly cashflow live
- Estimated rent
- $2,833 high interval (Pro) →
- Mortgage (P&I)
- −$1,547
- Tax from tax record
- −$608 /mo · $7,295/yr
- Insurance
- −$123
- HOA
- −$0
- Vacancy / Maint / Mgmt
- −$595
- Net cashflow
- $-40
Break-even live
Sensitivity live
| Price | -10% $127 | -5% $43 | +0% $-40 | +5% $-124 | +10% $-207 |
|---|---|---|---|---|---|
| Rent | -10% $-264 | -5% $-152 | +0% $-40 | +5% $72 | +10% $184 |
| Rate | -1.0pp $108 | -0.5pp $35 | base $-40 | +0.5pp $-117 | +1.0pp $-194 |
UW: 25.0% down · 7.5% · 30yr · 1.5% tax · 5.0% vac · 8.0% maint · 8.0% mgmt
Financing live
Cash to close
- Down payment
- $73,750
- Closing costs
- $8,850
- Reserves months
- —
- Total cash needed
- —
Loan-product check · same deal, 3 products live
Conventional
25% down · 7.5% · 30yr
- Down + closing
- —
- Monthly P&I
- —
- Monthly cashflow
- —
- DSCR
- —
- Eligible?
- —
Personal DTI + credit; lowest rate.
DSCR
20% down · 8.5% · 30yr
- Down + closing
- —
- Monthly P&I
- —
- Monthly cashflow
- —
- DSCR
- —
- Eligible?
- —
No personal income docs; deal must DSCR.
Hard money
10% down · 12.0% · 12mo
- Down + closing
- —
- Monthly P&I
- —
- Monthly cashflow
- —
- DSCR
- —
- Eligible?
- —
Short-term bridge; refi at stabilization.
Rent comps 12 comps
| Address | Beds | Baths | Sqft | Rent | $/sqft | DOM | Units | Dist |
|---|---|---|---|---|---|---|---|---|
| 1004 Oakland Dr Streamwood, IL | 3.0 | 1.0 | 1060 | $2,525 | $2.38 | 14d | 1 | 0.34mi |
| 1020 S Park Blvd Streamwood, IL | 4.0 | 2.0 | 1600 | $3,300 | $2.06 | 6d | 1 | 0.45mi |
| 202 E Streamwood Blvd Streamwood, IL | 3.0 | 1.0 | 1060 | $2,650 | $2.50 | 45d | 1 | 0.63mi |
| 17 S Bartlett Rd Streamwood, IL | 3.0 | 1.0 | 1100 | $2,800 | $2.55 | 45d | 1 | 0.81mi |
| 515 Freeman Ave Streamwood, IL | 3.0 | 1.0 | 1150 | $2,300 | $2.00 | 12d | 1 | 0.87mi |
| 515 Freeman Ave Streamwood, IL | 3.0 | 1.0 | 1150 | $2,400 | $2.09 | 26d | 1 | 0.87mi |
| 28 N Oltendorf Rd Streamwood, IL | 3.0 | 2.5 | 1379 | $2,750 | $1.99 | 45d | 1 | 0.96mi |
| 300 Teak Ln Streamwood, IL | 3.0 | 1.5 | 1286 | $2,200 | $1.71 | 26d | 1 | 1.00mi |
| 1503 McKool Ave Streamwood, IL | 4.0 | 2.0 | 1300 | $3,000 | $2.31 | 45d | 1 | 1.03mi |
| 260 Wayne Ct Unit 2 Bartlett, IL | 3.0 | 1.0 | 1200 | $2,150 | $1.79 | 14d | 1 | 1.37mi |
| 1839 McKool Ave Unit 1839 Streamwood, IL | 4.0 | 1.5 | 1400 | $3,350 | $2.39 | 26d | 1 | 1.39mi |
| 1851 McKool Ave Streamwood, IL | 3.0 | 1.5 | 1160 | $2,100 | $1.81 | 45d | 1 | 1.42mi |
Listing history 8 events
-
2026-06-21days on market $295,000 Active 12 DOM
-
2026-06-18days on market $295,000 Active 9 DOM
-
2026-06-17days on market $295,000 Active 8 DOM
-
2026-06-16days on market $295,000 Active 7 DOM
-
2026-06-15days on market $295,000 Active 6 DOM
-
2026-06-13days on market $295,000 Active 4 DOM
-
2026-06-10remarks 699-char remark
-
2026-06-10$295,000 Active 1 DOM
ⓘ Source: listings_history table (triggers on properties + properties_extension) + one-shot
backfill from property_details.listing_events for pre-trigger history.
Tax reassessment forecast IL · Partial reset (capped growth)
- Current annual tax
- $7,295 · $608/mo
- Projected year-2 tax
- $7,295 · $608/mo
- Expected delta
- $0/yr ($0/mo · 0.0%)
ⓘ Screening estimate from a state-policy table — verify with the county assessor before closing.
Climate risk First Street
- Flood 1/10 Low FEMA zone X (unshaded) · 0% chance over 30 yrs
- Wildfire 1/10 Low
- Heat 2/10 Low 7 d/yr ≥102°F today · 14 d/yr by 30 yrs out
- Wind 2/10 Low 100% chance of damaging wind over 30 yrs
- Air quality 3/10 Moderate 2 unhealthy d/yr today · 3 by 30 yrs out
Nearby sold comps map
Loading sold comps map…
Walkable amenities ~0.75 mi
Loading nearby amenities…
Taxation est. · year 1
- Rental income
- $33,990
- − Mortgage interest
- −$16,525
- − Property taxes
- −$7,295
- − Insurance
- −$1,475
- − Repairs & maintenance
- −$2,719
- − Management
- −$2,719
- − Depreciation
- −$8,582
- Taxable loss
- −$5,325
- Est. tax savings @ 24.0%
- +$1,278
- After-tax cash flow
- $796/yr
For passive investors: Depreciation is non-cash, so a rental often shows a tax loss while cash-flowing — sheltering income. Rental losses are passive: they offset passive income freely, and up to $25,000/yr can offset ordinary (W-2) income if you actively participate and your MAGI is under $100k (phasing out to $0 by $150k); unused losses carry forward. On sale, claimed depreciation is recaptured at up to 25%, and gains may owe capital-gains tax (a 1031 exchange can defer both). Figures are a year-1 estimate at your 24.0% rate — not tax advice; consult a CPA.
Schools (NCES district)
- District
- SD U-46
- NCES district ID
- 1713710
- Math proficiency
- 19% ▼ -7.00%
- Reading proficiency
- 20% ▼ -7.00%
- Median HH income
- $69,757
- Composite
- 19.39/100
- National rank
- #8783
- State rank
- #386 of 620 in IL
Livability — Streamwood
- Score
- 78/100
- State rank
- #145
- US rank
- #2660
Category grades
Schools grade is shown separately in the Schools card above.
Census & demographics
- Census place
- Streamwood, IL
- County
- Cook County · 4,486,803 people
- City population
- 38,886
- Metro
- Chicago-Naperville-Elgin, IL-IN-WI
- Population (ZIP)
- 38,886
- Household income
- $101,100
- Rent vs Own
- Severe rent burden
- 511.0
Population outlook (Cook County) Hauer SSP2
- Today (2025)
- 5,347,519 people
- By 2030
- 5,357,703 · +0.2%
- By 2040
- 5,324,924 · -0.4%
- By 2050
- 5,230,762 · -2.2%
- By 2075
- 4,785,735 · -10.5%
- By 2100
- 4,188,836 · -21.7%
Race, ethnicity, and origin ACS 2023
- Neighborhood character
- Diverse neighborhood (Simpson 0.67)
- Race & ethnicity
- White 39% Hispanic / Latino 39% Two or more races 23% Asian 14% Black 4% Native American 1%
- Hispanic origin (detail)
- Mexican 33% Puerto Rican 1%
- Common ancestry
- Romanian 8% Portuguese 1% French 1%
- Foreign-born
- 33% · Canada, South Korea, China
- Languages at home
- 47% English-only · Spanish 32% Other Indo-European 8% Russian/Polish/Slavic 5%
Political lean MEDSL · Cook
- 2024 margin
- Solid D (+42.0) · D 70.4% · R 28.4% · Other 1.2%
- 2008→2024 swing
- -11.4pp toward R · 2008: 53.4pp · 2024: 42.0pp
- All cycles
- 2024: D+42.0 2020: D+50.3 2016: D+53.0 2012: D+49.4 2008: D+53.4
Not yet ingested
- Civics
- —
Market trends
- HPI YoY
- ▼ -239.04%
- Current HPI
- 222.0977
- Rent YoY
- ▲ 3.10%
- Metro
- Chicago-Naperville-Elgin, IL-IN-WI
- State GDP YoY
- ▲ 1.59%
- F500 in state
- 60
Industry mix (Fortune 500 HQ in IL)
| Industry | F500 HQs | Revenue |
|---|---|---|
| Insurance | 4 | $201B |
|
||
| Consumer Goods | 4 | $87B |
|
||
| Industrial Machinery | 3 | $64B |
|
||
| Healthcare | 2 | $55B |
|
||
| Retail / Pharmacy | 1 | $148B |
|
||
| Agriculture / Food | 1 | $86B |
|
||
Price history
+73.5% since first listed13 events — show timeline
- 2026-06-09 Listed $295,000 MRED as Distributed by MLS Grid
- 2026-01-09 Listing Removed — MRED as Distributed by MLS Grid
- 2025-09-02 Contingent — MRED as Distributed by MLS Grid
- 2025-08-31 Listing Removed — MRED as Distributed by MLS Grid
- 2025-08-20 Relisted — MRED as Distributed by MLS Grid
- 2025-07-26 Listing Removed — MRED as Distributed by MLS Grid
- 2025-07-25 Relisted — MRED as Distributed by MLS Grid
- 2025-06-12 Contingent — MRED as Distributed by MLS Grid
- 2025-06-02 Price Changed — MRED as Distributed by MLS Grid
- 2025-05-16 Listing Removed — MRED as Distributed by MLS Grid
- 2025-05-16 Listed — MRED as Distributed by MLS Grid
- 2025-05-15 Listed — MRED as Distributed by MLS Grid
- 2001-10-04 Sold (Public Records) $170,000 Public Records
Property tax history
+3.4%/yrLatest (2023): $7,295 · +3.1% YoY. Source: county tax records.
Cash-flow waterfall
monthlySold comps — $/sqft
last 12 mo · ≤1 miLoading sold comps…