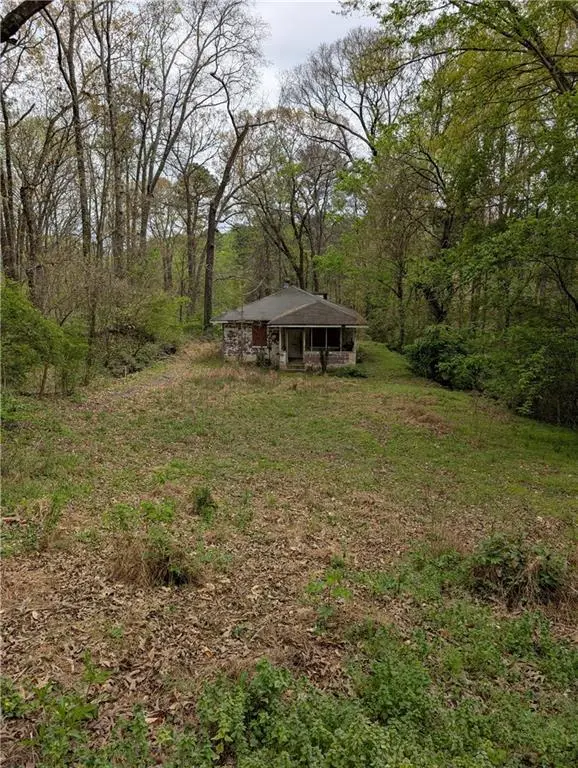
2206 Mack Dr NW · Atlanta, GA
Flood risk 1/10 · Minimal
- FEMA flood zone
- X (unshaded)
- Chance of flooding over 30 yrs
- 0.0%
- Est. flood insurance / yr
- $507 – $1,088
Fire risk 2/10 · Minimal
- Est. fire insurance / yr
- $963 – $1,789
Heat risk 5/10 · Moderate
- Hot days now (above 104°F)
- 6 days/yr
- Hot days in 30 yrs
- 15 days/yr
Wind risk 4/10 · Minor
- Chance of severe wind over 30 yrs
- 21.0%
Air-quality risk 4/10 · Minor
- Unhealthy air days now
- 3 days/yr
- Unhealthy air days in 30 yrs
- 5 days/yr
Risk factors via First Street. Map © Google.
Why this score? — see what drove the C- grade
The composite is a weighted blend of 9 inputs, each scored 0–100. Each bar is that input's sub-score; the figure is the points it added to the 100-point composite (weight × sub-score).
- Cash flow +19.5/30.0
- ARV discount +10.4/15.0
- DSCR +6.1/10.0
- 1% rule +4.7/10.0
- Livability +4.2/5.0
- Rent growth +3.3/5.0
- Schools +2.7/10.0
- Condition / age +2.5/5.0
- Appreciation +0.0/10.0
$150,000
🖨 Deal sheet 📄 Offer letter ✓ Due diligence
Listing remarks MLS
Excellent investment or redevelopment opportunity in the rapidly appreciating 30318 area. Property sits on a spacious, private lot surrounded by mature trees, offering strong potential for renovation or new construction. Nearby comparable sales are reaching the high $400s to $500s, highlighting the upside in this location. Convenient to major highways, Westside developments, and downtown Atlanta. Property sold as-is with no disclosures. Bring your builder or vision and capitalize on the growth in this area
Key facts
- 0.34 acre lot
- Built 1955
- Listed 77 days
Neighborhood map
What this means for you Summary
Snapshot
- This is a 2-bed/1.0-bath land listed at $150k.
Deal economics
- At list price, monthly cash flow is $169 ($2k/yr) — positive.
- The deal already cash-flows at list — no discount required.
- To meet the 1% rule (rent ≥ 1% of price), the offer needs to be $145k (3.1% below list).
- Recommended offer: $141k (6.0% below list) — sets the bar for market timing.
- Cap rate 7.6% vs local median 3.1% in Atlanta — top-decile yield for the area; either an underpriced asset or a hidden risk that comps aren't pricing in. Stress-test before assuming the spread holds.
Location & tenants
- Location reads 83/100 on livability (#6 in GA, #919 nationally) — a professional / high-income tenant draw. Strengths: amenities A+, commute A+, housing A+; Watch: schools C-, cost of living C-.
- Atlanta Public Schools (urban): math 28% / reading 35% proficiency, ranked #80 of 174 in GA (top 46%) — families likely to look elsewhere, expect single-tenant / working-renter base with shorter leases; 71% free/reduced lunch — lower-income household profile, screen leases tightly.
- Market conditions: Rents rising (+3.3%/yr); 722 active listings in the ZIP; 15 comparable units currently listed for rent nearby; rentals leasing fast (median 11d on market — plan ~1-2 weeks tenant-placement turnaround); solid renter incomes; 11,565 units permitted in Fulton County in 2024 (8,159 in 5+ unit buildings).
Forward outlook
- Local home prices are declining (-3.0%/yr); year-one equity from $1k of loan paydown is wiped out by about $4k of value loss. Plan a longer hold.
- Fulton County population projected at +38% by 2050 — long-run rental-demand tailwind backs the buy-and-hold thesis.
Negotiation context
- It's been on market 77 days — a 6% lower offer ($141k) is reasonable based on typical stale-listing flexibility.
- 9 sale attempts since 7y ago with the ask held roughly flat each time — persistent listings suggest the price (not the market) is what's stuck; bring a comps-based counter.
- Current owner paid $65k; list at $150k implies a 131% gain — meaningful room to come down on a strong offer.
Risks & watch-outs
- Watch-outs: built in 1955 — expect roof / HVAC / electrical / plumbing capex.
- Climate carrying-cost: extreme-heat days projected 6→15/yr by 2055 (HVAC capex compounding) — expect insurance premiums to compound above CPI over the hold.
Questions for the listing agent
- It's been on market 77 days. Have you received any prior offers? Is the seller open to a 6% concession, seller financing, or rate buy-down credit?
- Built in 1955 — when were the roof, HVAC, electrical panel, plumbing, and water heater last replaced?
- Why hasn't it sold? Are there any deal-killer items the seller is aware of (foundation, flood, title, zoning, code violations)?
- Is there a deadline driving the sale (1031 exchange, divorce, estate, relocation)? That informs how much negotiation room exists.
- What's the average days-on-market for RENTAL listings here right now (not sales)? A rising rental-DOM trend means longer vacancies and softer asking-rent achievability than the comps imply.
- What's the recent tenant-quality profile in this submarket — average credit score on applications, eviction rate, late-payment / NSF rate, and stable-employment percentage? A property-management company in the area should have these aggregated.
- How much new for-sale + rental construction is in the pipeline within 1–3 miles? Heavy new supply typically softens prices + rents 12–24 months out; constrained supply supports both.
Investment metrics
- 1% rule
- 0.97% ✗
- Cap rate
- 7.65%
- Cash-on-cash
- 4.83%
- DSCR
- 1.21
- GRM
- 8.6
CMA / ARV
- ARV (median comp)
- $160,164
- List price
- $150,000
- Delta
- -6.35%
- Verdict
- FAIR
- Comps
- 20 within 1.0 mi
Projected returns pro-forma
-3.0% appreciation · 3.26% rent growth · sell at horizon
- IRR
- -8.5%
- Equity multiple
- 0.69×
- Total profit
- $-13,171
- Equity at exit
- $22,365
- IRR
- 1.3%
- Equity multiple
- 1.09×
- Total profit
- $3,912
- Equity at exit
- $12,969
Cash invested: $42,000 (down + closing). Projections, not guarantees.
Landlord ↔ Tenant lean methodology
- Overall (STATE)
- 90 Strongly Landlord-Friendly
- State Georgia
- 90 Strongly Landlord-Friendly · R+3
- County
- — inherits STATE
- City
- — inherits STATE
ZIP-level market 30318
- Rents YoY
- 3.3%
- Active inventory
- 722
- Price-to-rent
- 8.6×
Monthly cashflow live
- Estimated rent
- $1,453 high interval (Pro) →
- Mortgage (P&I)
- −$787
- Tax from tax record
- −$130 /mo · $1,555/yr
- Insurance
- −$62
- HOA
- −$0
- Vacancy / Maint / Mgmt
- −$305
- Net cashflow
- $169
Break-even live
UW: 25.0% down · 7.5% · 30yr · 1.5% tax · 5.0% vac · 8.0% maint · 8.0% mgmt
Financing live
Cash to close
- Down payment
- $37,500
- Closing costs
- $4,500
- Reserves months
- —
- Total cash needed
- —
Loan-product check · same deal, 3 products live
Conventional
25% down · 7.5% · 30yr
- Down + closing
- —
- Monthly P&I
- —
- Monthly cashflow
- —
- DSCR
- —
- Eligible?
- —
Personal DTI + credit; lowest rate.
DSCR
20% down · 8.5% · 30yr
- Down + closing
- —
- Monthly P&I
- —
- Monthly cashflow
- —
- DSCR
- —
- Eligible?
- —
No personal income docs; deal must DSCR.
Hard money
10% down · 12.0% · 12mo
- Down + closing
- —
- Monthly P&I
- —
- Monthly cashflow
- —
- DSCR
- —
- Eligible?
- —
Short-term bridge; refi at stabilization.
Rent comps 15 comps
| Address | Beds | Baths | Sqft | Rent | $/sqft | DOM | Units | Dist |
|---|---|---|---|---|---|---|---|---|
| 2284 Alvin Dr NW Unit D Atlanta, GA | 2.0 | 1.0 | 868 | $995 | $1.15 | 3d | 1 | 0.23mi |
| 2284 Alvin Dr NW Unit B 1 Atlanta, GA | 3.0 | 1.0 | 875 | $1,025 | $1.17 | 3d | 1 | 0.23mi |
| 1110 Cato St NW Atlanta, GA | 3.0 | 1.0 | 1050 | $1,400 | $1.33 | 24d | 1 | 0.39mi |
| 929 N Grand Ave NW Atlanta, GA | 3.0 | 2.0 | 1100 | $2,500 | $2.27 | 24d | 1 | 0.67mi |
| 1648 Mary George Ave NW Atlanta, GA | 3.0 | 2.0 | 1056 | $1,950 | $1.85 | 11d | 1 | 0.78mi |
| 1620 Hollywood Rd NW Atlanta, GA | 3.0 | 1.0 | 937 | $1,199 | $1.28 | 3d | 1 | 0.91mi |
| 1620 Hollywood Rd NW Atlanta, GA | 1.0 | 1.0 | 609 | $899 | $1.48 | 24d | 1 | 0.91mi |
| 2430 Perry Blvd NW Atlanta, GA | 2.0 | 1.0 | 800 | $1,500 | $1.88 | 24d | 1 | 1.11mi |
| 2265 Perry Blvd NW Atlanta, GA | 3.0 | 1.0 | 645 | $1,428 | $2.21 | 3d | 24 | 1.14mi |
| 1315 Northwest Dr NW Atlanta, GA | 3.0 | 1.0–2.0 | 908 | $2,059 | $2.27 | 2d | 36 | 1.15mi |
| 1958 Maywood Pl NW Atlanta, GA | 2.0 | 1.0 | 829 | $1,425 | $1.72 | 5d | 1 | 1.32mi |
| 2862 Argyle Dr NW Atlanta, GA | 3.0 | 1.0 | 816 | $1,700 | $2.08 | 5d | 1 | 1.40mi |
| 2019 Claude St NW Atlanta, GA | 3.0 | 1.5 | 925 | $1,900 | $2.05 | 24d | 1 | 1.44mi |
| 2625 Peyton Rd NW Atlanta, GA | 3.0 | 2.0 | 1100 | $2,300 | $2.09 | 18d | 1 | 1.48mi |
| 518 Pelton Pl NW Atlanta, GA | 1.0 | 1.0 | 1036 | $750 | $0.72 | 24d | 1 | 1.50mi |
Listing history 40 events
-
2026-06-18days on market $150,000 Active 77 DOM
-
2026-06-17days on market $150,000 Active 76 DOM
-
2026-06-16days on market $150,000 Active 75 DOM
-
2026-06-15days on market $150,000 Active 74 DOM
-
2026-06-13days on market $150,000 Active 72 DOM
-
2026-06-13days on market $150,000 Active 71 DOM
-
2026-06-09days on market $150,000 Active 68 DOM
-
2026-06-08days on market $150,000 Active 67 DOM
-
2026-06-07days on market $150,000 Active 66 DOM
-
2026-06-04days on market $150,000 Active 63 DOM
-
2026-06-03days on market $150,000 Active 62 DOM
-
2026-06-02days on market $150,000 Active 61 DOM
-
2026-06-01days on market $150,000 Active 60 DOM
-
2026-05-31days on market $150,000 Active 59 DOM
-
2026-04-02$150,000 Active 511-char remark
Show marketing remark (511 chars)
Excellent investment or redevelopment opportunity in the rapidly appreciating 30318 area. Property sits on a spacious, private lot surrounded by mature trees, offering strong potential for renovation or new construction. Nearby comparable sales are reaching the high $400s to $500s, highlighting the upside in this location. Convenient to major highways, Westside developments, and downtown Atlanta. Property sold as-is with no disclosures. Bring your builder or vision and capitalize on the growth in this area
-
2026-03-31historical $150,000 511-char remark
Show marketing remark (511 chars)
Excellent investment or redevelopment opportunity in the rapidly appreciating 30318 area. Property sits on a spacious, private lot surrounded by mature trees, offering strong potential for renovation or new construction. Nearby comparable sales are reaching the high $400s to $500s, highlighting the upside in this location. Convenient to major highways, Westside developments, and downtown Atlanta. Property sold as-is with no disclosures. Bring your builder or vision and capitalize on the growth in this area
-
2026-03-30$150,000 New 511-char remark
Show marketing remark (511 chars)
Excellent investment or redevelopment opportunity in the rapidly appreciating 30318 area. Property sits on a spacious, private lot surrounded by mature trees, offering strong potential for renovation or new construction. Nearby comparable sales are reaching the high $400s to $500s, highlighting the upside in this location. Convenient to major highways, Westside developments, and downtown Atlanta. Property sold as-is with no disclosures. Bring your builder or vision and capitalize on the growth in this area
-
2024-10-07soldstatus $65,000
-
2024-10-04soldstatus $65,000 Closed
-
2024-09-19historical Active Under Contract
-
2024-08-26price $95,000
-
2024-08-26status Active
-
2024-08-03historical Active Under Contract
-
2024-06-30price $85,000
-
2024-05-18price $98,500
-
2024-04-17$120,000 Active
-
2021-08-30historical
-
2021-08-21$140,000 New
-
2019-08-16soldstatus $38,000 Closed
-
2019-08-16soldstatus $38,000 Sold
-
2019-08-03status Pending
-
2019-08-03status Under Contract
-
2019-08-01status Active
-
2019-08-01status Back on Market
-
2019-07-29status Pending
-
2019-07-29status Under Contract
-
2019-07-18price $45,000
-
2019-07-18price $45,000
-
2019-07-09$50,000 Active
-
2019-07-09$50,000 New
ⓘ Source: listings_history table (triggers on properties + properties_extension) + one-shot
backfill from property_details.listing_events for pre-trigger history.
Tax reassessment forecast GA · Resets to sale price
- Current annual tax
- $1,555 · $130/mo
- Projected year-2 tax
- $1,555 · $130/mo
- Expected delta
- $0/yr ($0/mo · 0.0%)
ⓘ Screening estimate from a state-policy table — verify with the county assessor before closing.
Climate risk First Street
- Flood 1/10 Low FEMA zone X (unshaded) · 0% chance over 30 yrs
- Wildfire 2/10 Low
- Heat 5/10 Major 6 d/yr ≥104°F today · 15 d/yr by 30 yrs out
- Wind 4/10 Moderate 21% chance of damaging wind over 30 yrs
- Air quality 4/10 Moderate 3 unhealthy d/yr today · 5 by 30 yrs out
Nearby sold comps map
Loading sold comps map…
Walkable amenities ~0.75 mi
Loading nearby amenities…
Taxation est. · year 1
- Rental income
- $17,434
- − Mortgage interest
- −$8,402
- − Property taxes
- −$1,555
- − Insurance
- −$750
- − Repairs & maintenance
- −$1,395
- − Management
- −$1,395
- − Depreciation
- −$4,364
- Taxable loss
- −$426
- Est. tax savings @ 24.0%
- +$102
- After-tax cash flow
- $2,131/yr
For passive investors: Depreciation is non-cash, so a rental often shows a tax loss while cash-flowing — sheltering income. Rental losses are passive: they offset passive income freely, and up to $25,000/yr can offset ordinary (W-2) income if you actively participate and your MAGI is under $100k (phasing out to $0 by $150k); unused losses carry forward. On sale, claimed depreciation is recaptured at up to 25%, and gains may owe capital-gains tax (a 1031 exchange can defer both). Figures are a year-1 estimate at your 24.0% rate — not tax advice; consult a CPA.
Schools (NCES district)
- District
- Atlanta Public Schools
- NCES district ID
- 1300120
- Math proficiency
- 28% ▼ -6.00%
- Reading proficiency
- 35% ▼ -2.00%
- Median HH income
- $48,306
- Composite
- 27.27/100
- National rank
- #7006
- State rank
- #80 of 174 in GA
Livability — Atlanta
- Score
- 83/100
- State rank
- #6
- US rank
- #919
Category grades
Schools grade is shown separately in the Schools card above.
Census & demographics
- Census place
- Atlanta, GA
- County
- Fulton County · 1,094,430 people
- City population
- 629,525
- Metro
- Atlanta-Sandy Springs-Alpharetta, GA
- Population (ZIP)
- 59,609
- Household income
- $83,116
- Rent vs Own
- Severe rent burden
- 4182.0
Population outlook (Fulton County) Hauer SSP2
- Today (2025)
- 1,203,707 people
- By 2030
- 1,299,706 · +8.0%
- By 2040
- 1,488,256 · +23.6%
- By 2050
- 1,664,580 · +38.3%
- By 2075
- 2,036,072 · +69.2%
- By 2100
- 2,222,402 · +84.6%
Race, ethnicity, and origin ACS 2023
- Neighborhood character
- Diverse neighborhood (Simpson 0.63)
- Race & ethnicity
- Black 49% White 35% Hispanic / Latino 7% Two or more races 6% Asian 5%
- Hispanic origin (detail)
- Mexican 2% Puerto Rican 1%
- Common ancestry
- Lithuanian 2% Slovak 2% Romanian 1%
- Foreign-born
- 8% · Canada, China, South Korea
- Languages at home
- 88% English-only · Spanish 4% Other Indo-European 2% Other Asian/Pacific 1%
Political lean MEDSL · Fulton
- 2024 margin
- Solid D (+44.9) · D 71.9% · R 27.0% · Other 1.1%
- 2008→2024 swing
- +9.8pp toward D · 2008: 35.0pp · 2024: 44.9pp
- All cycles
- 2024: D+44.9 2020: D+46.4 2016: D+42.1 2012: D+29.6 2008: D+35.0
Not yet ingested
- Civics
- —
Market trends
- HPI YoY
- ▼ -470.82%
- Current HPI
- 224.1493
- Rent YoY
- ▲ 3.26%
- Metro
- Atlanta-Sandy Springs-Alpharetta, GA
- State GDP YoY
- ▲ 2.66%
- F500 in state
- 28
Industry mix (Fortune 500 HQ in GA)
| Industry | F500 HQs | Revenue |
|---|---|---|
| Paper / Packaging | 2 | $29B |
|
||
| Retail | 1 | $160B |
|
||
| Transportation / Logistics | 1 | $91B |
|
||
| Airlines | 1 | $62B |
|
||
| Consumer Goods | 1 | $47B |
|
||
| Utilities | 1 | $25B |
|
||
Price history
+200.0% since first listed26 events — show timeline
- 2026-04-02 Listed $150,000 FMLS
- 2026-03-31 Coming Soon $150,000 FMLS
- 2026-03-30 Listed $150,000 GAMLS
- 2024-10-07 Sold (Public Records) $65,000 Public Records
- 2024-10-04 Sold (MLS) $65,000 FMLS
- 2024-09-19 Contingent — FMLS
- 2024-08-26 Price Changed $95,000 FMLS
- 2024-08-26 Relisted — FMLS
- 2024-08-03 Contingent — FMLS
- 2024-06-30 Price Changed $85,000 FMLS
- 2024-05-18 Price Changed $98,500 FMLS
- 2024-04-17 Listed $120,000 FMLS
- 2021-08-30 Listing Removed — GAMLS
- 2021-08-21 Listed $140,000 GAMLS
- 2019-08-16 Sold (MLS) $38,000 GAMLS
- 2019-08-16 Sold (MLS) $38,000 FMLS
- 2019-08-03 Pending — FMLS
- 2019-08-03 Pending — GAMLS
- 2019-08-01 Relisted — FMLS
- 2019-08-01 Relisted — GAMLS
- 2019-07-29 Pending — FMLS
- 2019-07-29 Pending — GAMLS
- 2019-07-18 Price Changed $45,000 GAMLS
- 2019-07-18 Price Changed $45,000 FMLS
- 2019-07-09 Listed $50,000 GAMLS
- 2019-07-09 Listed $50,000 FMLS
Property tax history
+9.9%/yrLatest (2025): $1,555 · +39.0% YoY. Source: county tax records.
Cash-flow waterfall
monthlySold comps — $/sqft
last 12 mo · ≤1 miLoading sold comps…