189 Ten Mile Cir #231 · Copper Mountain, CO
Flood risk 4/10 · Minor
- FEMA flood zone
- X (unshaded)
- Chance of flooding over 30 yrs
- 0.21%
- Est. flood insurance / yr
- $507 – $1,088
Fire risk 3/10 · Minor
- Est. fire insurance / yr
- $939 – $1,743
Heat risk 1/10 · Minimal
- Hot days now (above 73°F)
- 13 days/yr
- Hot days in 30 yrs
- 34 days/yr
Wind risk 1/10 · Minimal
- Chance of severe wind over 30 yrs
- —
Air-quality risk 2/10 · Minimal
- Unhealthy air days now
- 0 days/yr
- Unhealthy air days in 30 yrs
- 1 days/yr
Risk factors via First Street. Map © Google.
Why this score? — see what drove the C- grade
The composite is a weighted blend of 9 inputs, each scored 0–100. Each bar is that input's sub-score; the figure is the points it added to the 100-point composite (weight × sub-score).
- Cash flow +15.0/30.0
- ARV discount +7.5/15.0
- Appreciation +6.6/10.0
- 1% rule +5.0/10.0
- DSCR +5.0/10.0
- Schools +3.2/10.0
- Livability +3.2/5.0
- Rent growth +2.5/5.0
- Condition / age +2.5/5.0
$7,000
🖨 Deal sheet 📄 Offer letter ✓ Due diligence
Listing remarks MLS
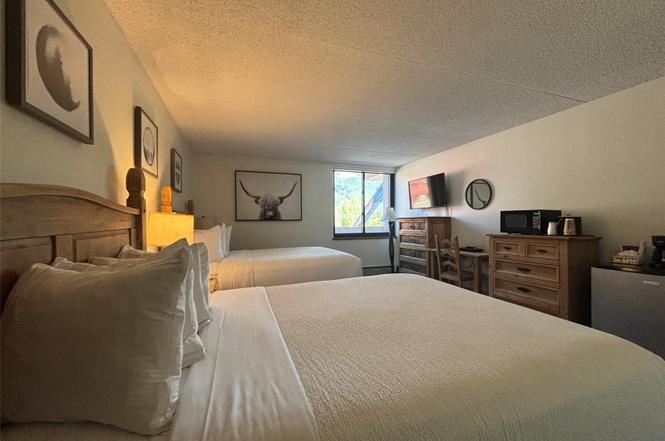
Week #51 EVERY YEAR! Late December is the very best time to visit the Copper Mountain Resort! This beautiful 2 bedroom /3 bath condo is just steps from Copper's American Eagle Ski Lift, ski rental shops, restaurants & plenty of shopping! Walk along heated paths & enjoy all of Copper's winter activities including skiing, snowboarding, snowshoeing, cross country skiing, dinner sleigh rides & more!
Key facts
- Large balcony
- 1.44 acre lot
- Built 1982
Tags
Property features AI
Finance
- Other: Planned Unit Development zoning
- HOA & community: Homeowners association with annual fee; Annual association fee approximately $2,908 (about $242.33/month); Building has elevators
Exterior
- Parking: Underground, unassigned parking
- Utilities: Public water; Cable available; Electricity available; Natural gas available; Sewer available; Water available
- Home design: Residential timeshare; Common interest timeshare
- Construction: Concrete construction
- Exterior features: Metal roof; City lot; Near public transit; Paved road access; Has a view
Interior
- Kitchen: Dishwasher; Electric cooktop; Disposal; Microwave; Refrigerator
- Flooring: Carpet
- Bathrooms: 3 full bathrooms
- Heating & cooling: Baseboard heating; Central heating; Hot water heating
- Interior features: Furnished; Gas fireplace
- Laundry & utility: Laundry room / common area laundry
Neighborhood map
What this means for you Summary
Snapshot
- This is a 2-bed/3.0-bath timeshare listed at $7k.
Deal economics
- At list price, monthly cash flow is $2k ($26k/yr) — positive.
- The deal already cash-flows at list — no discount required.
- Meets the 1% rule at list price ($3k rent vs $7k).
- Cap rate 379.3% vs local median 1.4% in Copper Mountain — top-decile yield for the area; either an underpriced asset or a hidden risk that comps aren't pricing in. Stress-test before assuming the spread holds.
Location & tenants
- Location reads 65/100 on livability (#164 in CO) — a middle-class / working-renter tenant base. Strengths: crime A, employment B+, health & safety B+; Watch: cost of living C-, amenities F, commute F.
- Summit School District No. RE-1 (rural): math 27% / reading 43% proficiency, ranked #35 of 86 in CO (top 41%) — families likely to look elsewhere, expect single-tenant / working-renter base with shorter leases.
- Market conditions: 173 active listings in the ZIP; solid renter incomes; 308 units permitted in Summit County in 2024 (123 in 5+ unit buildings).
- This rent runs 34% of the median local income ($109k/yr) — at the standard rent-burdened threshold; future hikes will face affordability resistance.
Forward outlook
- In year one you build about $270 of equity ($48 loan paydown + $222 appreciation (3.2% local appreciation)).
- Summit County population projected at +32% by 2050 — long-run rental-demand tailwind backs the buy-and-hold thesis.
- At projected returns (3.2% appreciation + 3.0% rent growth), your $2k cash investment doubles in ~1 year — after that, you're playing with house money.
Negotiation context
- Only 6 days on market — expect competitive offers; lowballing is unlikely to land.
- 3 sale attempts since 12y ago with the ask held roughly flat each time — persistent listings suggest the price (not the market) is what's stuck; bring a comps-based counter.
Questions for the listing agent
- What does the HOA fee cover, when was the last increase, and are there any pending special assessments or reserve-fund shortfalls?
- Is there a deadline driving the sale (1031 exchange, divorce, estate, relocation)? That informs how much negotiation room exists.
- What's the average days-on-market for RENTAL listings here right now (not sales)? A rising rental-DOM trend means longer vacancies and softer asking-rent achievability than the comps imply.
- What's the recent tenant-quality profile in this submarket — average credit score on applications, eviction rate, late-payment / NSF rate, and stable-employment percentage? A property-management company in the area should have these aggregated.
- How much new for-sale + rental construction is in the pipeline within 1–3 miles? Heavy new supply typically softens prices + rents 12–24 months out; constrained supply supports both.
Investment metrics
- 1% rule
- 44.59% ✓
- Cap rate
- 379.27%
- Cash-on-cash
- 1332.06%
- DSCR
- 60.27
- GRM
- 0.2
CMA / ARV
No comps found within radius.
Projected returns pro-forma
3.17% appreciation · 3.0% rent growth · sell at horizon
- IRR
- —
- Equity multiple
- 72.26×
- Total profit
- $139,674
- Equity at exit
- $3,215
- IRR
- —
- Equity multiple
- 155.70×
- Total profit
- $303,216
- Equity at exit
- $5,008
Cash invested: $1,960 (down + closing). Projections, not guarantees.
Landlord ↔ Tenant lean methodology
- Overall (STATE)
- 38 Tenant-Leaning
- State Colorado
- 38 Tenant-Leaning · D+4
- County
- — inherits STATE
- City
- — inherits STATE
ZIP-level market 80443
- Home prices YoY
- 1.3%
- Active inventory
- 173
- Price-to-rent
- 0.2×
Monthly cashflow live
- Estimated rent
- $3,122 medium interval (Pro) →
- Mortgage (P&I)
- −$37
- Tax est. 1.5%
- −$9 /mo · $105/yr
- Insurance
- −$3
- HOA
- −$242
- Vacancy / Maint / Mgmt
- −$656
- Net cashflow
- $2,176
Break-even live
UW: 25.0% down · 7.5% · 30yr · 1.5% tax · 5.0% vac · 8.0% maint · 8.0% mgmt
Financing live
Cash to close
- Down payment
- $1,750
- Closing costs
- $210
- Reserves months
- —
- Total cash needed
- —
Loan-product check · same deal, 3 products live
Conventional
25% down · 7.5% · 30yr
- Down + closing
- —
- Monthly P&I
- —
- Monthly cashflow
- —
- DSCR
- —
- Eligible?
- —
Personal DTI + credit; lowest rate.
DSCR
20% down · 8.5% · 30yr
- Down + closing
- —
- Monthly P&I
- —
- Monthly cashflow
- —
- DSCR
- —
- Eligible?
- —
No personal income docs; deal must DSCR.
Hard money
10% down · 12.0% · 12mo
- Down + closing
- —
- Monthly P&I
- —
- Monthly cashflow
- —
- DSCR
- —
- Eligible?
- —
Short-term bridge; refi at stabilization.
HOA detail
- Monthly dues
- $242 · $2,904/yr
Listing history 7 events
-
2026-06-19days on market $7,000 Active 6 DOM
-
2026-06-18days on market $7,000 Active 5 DOM
-
2026-06-17days on market $7,000 Active 4 DOM
-
2026-06-16days on market $7,000 Active 3 DOM
-
2026-06-15days on market $7,000 Active 2 DOM
-
2026-06-14remarks 420-char remark
-
2026-06-14$7,000 Active 1 DOM
ⓘ Source: listings_history table (triggers on properties + properties_extension) + one-shot
backfill from property_details.listing_events for pre-trigger history.
Climate risk First Street
- Flood 4/10 Moderate FEMA zone X (unshaded) · 21% chance over 30 yrs
- Wildfire 3/10 Moderate
- Heat 1/10 Low 13 d/yr ≥73°F today · 34 d/yr by 30 yrs out
- Wind 1/10 Low
- Air quality 2/10 Low 0 unhealthy d/yr today · 1 by 30 yrs out
Nearby sold comps map
Loading sold comps map…
Walkable amenities ~0.75 mi
Loading nearby amenities…
Taxation est. · year 1
- Rental income
- $37,459
- − Mortgage interest
- −$392
- − Property taxes
- −$105
- − Insurance
- −$35
- − Repairs & maintenance
- −$2,997
- − Management
- −$2,997
- − HOA
- −$2,904
- − Depreciation
- −$204
- Taxable income
- $27,826
- Est. tax owed @ 24.0%
- −$6,678
- After-tax cash flow
- $19,430/yr
For passive investors: Depreciation is non-cash, so a rental often shows a tax loss while cash-flowing — sheltering income. Rental losses are passive: they offset passive income freely, and up to $25,000/yr can offset ordinary (W-2) income if you actively participate and your MAGI is under $100k (phasing out to $0 by $150k); unused losses carry forward. On sale, claimed depreciation is recaptured at up to 25%, and gains may owe capital-gains tax (a 1031 exchange can defer both). Figures are a year-1 estimate at your 24.0% rate — not tax advice; consult a CPA.
Schools (NCES district)
- District
- Summit School District No. RE-1
- NCES district ID
- 0806810
- Math proficiency
- 27% ▼ -7.00%
- Reading proficiency
- 43% ▼ -7.00%
- Median HH income
- $67,591
- Composite
- 31.97/100
- National rank
- #5840
- State rank
- #35 of 86 in CO
Livability — Copper Mountain
- Score
- 65/100
- State rank
- #164
- US rank
- #12975
Category grades
Schools grade is shown separately in the Schools card above.
Census & demographics
- Census place
- Copper Mountain, CO
- County
- Summit County · 31,352 people
- Metro
- Breckenridge, CO
- Population (ZIP)
- 3,992
- Household income
- $108,710
- Rent vs Own
- Severe rent burden
- 81.0
Population outlook (Summit County) Hauer SSP2
- Today (2025)
- 35,421 people
- By 2030
- 37,983 · +7.2%
- By 2040
- 42,597 · +20.3%
- By 2050
- 46,695 · +31.8%
- By 2075
- 55,288 · +56.1%
- By 2100
- 61,033 · +72.3%
Race, ethnicity, and origin ACS 2023
- Neighborhood character
- Predominantly White (75%)
- Race & ethnicity
- White 75% Two or more races 21% Hispanic / Latino 5%
- Common ancestry
- Italian 6% Slovak 6% Romanian 4%
- Foreign-born
- 8% · Canada, China
- Languages at home
- 93% English-only · Spanish 5% Russian/Polish/Slavic 1% German/W. Germanic 1%
Political lean MEDSL · Summit
- 2024 margin
- Solid D (+37.2) · D 67.0% · R 29.9% · Other 3.1%
- 2008→2024 swing
- +4.1pp toward D · 2008: 33.0pp · 2024: 37.2pp
- All cycles
- 2024: D+37.2 2020: D+39.5 2016: D+27.6 2012: D+24.4 2008: D+33.0
Not yet ingested
- Civics
- —
Market trends
- HPI YoY
- ▲ 3.17%
- Current HPI
- 244.5969
- Rent YoY
- —
- Metro
- Breckenridge, CO
- State GDP YoY
- ▲ 1.95%
- F500 in state
- 14
Industry mix (Fortune 500 HQ in CO)
| Industry | F500 HQs | Revenue |
|---|---|---|
| Technology Distribution | 1 | $31B |
|
||
| Food / Agriculture | 1 | $18B |
|
||
| Packaging | 1 | $14B |
|
||
| Healthcare | 1 | $13B |
|
||
| Energy | 1 | $10B |
|
||
| Technology | 1 | $4B |
|
||
Price history
+42.9% since first listed7 events — show timeline
- 2026-06-13 Listed $7,000 SAR
- 2016-04-11 Sold (Public Records) $15,000 Public Records
- 2016-01-22 Sold (Public Records) $8,000 Public Records
- 2016-01-20 Sold (MLS) $8,000 SAR
- 2015-08-26 Listed $9,500 SAR
- 2014-06-16 Sold (MLS) $4,000 SAR
- 2014-04-25 Listed $4,900 SAR
Property tax history
+4.6%/yrLatest (2025): $3,132 · +21.6% YoY. Source: county tax records.
Cash-flow waterfall
monthlySold comps — $/sqft
last 12 mo · ≤1 miLoading sold comps…