U.S. Highway 19 · Clearwater, FL
Flood risk 1/10 · Minimal
- FEMA flood zone
- X
- Chance of flooding over 30 yrs
- 0.0%
- Est. flood insurance / yr
- $435 – $905
Fire risk 1/10 · Minimal
- Est. fire insurance / yr
- $947 – $1,759
Heat risk 10/10 · Severe
- Hot days now (above threshold)
- 7 days/yr
- Hot days in 30 yrs
- 28 days/yr
Wind risk No data
- Chance of severe wind over 30 yrs
- —
Air-quality risk 3/10 · Minor
- Unhealthy air days now
- 3 days/yr
- Unhealthy air days in 30 yrs
- 3 days/yr
Risk factors via First Street. Map © Google.
Why this score? — see what drove the D grade
The composite is a weighted blend of 9 inputs, each scored 0–100. Each bar is that input's sub-score; the figure is the points it added to the 100-point composite (weight × sub-score).
- Cash flow +15.0/30.0
- ARV discount +7.5/15.0
- 1% rule +5.0/10.0
- DSCR +5.0/10.0
- Schools +4.3/10.0
- Livability +4.1/5.0
- Condition / age +2.5/5.0
- Rent growth +1.3/5.0
- Appreciation +0.0/10.0
$24,000
🖨 Deal sheet 📄 Offer letter ✓ Due diligence
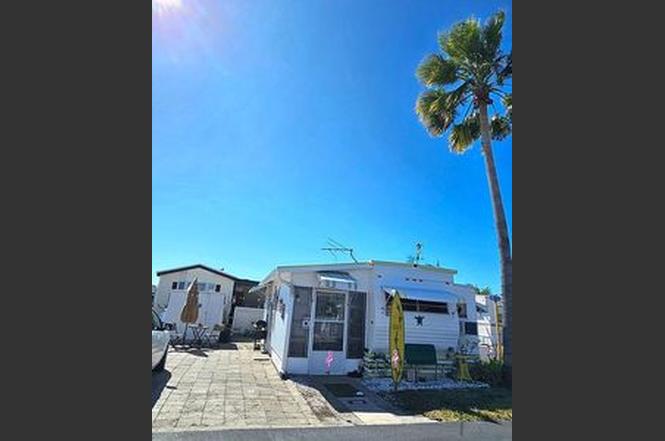
Listing remarks
& quot; & quot; 1983 35 foot Capri Park Model with 2 slide outs (460 sq ft) in adult park with awesome Jacuzzi pool and active club house. Rent $640 a month includes water trash landscapers paved roads. Storage unit may be available. One bedroom with large bright living area separate/lanai kitchen/laundry area. Four entrance doors one in bedroom. Faux wood blinds in main living area with Venetian blinds and lace in kitchen/lanai for total privacy or natural light. Completely screened. Lanai/kitchen has sliding vinyl windows for closure or cross breeze on two sides. Quiet corner lot with decent view. Three mature trees with grass. Small garden alcove area has night and day b
Key facts
- Four entrance doors
- Quiet corner lot
- Jacuzzi pool
Tags
Neighborhood map
What this means for you Summary
Snapshot
- This is a 1-bed/1.0-bath land listed at $24k.
Deal economics
- At list price, monthly cash flow is $1k ($15k/yr) — positive.
- The deal already cash-flows at list — no discount required.
- Meets the 1% rule at list price ($2k rent vs $24k).
- Cap rate 68.3% vs local median 2.9% in Clearwater — top-decile yield for the area; either an underpriced asset or a hidden risk that comps aren't pricing in. Stress-test before assuming the spread holds.
Location & tenants
- Location reads 82/100 on livability (#60 in FL, #988 nationally) — a professional / high-income tenant draw. Strengths: commute A+, housing A+, health & safety A+; Watch: schools C-, employment C-.
- Pinellas (suburban): math 51% / reading 51% proficiency, ranked #31 of 73 in FL (top 42%) — acceptable for families but not a draw, mixed tenant base, ~2y average lease.
- Market conditions: Rents falling (-4.6%/yr); 83 active listings in the ZIP; 39 comparable units currently listed for rent nearby; rentals leasing fast (median 4d on market — plan ~1-2 weeks tenant-placement turnaround); 2,676 units permitted in Pinellas County in 2024 (1,422 in 5+ unit buildings).
- This rent runs 31% of the median local income ($69k/yr) — at the standard rent-burdened threshold; future hikes will face affordability resistance.
Forward outlook
- Local home prices are declining (-3.0%/yr); year-one equity from $166 of loan paydown is wiped out by about $720 of value loss. Plan a longer hold.
- Pinellas County population projected at +14% by 2050 — modest demand growth; plan on rents tracking national, not racing it.
- At projected returns (-3.0% appreciation + 0.0% rent growth), your $7k cash investment doubles in ~1 year — after that, you're playing with house money.
Negotiation context
- Only 9 days on market — expect competitive offers; lowballing is unlikely to land.
- 2 sale attempts since 11y ago with the ask held roughly flat each time — persistent listings suggest the price (not the market) is what's stuck; bring a comps-based counter.
Risks & watch-outs
- Climate carrying-cost: extreme-heat days projected 7→28/yr by 2055 (HVAC capex compounding) — expect insurance premiums to compound above CPI over the hold.
Questions for the listing agent
- Is there a deadline driving the sale (1031 exchange, divorce, estate, relocation)? That informs how much negotiation room exists.
- The area grade is low — what's the realistic commute time and amenity access for the typical tenant pool here? Any planned neighborhood developments (good or bad) we should know about?
- What's the average days-on-market for RENTAL listings here right now (not sales)? A rising rental-DOM trend means longer vacancies and softer asking-rent achievability than the comps imply.
- What's the recent tenant-quality profile in this submarket — average credit score on applications, eviction rate, late-payment / NSF rate, and stable-employment percentage? A property-management company in the area should have these aggregated.
- How much new for-sale + rental construction is in the pipeline within 1–3 miles? Heavy new supply typically softens prices + rents 12–24 months out; constrained supply supports both.
Investment metrics
- 1% rule
- 7.41% ✓
- Cap rate
- 68.25%
- Cash-on-cash
- 221.28%
- DSCR
- 10.85
- GRM
- 1.1
CMA / ARV
No comps found within radius.
Projected returns pro-forma
-3.0% appreciation · 0.0% rent growth · sell at horizon
- IRR
- —
- Equity multiple
- 11.39×
- Total profit
- $69,849
- Equity at exit
- $3,578
- IRR
- —
- Equity multiple
- 22.19×
- Total profit
- $142,415
- Equity at exit
- $2,075
Cash invested: $6,720 (down + closing). Projections, not guarantees.
Landlord ↔ Tenant lean methodology
- Overall (STATE)
- 87 Strongly Landlord-Friendly
- State Florida
- 87 Strongly Landlord-Friendly · R+3
- County
- — inherits STATE
- City
- — inherits STATE
ZIP-level market 33765
- Home prices YoY
- -31.8%
- Rents YoY
- -4.6%
- Active inventory
- 83
- Price-to-rent
- 1.1×
Monthly cashflow live
- Estimated rent
- $1,779 high interval (Pro) →
- Mortgage (P&I)
- −$126
- Tax est. 1.5%
- −$30 /mo · $360/yr
- Insurance
- −$10
- HOA
- −$0
- Vacancy / Maint / Mgmt
- −$373
- Net cashflow
- $1,239
Break-even live
UW: 25.0% down · 7.5% · 30yr · 1.5% tax · 5.0% vac · 8.0% maint · 8.0% mgmt
Financing live
Cash to close
- Down payment
- $6,000
- Closing costs
- $720
- Reserves months
- —
- Total cash needed
- —
Loan-product check · same deal, 3 products live
Conventional
25% down · 7.5% · 30yr
- Down + closing
- —
- Monthly P&I
- —
- Monthly cashflow
- —
- DSCR
- —
- Eligible?
- —
Personal DTI + credit; lowest rate.
DSCR
20% down · 8.5% · 30yr
- Down + closing
- —
- Monthly P&I
- —
- Monthly cashflow
- —
- DSCR
- —
- Eligible?
- —
No personal income docs; deal must DSCR.
Hard money
10% down · 12.0% · 12mo
- Down + closing
- —
- Monthly P&I
- —
- Monthly cashflow
- —
- DSCR
- —
- Eligible?
- —
Short-term bridge; refi at stabilization.
Rent comps 39 comps
| Address | Beds | Baths | Sqft | Rent | $/sqft | DOM | Units | Dist |
|---|---|---|---|---|---|---|---|---|
| 101 S Old Coachman Rd Clearwater, FL | 3.0 | 1.0–2.0 | 983 | $1,927 | $1.96 | 3d | 16 | 0.17mi |
| 2600 W Grand Reserve Cir Clearwater, FL | 1.0–3.0 | 1.0–2.0 | 1097 | $1,730 | $1.58 | 1d | 36 | 0.33mi |
| 2690 Drew St Clearwater, FL | 1.0–3.0 | 1.0–2.0 | 974 | $1,225 | $1.26 | 1d | 12 | 0.44mi |
| 530 Fairwood Ave Clearwater, FL | 2.0–3.0 | 1.0–2.0 | 1042 | $1,309 | $1.26 | 2d | 27 | 0.53mi |
| 2381 Chaucer St Clearwater, FL | 2.0 | 1.0 | 1000 | $1,950 | $1.95 | 1d | 1 | 0.57mi |
| 2348 Shelley St #9 Clearwater, FL | 2.0 | 1.0 | 950 | $2,200 | $2.32 | 24d | 1 | 0.63mi |
| 1001 Pearce Dr #302 Clearwater, FL | 1.0 | 1.5 | 1048 | $1,750 | $1.67 | 4d | 1 | 0.66mi |
| 1012 Pearce Dr #304 Clearwater, FL | 2.0 | 2.0 | 1200 | $2,049 | $1.71 | 4d | 1 | 0.68mi |
| 730 N Old Coachman Rd Clearwater, FL | 2.0 | 2.0 | 950 | $1,705 | $1.79 | 2d | 3 | 0.69mi |
| 776 Fairwood Ln Clearwater, FL | 2.0 | 1.5 | 1305 | $1,949 | $1.49 | 10d | 1 | 0.69mi |
| 2699 Seville Blvd #802 Clearwater, FL | 2.0 | 2.0 | 1545 | $2,300 | $1.49 | 24d | 1 | 0.72mi |
| 2650 Pearce Dr Clearwater, FL | 2.0 | 2.0 | 1175 | $1,850 | $1.57 | 24d | 2 | 0.75mi |
| 2650 Pearce Dr #111 Clearwater, FL | 2.0 | 2.0 | 1200 | $2,000 | $1.67 | 14d | 1 | 0.76mi |
| 2346 Druid Rd #1106 Clearwater, FL | 2.0 | 2.0 | 1008 | $1,495 | $1.48 | 16d | 1 | 0.80mi |
| 2729 Seville Blvd Clearwater, FL | 1.0–3.0 | 1.0–2.0 | 1057 | $1,695 | $1.60 | 1d | 33 | 0.80mi |
| 2403 Brigadoon Dr Clearwater, FL | 2.0 | 2.5 | 1088 | $3,100 | $2.85 | 4d | 1 | 0.91mi |
| 1602 Brigadoon Dr Clearwater, FL | 2.0 | 1.5 | 896 | $1,800 | $2.01 | 4d | 1 | 0.91mi |
| 25 N Belcher Rd Clearwater, FL | 1.0–2.0 | 1.0–2.0 | 780 | $1,503 | $1.93 | 2d | 12 | 0.92mi |
| 2909 Gulf To Bay Blvd Clearwater, FL | 1.0–2.0 | 1.0–2.0 | 931 | $1,279 | $1.37 | 3d | 9 | 0.94mi |
| 2973 Gulf to Bay Blvd Unit 2 Clearwater, FL | 2.0 | 2.0 | 1064 | $3,219 | $3.03 | 24d | 1 | 1.01mi |
| 2975 Gulf To Bay Blvd Clearwater, FL | 2.0 | 1.0–2.0 | 874 | $3,691 | $4.22 | 4d | 49 | 1.02mi |
| 2981 Gulf To Bay Blvd Clearwater, FL | 1.0–3.0 | 1.0–2.0 | 1198 | $2,184 | $1.82 | 3d | 27 | 1.08mi |
| 19355 US Highway 19 N Clearwater, FL | 1.0–3.0 | 1.0–2.0 | 1093 | $2,059 | $1.88 | 3d | 13 | 1.13mi |
| 2168 Druid Rd E Clearwater, FL | 1.0–3.0 | 1.0–2.0 | 1049 | $2,093 | $2.00 | 3d | 20 | 1.17mi |
| 1330 Moreland Dr Clearwater, FL | 2.0 | 2.0 | 1192 | $2,125 | $1.78 | 24d | 3 | 1.17mi |
| 19135 US Highway 19 N Clearwater, FL | 1.0–4.0 | 1.0–2.5 | 1139 | $1,278 | $1.12 | 1d | 30 | 1.22mi |
| 2525 Harn Blvd #3 Clearwater, FL | 2.0 | 2.5 | 1252 | $1,899 | $1.52 | 24d | 1 | 1.27mi |
| 383 S McMullen Booth Rd #68 Clearwater, FL | 2.0 | 1.0 | 1087 | $1,950 | $1.79 | 4d | 1 | 1.32mi |
| 389 S McMullen Booth Rd #12 Clearwater, FL | 2.0 | 1.0 | 968 | $1,395 | $1.44 | 24d | 1 | 1.32mi |
| 19029 US Highway 19 N Unit 6-10 Clearwater, FL | 1.0 | 1.0 | 875 | $1,300 | $1.49 | 4d | 1 | 1.32mi |
| 205 S McMullen Booth Rd #203 Clearwater, FL | 2.0 | 1.0 | 1087 | $999 | $0.92 | 14d | 1 | 1.33mi |
| 1403 Arrowhead Cir W Unit 13E Clearwater, FL | 2.0 | 2.0 | 886 | $1,750 | $1.98 | 24d | 1 | 1.34mi |
| 343 S McMullen Booth Rd #151 Clearwater, FL | 1.0 | 1.0 | 900 | $1,800 | $2.00 | 24d | 1 | 1.35mi |
| 2066 Druid Park Dr N Clearwater, FL | 2.0 | 2.0 | 1248 | $3,095 | $2.48 | 23d | 1 | 1.35mi |
| 19029 U.S. 19 Unit 1-19 Clearwater, FL | 1.0 | 1.5 | 950 | $2,000 | $2.11 | 21d | 1 | 1.37mi |
| 19029 U.S. 19 Unit 7-8 Clearwater, FL | 2.0 | 2.0 | 1060 | $2,200 | $2.08 | 17d | 1 | 1.37mi |
| 2236 Morningside Dr Clearwater, FL | 2.0 | 1.5 | 902 | $2,200 | $2.44 | 3d | 1 | 1.38mi |
| 2025 Rogers St Clearwater, FL | 1.0–3.0 | 1.0–2.0 | 985 | $1,549 | $1.57 | 10d | 10 | 1.43mi |
| 2550 Stag Run Blvd Clearwater, FL | 1.0–3.0 | 1.0–2.0 | 1189 | $1,455 | $1.22 | 1d | 19 | 1.48mi |
Listing history 6 events
-
2026-06-18days on market $24,000 Active 9 DOM
-
2026-06-17days on market $24,000 Active 8 DOM
-
2026-06-16days on market $24,000 Active 7 DOM
-
2026-06-15days on market $24,000 Active 6 DOM
-
2026-06-13remarks 691-char remark
-
2026-06-13$24,000 Active 4 DOM
ⓘ Source: listings_history table (triggers on properties + properties_extension) + one-shot
backfill from property_details.listing_events for pre-trigger history.
Climate risk First Street
- Flood 1/10 Low FEMA zone X · 0% chance over 30 yrs
- Wildfire 1/10 Low
- Heat 10/10 Extreme
- Air quality 3/10 Moderate 3 unhealthy d/yr today · 3 by 30 yrs out
Nearby sold comps map
Loading sold comps map…
Walkable amenities ~0.75 mi
Loading nearby amenities…
Taxation est. · year 1
- Rental income
- $21,342
- − Mortgage interest
- −$1,344
- − Property taxes
- −$360
- − Insurance
- −$120
- − Repairs & maintenance
- −$1,707
- − Management
- −$1,707
- − Depreciation
- −$698
- Taxable income
- $15,405
- Est. tax owed @ 24.0%
- −$3,697
- After-tax cash flow
- $11,173/yr
For passive investors: Depreciation is non-cash, so a rental often shows a tax loss while cash-flowing — sheltering income. Rental losses are passive: they offset passive income freely, and up to $25,000/yr can offset ordinary (W-2) income if you actively participate and your MAGI is under $100k (phasing out to $0 by $150k); unused losses carry forward. On sale, claimed depreciation is recaptured at up to 25%, and gains may owe capital-gains tax (a 1031 exchange can defer both). Figures are a year-1 estimate at your 24.0% rate — not tax advice; consult a CPA.
Schools (NCES district)
- District
- Pinellas
- NCES district ID
- 1201560
- Math proficiency
- 51% ▼ -5.00%
- Reading proficiency
- 51% ▼ -3.00%
- Median HH income
- $46,270
- Composite
- 43.27/100
- National rank
- #3046
- State rank
- #31 of 73 in FL
Livability — Clearwater
- Score
- 82/100
- State rank
- #60
- US rank
- #988
Category grades
Schools grade is shown separately in the Schools card above.
Census & demographics
- Census place
- Clearwater, FL
- County
- Pinellas County · 939,478 people
- City population
- 170,933
- Metro
- Tampa-St. Petersburg-Clearwater, FL
- Population (ZIP)
- 13,808
- Household income
- $69,199
- Rent vs Own
- Severe rent burden
- 604.0
Population outlook (Pinellas County) Hauer SSP2
- Today (2025)
- 1,027,532 people
- By 2030
- 1,063,586 · +3.5%
- By 2040
- 1,125,020 · +9.5%
- By 2050
- 1,168,637 · +13.7%
- By 2075
- 1,265,188 · +23.1%
- By 2100
- 1,260,357 · +22.7%
Race, ethnicity, and origin ACS 2023
- Neighborhood character
- Diverse neighborhood (Simpson 0.55)
- Race & ethnicity
- White 63% Hispanic / Latino 19% Two or more races 13% Black 8% Asian 7%
- Hispanic origin (detail)
- Mexican 7% Puerto Rican 4% Cuban 1%
- Common ancestry
- Romanian 3% Slovak 2% Italian 2%
- Foreign-born
- 22% · Canada, Jamaica, Vietnam
- Languages at home
- 71% English-only · Spanish 17% Other Indo-European 6% Vietnamese 2%
Political lean MEDSL · Pinellas
- 2024 margin
- Lean R (+5.2) · D 46.9% · R 52.1%
- 2008→2024 swing
- -13.5pp toward R · 2008: 8.3pp · 2024: -5.2pp
- All cycles
- 2024: R+5.2 2020: D+0.2 2016: R+1.1 2012: D+5.6 2008: D+8.3
Not yet ingested
- Civics
- —
Market trends
- HPI YoY
- ▼ -146.56%
- Current HPI
- 314.4864
- Rent YoY
- ▼ -4.61%
- Metro
- Tampa-St. Petersburg-Clearwater, FL
- State GDP YoY
- ▲ 3.28%
- F500 in state
- 36
Industry mix (Fortune 500 HQ in FL)
| Industry | F500 HQs | Revenue |
|---|---|---|
| Industrial Technology | 2 | $29B |
|
||
| Insurance | 2 | $17B |
|
||
| Retail | 1 | $60B |
|
||
| Technology Distribution | 1 | $58B |
|
||
| Homebuilding | 1 | $35B |
|
||
| Technology Manufacturing | 1 | $35B |
|
||
Price history
-94.0% since first listed4 events — show timeline
- 2026-06-10 Listed $24,000 FSBO.com
- 2016-02-22 Listing Removed — Stellar MLS as Distributed by MLS Grid
- 2015-12-21 Price Changed $375,000 Stellar MLS as Distributed by MLS Grid
- 2015-12-07 Listed $400,000 Stellar MLS as Distributed by MLS Grid
Cash-flow waterfall
monthlySold comps — $/sqft
last 12 mo · ≤1 miLoading sold comps…