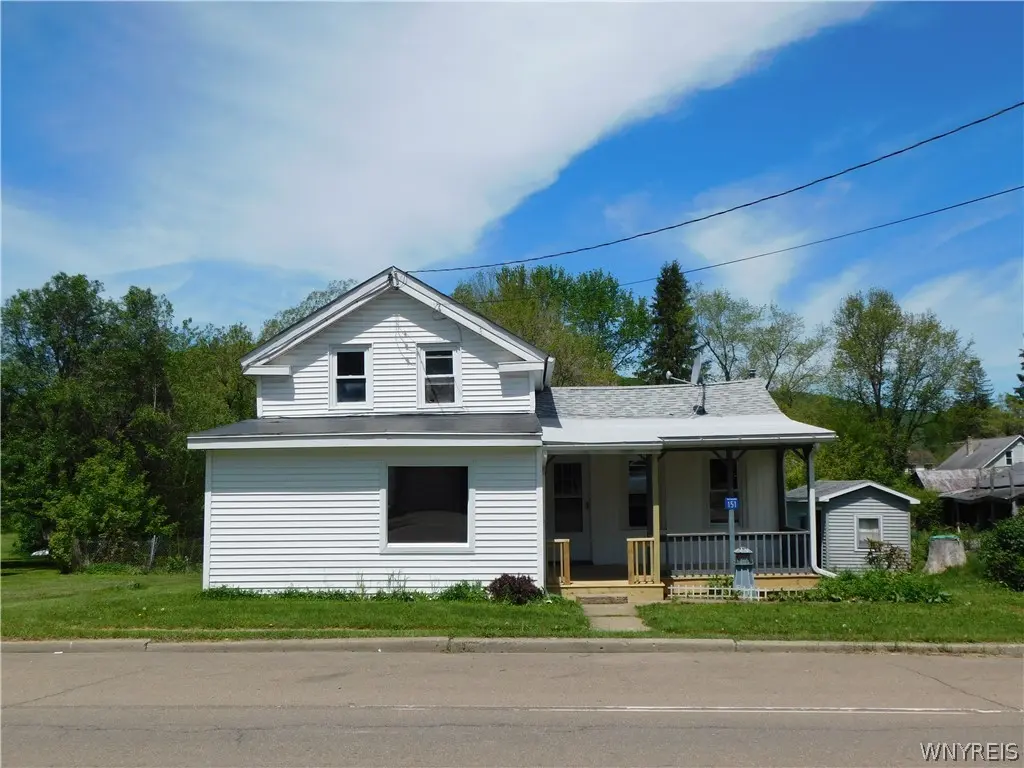
151 Main St · Richburg, NY
Flood risk 6/10 · Moderate
- FEMA flood zone
- X (shaded)
- Chance of flooding over 30 yrs
- 0.73%
- Est. flood insurance / yr
- $473 – $860
Fire risk 3/10 · Minor
- Est. fire insurance / yr
- $691 – $1,283
Heat risk 2/10 · Minimal
- Hot days now (above 89°F)
- 8 days/yr
- Hot days in 30 yrs
- 19 days/yr
Wind risk 1/10 · Minimal
- Chance of severe wind over 30 yrs
- —
Air-quality risk 1/10 · Minimal
- Unhealthy air days now
- 0 days/yr
- Unhealthy air days in 30 yrs
- 0 days/yr
Risk factors via First Street. Map © Google.
Why this score? — see what drove the A- grade
The composite is a weighted blend of 9 inputs, each scored 0–100. Each bar is that input's sub-score; the figure is the points it added to the 100-point composite (weight × sub-score).
- Cash flow +30.0/30.0
- ARV discount +15.0/15.0
- 1% rule +10.0/10.0
- DSCR +10.0/10.0
- Appreciation +5.0/10.0
- Schools +4.2/10.0
- Livability +3.0/5.0
- Rent growth +2.5/5.0
- Condition / age +2.5/5.0
$69,900
🖨 Deal sheet 📄 Offer letter ✓ Due diligence
Listing remarks
Cute as a button, just needs your finishing touches! This has been a well maintained rental property for over 18 years. Built 1890 could be one of the oldest structures in Richburg, NY. Most recent home improvements include newer asphalt shingled roof, newly built front porch, new picture window in front new lower hickory kitchen cabinetry, stainless steel sink and faucet, countertops and flooring. Home shows its age with original 12 foot wide plank floors in some rooms. The front room could make a nice size bedroom with separate entry from the front porch. (Once was a beauty salon). Two nice size bedrooms rooms upstairs. Basement has gravel floor and rear entry small enclosed porch for yo
Key facts
- New picture window
- 16x8 shed
- Small enclosed porch
Tags
Property features AI
Exterior
- Parking: No garage
- Utilities: Public water connected; Septic tank sewer; Circuit breaker electrical
- Home design: Single-story property; Resale condition
- Construction: Vinyl siding; Poured and stone foundation; Multiple roof materials: architectural shingles, metal, rubber/membrane
- Exterior features: Covered porch; Gravel driveway; Shed(s) / storage
Interior
- Kitchen: Gas oven; Gas range; Refrigerator
- Bedrooms: Rooms total: 8 (includes a convertible bedroom)
- Flooring: Carpet; Vinyl; Varied flooring
- Bathrooms: 1 full bathroom (main level)
- Heating & cooling: Gas forced-air heating
- Interior features: Country kitchen; Convertible bedroom; Full basement with sump pump
- Laundry & utility: Main-level laundry
Neighborhood map
What this means for you Summary
Snapshot
- This is a 2-bed/1.0-bath single-family listed at $70k.
Deal economics
- At list price, monthly cash flow is $309 ($4k/yr) — positive.
- The deal already cash-flows at list — no discount required.
- Meets the 1% rule at list price ($1k rent vs $70k).
Location & tenants
- Location reads 60/100 on livability (#994 in NY) — a middle-class / working-renter tenant base. Strengths: cost of living A+, housing A+; Watch: employment D+, health & safety D, schools D-.
- Bolivar-Richburg Central School District (rural): math 50% / reading 51% proficiency, ranked #395 of 590 in NY (top 67%) — acceptable for families but not a draw, mixed tenant base, ~2y average lease.
- Market conditions: 1 active listings in the ZIP; 87 units permitted in Allegany County in 2024 (0 in 5+ unit buildings).
Forward outlook
- In year one you build about $3k of equity ($483 loan paydown + $2k appreciation (3.0% local appreciation)).
- Allegany County population projected at -26% by 2050 — secular population decline; favor cash flow + early exit over multi-decade hold.
- At projected returns (3.0% appreciation + 3.0% rent growth), your $20k cash investment doubles in ~3 years — after that, you're playing with house money.
Negotiation context
- Only 5 days on market — expect competitive offers; lowballing is unlikely to land.
Risks & watch-outs
- Watch-outs: property tax is 3.1% of price; built in 1890 — expect roof / HVAC / electrical / plumbing capex.
- Climate carrying-cost: major flood risk — expect insurance premiums to compound above CPI over the hold.
Questions for the listing agent
- Built in 1890 — when were the roof, HVAC, electrical panel, plumbing, and water heater last replaced?
- Property tax is high relative to price — has the assessment been appealed recently, and will the sale trigger a re-assessment?
- Is there a deadline driving the sale (1031 exchange, divorce, estate, relocation)? That informs how much negotiation room exists.
- Schools are D-rated, which usually means shorter tenancies and higher turnover. Who's the typical renter profile here, and what's been the actual vacancy rate?
- Crime grade is F in this area — have there been break-ins, vandalism, or insurance claims at this property in the last 3 years? What carrier currently insures it and at what premium?
- What's the average days-on-market for RENTAL listings here right now (not sales)? A rising rental-DOM trend means longer vacancies and softer asking-rent achievability than the comps imply.
- What's the recent tenant-quality profile in this submarket — average credit score on applications, eviction rate, late-payment / NSF rate, and stable-employment percentage? A property-management company in the area should have these aggregated.
- How much new for-sale + rental construction is in the pipeline within 1–3 miles? Heavy new supply typically softens prices + rents 12–24 months out; constrained supply supports both.
Investment metrics
- 1% rule
- 1.60% ✓
- Cap rate
- 11.60%
- Cash-on-cash
- 18.96%
- DSCR
- 1.84
- GRM
- 5.2
CMA / ARV
- ARV (on-the-fly)
- $137,608
- Comps found
- 2
Show comp detail 2 sales within ~0.75 mi
| Address | Dist | Beds/Ba | Sqft | Sold | Price | $/sf | Match |
|---|---|---|---|---|---|---|---|
| 178 Evans St | 0.15mi | 3/2.0 (+1) | 1,400 (+5%) | 12mo | $144,000 | $103 | 66 |
| 20 N Main St | 0.71mi | 3/1.0 (+1) | 1,292 (-3%) | 8mo | $40,000 | $31 | 50 |
Match score weights: distance 35% · size 25% · config 20% · recency 20%. Top-matched comps best support the ARV.
Projected returns pro-forma
3.0% appreciation · 3.0% rent growth · sell at horizon
- IRR
- 25.4%
- Equity multiple
- 2.44×
- Total profit
- $28,189
- Equity at exit
- $31,430
- IRR
- 26.1%
- Equity multiple
- 4.72×
- Total profit
- $72,861
- Equity at exit
- $48,437
Cash invested: $19,572 (down + closing). Projections, not guarantees.
Landlord ↔ Tenant lean methodology
- Overall (STATE)
- 15 Strongly Tenant-Friendly
- State New York
- 15 Strongly Tenant-Friendly · D+10
- County
- — inherits STATE
- City
- — inherits STATE
ZIP-level market 14774
- Active inventory
- 1
- Price-to-rent
- 5.2×
Monthly cashflow live
- Estimated rent
- $1,121 medium interval (Pro) →
- Mortgage (P&I)
- −$367
- Tax from tax record
- −$180 /mo · $2,165/yr
- Insurance
- −$29
- HOA
- −$0
- Vacancy / Maint / Mgmt
- −$235
- Net cashflow
- $309
Break-even live
UW: 25.0% down · 7.5% · 30yr · 1.5% tax · 5.0% vac · 8.0% maint · 8.0% mgmt
Financing live
Cash to close
- Down payment
- $17,475
- Closing costs
- $2,097
- Reserves months
- —
- Total cash needed
- —
Loan-product check · same deal, 3 products live
Conventional
25% down · 7.5% · 30yr
- Down + closing
- —
- Monthly P&I
- —
- Monthly cashflow
- —
- DSCR
- —
- Eligible?
- —
Personal DTI + credit; lowest rate.
DSCR
20% down · 8.5% · 30yr
- Down + closing
- —
- Monthly P&I
- —
- Monthly cashflow
- —
- DSCR
- —
- Eligible?
- —
No personal income docs; deal must DSCR.
Hard money
10% down · 12.0% · 12mo
- Down + closing
- —
- Monthly P&I
- —
- Monthly cashflow
- —
- DSCR
- —
- Eligible?
- —
Short-term bridge; refi at stabilization.
Listing history 4 events
-
2026-06-01status $69,900 Pending 5 DOM
-
2026-06-01days on market $69,900 Active 5 DOM
-
2026-05-31days on market $69,900 Active 4 DOM
-
2026-05-27$69,900 Active
ⓘ Source: listings_history table (triggers on properties + properties_extension) + one-shot
backfill from property_details.listing_events for pre-trigger history.
Tax reassessment forecast NY · Partial reset (capped growth)
- Current annual tax
- $2,165 · $180/mo
- Projected year-2 tax
- $2,165 · $180/mo
- Expected delta
- $0/yr ($0/mo · 0.0%)
ⓘ Screening estimate from a state-policy table — verify with the county assessor before closing.
Climate risk First Street
- Flood 6/10 Major FEMA zone X (shaded) · 73% chance over 30 yrs
- Wildfire 3/10 Moderate
- Heat 2/10 Low 8 d/yr ≥89°F today · 19 d/yr by 30 yrs out
- Wind 1/10 Low
- Air quality 1/10 Low 0 unhealthy d/yr today · 0 by 30 yrs out
Nearby sold comps map
Loading sold comps map…
Walkable amenities ~0.75 mi
Loading nearby amenities…
Taxation est. · year 1
- Rental income
- $13,448
- − Mortgage interest
- −$3,915
- − Property taxes
- −$2,165
- − Insurance
- −$350
- − Repairs & maintenance
- −$1,076
- − Management
- −$1,076
- − Depreciation
- −$2,033
- Taxable income
- $2,833
- Est. tax owed @ 24.0%
- −$680
- After-tax cash flow
- $3,031/yr
For passive investors: Depreciation is non-cash, so a rental often shows a tax loss while cash-flowing — sheltering income. Rental losses are passive: they offset passive income freely, and up to $25,000/yr can offset ordinary (W-2) income if you actively participate and your MAGI is under $100k (phasing out to $0 by $150k); unused losses carry forward. On sale, claimed depreciation is recaptured at up to 25%, and gains may owe capital-gains tax (a 1031 exchange can defer both). Figures are a year-1 estimate at your 24.0% rate — not tax advice; consult a CPA.
Schools (NCES district)
- District
- Bolivar-Richburg Central School District
- NCES district ID
- 3600012
- Math proficiency
- 50% ▲ 9.00%
- Reading proficiency
- 51% ▲ 8.00%
- Median HH income
- $40,153
- Composite
- 42.26/100
- National rank
- #3277
- State rank
- #395 of 590 in NY
Livability — Richburg
- Score
- 60/100
- State rank
- #994
- US rank
- #19418
Category grades
Schools grade is shown separately in the Schools card above.
Census & demographics
- Census place
- Richburg, NY
- City population
- 322
- Population (ZIP)
- 322
Population outlook (Allegany County) Hauer SSP2
- Today (2025)
- 45,362 people
- By 2030
- 43,078 · -5.0%
- By 2040
- 38,031 · -16.2%
- By 2050
- 33,634 · -25.9%
- By 2075
- 25,285 · -44.3%
- By 2100
- 18,902 · -58.3%
Race, ethnicity, and origin ACS 2023
- Neighborhood character
- Predominantly White (88%)
- Race & ethnicity
- White 88% Two or more races 12% Hispanic / Latino 7%
- Hispanic origin (detail)
- Puerto Rican 7%
- Common ancestry
- Polish 6% Lithuanian 3% Iranian 1%
- Languages at home
- 92% English-only · Spanish 8%
Political lean MEDSL · Allegany
- 2024 margin
- Solid R (+43.2) · D 28.4% · R 71.6%
- 2008→2024 swing
- -21.5pp toward R · 2008: -21.7pp · 2024: -43.2pp
- All cycles
- 2024: R+43.2 2020: R+38.9 2016: R+42.3 2012: R+25.3 2008: R+21.7
Not yet ingested
- Civics
- —
Market trends
- HPI YoY
- —
- Current HPI
- —
- Rent YoY
- —
- Metro
- —
- State GDP YoY
- ▲ 2.60%
- F500 in state
- 92
Industry mix (Fortune 500 HQ in NY)
| Industry | F500 HQs | Revenue |
|---|---|---|
| Financial Services | 10 | $950B |
|
||
| Consumer Goods | 9 | $162B |
|
||
| Insurance | 4 | $225B |
|
||
| Telecommunications | 2 | $144B |
|
||
| Pharmaceuticals | 2 | $112B |
|
||
| Media / Entertainment | 2 | $69B |
|
||
Price history
1 event — show timeline
- 2026-05-27 Listed $69,900 WNYREIS
Property tax history
+0.1%/yrLatest (2025): $2,165 · +2.8% YoY. Source: county tax records.
Cash-flow waterfall
monthlySold comps — $/sqft
last 12 mo · ≤1 miLoading sold comps…