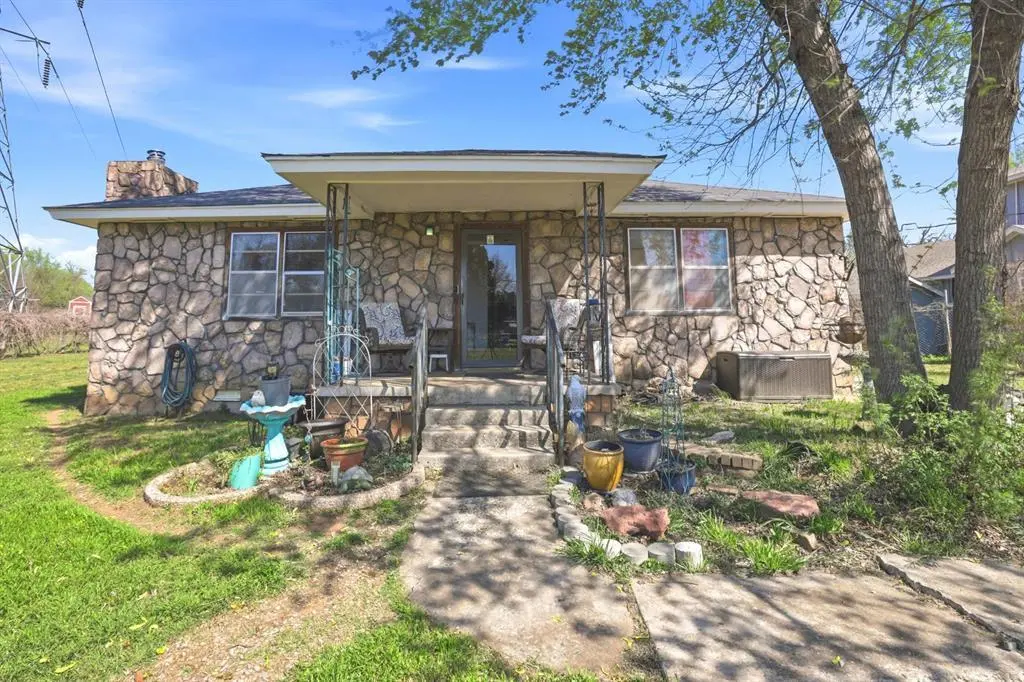
2100 N Midwest Blvd · Midwest City, OK
Flood risk 1/10 · Minimal
- FEMA flood zone
- X (unshaded)
- Chance of flooding over 30 yrs
- 0.0%
- Est. flood insurance / yr
- $507 – $1,088
Fire risk 3/10 · Minor
- Est. fire insurance / yr
- $2,463 – $4,575
Heat risk 5/10 · Moderate
- Hot days now (above 107°F)
- 7 days/yr
- Hot days in 30 yrs
- 18 days/yr
Wind risk 2/10 · Minimal
- Chance of severe wind over 30 yrs
- 4.0%
Air-quality risk 2/10 · Minimal
- Unhealthy air days now
- 1 days/yr
- Unhealthy air days in 30 yrs
- 2 days/yr
Risk factors via First Street. Map © Google.
Why this score? — see what drove the F grade
The composite is a weighted blend of 9 inputs, each scored 0–100. Each bar is that input's sub-score; the figure is the points it added to the 100-point composite (weight × sub-score).
- Cash flow +11.0/30.0
- Appreciation +6.1/10.0
- Livability +3.6/5.0
- DSCR +3.2/10.0
- Rent growth +2.5/5.0
- Condition / age +2.5/5.0
- 1% rule +2.4/10.0
- ARV discount +1.4/15.0
- Schools +0.7/10.0
$165,000
🖨 Deal sheet (PDF) 📄 Offer letter ✓ Due diligence
Listing remarks MLS
Great investment property! 1 acre more or less, 3 bedroom 1 bath with fireplace. Well water but has Midwest City sewer & trash pickup. Owner started repairs and some renovation but could not complete it. Central Heat & Air quit working and was removed.
Key facts
- 3 phase electric
- Central heat and air
- Original fireplace
Tags
Property features AI
Finance
- Other: Infill lot; Lot size approximately 0.93 acres; No storm shelter; Property listed as existing; Occupied
- Financial info: Financing options: Cash, Conventional, FHA or VA; Loan qualification possible
- HOA & community: No mandatory association dues
Exterior
- Parking: Detached 2-car garage
- Utilities: Electricity available; Natural gas available; Public utilities; Private well available; Storm doors
- Home design: Single-family residence; One-level layout; Residential property
- Construction: Stone construction; Composition roof (replaced/installed 2019); Conventional foundation
- Exterior features: Covered porch; Open deck; Fire pit; Outbuildings with storage and workshop
Interior
- Kitchen: Free-standing gas range; Built-in gas oven; Microwave
- Bedrooms: 3 bedrooms
- Flooring: Vinyl flooring; Wood flooring
- Bathrooms: 1 full bathroom
- Interior features: Ceiling fans
- Laundry & utility: Inside utility; Water heater
Neighborhood map
What this means for you Summary
Snapshot
- This is a 3-bed/1.0-bath single-family listed at $165k.
Deal economics
- At list price, monthly cash flow is $-68 ($-819/yr) — negative.
- To cash-flow at today's rent, offer at most $153k (7.3% below list).
- To meet the 1% rule (rent ≥ 1% of price), the offer needs to be $122k (26.3% below list).
- Recommended offer: $122k (26.3% below list) — sets the bar for 1% rule.
Location & tenants
- Location reads 71/100 on livability (#30 in OK) — a middle-class / working-renter tenant base. Strengths: cost of living A+, housing A+, health & safety A; Watch: crime D+, employment D, amenities F.
- Oklahoma City (urban): math 7% / reading 10% proficiency, ranked #254 of 270 in OK (top 94%) — low school quality limits family demand, transient renter base, plan for 1-2y turnover; 82% free/reduced lunch — lower-income household profile, screen leases tightly.
- Zoned schools: Willow Brook Es (346 students, 0% FRL); Star Spencer Hs (math 5% / reading 5%, grade F, #430 of 447 statewide, top 99%, 378 students, 0% FRL) — zoned schools average 0% FRL vs 82% district-wide (82 pts lower); this property's tenant base skews higher-income than the district average.
- Market conditions: 26 active listings in the ZIP; 40 comparable units currently listed for rent nearby; rentals at typical pace (median 15d on market — plan ~3-4 weeks tenant-placement turnaround); 5,365 units permitted in Oklahoma County in 2024 (569 in 5+ unit buildings).
Forward outlook
- In year one you build about $5k of equity ($1k loan paydown + $4k appreciation (2.2% local appreciation)).
- Oklahoma County population projected at +41% by 2050 — long-run rental-demand tailwind backs the buy-and-hold thesis.
- At projected returns (2.2% appreciation + 3.0% rent growth), your $46k cash investment doubles in ~9 years — after that, you're playing with house money.
- By year 7, paydown + projected appreciation supports a ~$30k cash-out refi (75% LTV) — recoverable capital for the next deal without selling this one.
Negotiation context
- It's been on market 25 days — a 2% lower offer ($163k) is reasonable based on typical stale-listing flexibility.
- 5 sale attempts since 23y ago with the ask held roughly flat each time — persistent listings suggest the price (not the market) is what's stuck; bring a comps-based counter.
- Current owner paid $35k; list at $165k implies a 371% gain — meaningful room to come down on a strong offer.
Risks & watch-outs
- Watch-outs: built in 1959 — expect roof / HVAC / electrical / plumbing capex.
- Climate carrying-cost: extreme-heat days projected 7→18/yr by 2055 (HVAC capex compounding) — expect insurance premiums to compound above CPI over the hold.
Questions for the listing agent
- What do current leases actually rent for vs. the listed asking? Can we see a recent rent roll and the last 12 months of T-12 income?
- Built in 1959 — when were the roof, HVAC, electrical panel, plumbing, and water heater last replaced?
- Is there a deadline driving the sale (1031 exchange, divorce, estate, relocation)? That informs how much negotiation room exists.
- Schools are D-rated, which usually means shorter tenancies and higher turnover. Who's the typical renter profile here, and what's been the actual vacancy rate?
- Crime grade is D in this area — have there been break-ins, vandalism, or insurance claims at this property in the last 3 years? What carrier currently insures it and at what premium?
- The area grade is low — what's the realistic commute time and amenity access for the typical tenant pool here? Any planned neighborhood developments (good or bad) we should know about?
- What's the average days-on-market for RENTAL listings here right now (not sales)? A rising rental-DOM trend means longer vacancies and softer asking-rent achievability than the comps imply.
- What's the recent tenant-quality profile in this submarket — average credit score on applications, eviction rate, late-payment / NSF rate, and stable-employment percentage? A property-management company in the area should have these aggregated.
- How much new for-sale + rental construction is in the pipeline within 1–3 miles? Heavy new supply typically softens prices + rents 12–24 months out; constrained supply supports both.
Investment metrics
- 1% rule
- 0.74% ✗
- Cap rate
- 5.80%
- Cash-on-cash
- -1.77%
- DSCR
- 0.92
- GRM
- 11.3
CMA / ARV
- ARV (on-the-fly)
- $145,288
- Comps found
- 12
Show comp detail 12 sales within ~0.75 mi
| Address | Dist | Beds/Ba | Sqft | Sold | Price | $/sf | Match |
|---|---|---|---|---|---|---|---|
| 4605 NE Meadowvale Dr | 0.46mi | 3/1.5 | 1,077 (+6%) | 2mo | $150,000 | $139 | 65 |
| 7845 NE 18th St | 0.19mi | 3/1.0 | 912 (-10%) | 14mo | $130,000 | $143 | 63 |
| 921 Meadowgreen Dr | 0.52mi | 3/2.0 | 1,045 (+3%) | 6mo | $155,000 | $148 | 62 |
| 102 Cambridge Dr | 0.62mi | 3/2.0 | 1,048 (+3%) | 15mo | $145,500 | $139 | 50 |
| 4316 Meadowpark Dr | 0.69mi | 3/1.5 | 1,095 (+8%) | 4mo | $163,000 | $149 | 49 |
| 900 Meadowridge Dr | 0.58mi | 3/1.5 | 934 (-8%) | 10mo | $135,000 | $145 | 49 |
| 4609 Meadowpark Dr | 0.54mi | 3/1.5 | 925 (-9%) | 17mo | $129,700 | $140 | 44 |
| 4216 N Shadybrook Dr | 0.63mi | 3/2.0 | 1,112 (+9%) | 12mo | $130,000 | $117 | 40 |
| 213 E Campbell Rd | 0.70mi | 3/1.5 | 1,088 (+7%) | 16mo | $155,000 | $142 | 40 |
| 4312 Bonaparte Blvd | 0.67mi | 3/2.0 | 876 (-14%) | 6mo | $142,500 | $163 | 36 |
| 917 Willow Brook Dr | 0.68mi | 3/1.5 | 1,155 (+14%) | 12mo | $168,000 | $145 | 34 |
| 828 Willow Brook Dr | 0.68mi | 3/1.5 | 1,154 (+14%) | 19mo | $129,000 | $112 | 28 |
Match score weights: distance 35% · size 25% · config 20% · recency 20%. Top-matched comps best support the ARV.
Projected returns pro-forma
2.19% appreciation · 3.0% rent growth · sell at horizon
- IRR
- 3.4%
- Equity multiple
- 1.18×
- Total profit
- $8,481
- Equity at exit
- $66,749
- IRR
- 7.0%
- Equity multiple
- 1.98×
- Total profit
- $45,244
- Equity at exit
- $97,417
Cash invested: $46,200 (down + closing). Projections, not guarantees.
Landlord ↔ Tenant lean methodology
- Overall (STATE)
- 83 Strongly Landlord-Friendly
- State Oklahoma
- 83 Strongly Landlord-Friendly · R+20
- County
- — inherits STATE
- City
- — inherits STATE
ZIP-level market 73141
- Home prices YoY
- 0.7%
- Active inventory
- 26
- Price-to-rent
- 11.3×
Monthly cashflow live
- Estimated rent
- $1,215 high interval (Pro) →
- Mortgage (P&I)
- −$865
- Tax from tax record
- −$94 /mo · $1,133/yr
- Insurance
- −$69
- HOA
- −$0
- Vacancy / Maint / Mgmt
- −$255
- Net cashflow
- $-68
Break-even live
Sensitivity live
| Price | -10% $25 | -5% $-22 | +0% $-68 | +5% $-115 | +10% $-162 |
|---|---|---|---|---|---|
| Rent | -10% $-164 | -5% $-116 | +0% $-68 | +5% $-20 | +10% $28 |
| Rate | -1.0pp $15 | -0.5pp $-26 | base $-68 | +0.5pp $-111 | +1.0pp $-155 |
UW: 25.0% down · 7.5% · 30yr · 1.5% tax · 5.0% vac · 8.0% maint · 8.0% mgmt
Financing live
Cash to close
- Down payment
- $41,250
- Closing costs
- $4,950
- Reserves months
- —
- Total cash needed
- —
Loan-product check · same deal, 3 products live
Conventional
25% down · 7.5% · 30yr
- Down + closing
- —
- Monthly P&I
- —
- Monthly cashflow
- —
- DSCR
- —
- Eligible?
- —
Personal DTI + credit; lowest rate.
DSCR
20% down · 8.5% · 30yr
- Down + closing
- —
- Monthly P&I
- —
- Monthly cashflow
- —
- DSCR
- —
- Eligible?
- —
No personal income docs; deal must DSCR.
Hard money
10% down · 12.0% · 12mo
- Down + closing
- —
- Monthly P&I
- —
- Monthly cashflow
- —
- DSCR
- —
- Eligible?
- —
Short-term bridge; refi at stabilization.
Rent comps 40 comps
| Address | Beds | Baths | Sqft | Rent | $/sqft | DOM | Units | Dist |
|---|---|---|---|---|---|---|---|---|
| 1401 N Midwest Blvd Midwest City, OK | 3.0 | 2.0 | 1087 | $1,000 | $0.92 | 24d | 1 | 0.49mi |
| 1401 N Midwest Blvd Midwest City, OK | 3.0 | 2.0 | 1087 | $1,000 | $0.92 | 20d | 1 | 0.49mi |
| 1401 N Midwest Blvd Midwest City, OK | 1.0–3.0 | 1.0–2.0 | 803 | $1,000 | $1.25 | 12d | 34 | 0.49mi |
| 1401 N Midwest Blvd Midwest City, OK | 3.0 | 2.0 | 1087 | $1,000 | $0.92 | 3d | 1 | 0.49mi |
| 1401 N Midwest Blvd Unit 167 Midwest City, OK | 3.0 | 2.0 | 1087 | $1,000 | $0.92 | 4d | 1 | 0.50mi |
| 1401 N Midwest Blvd Apt 255 Midwest City, OK | 2.0 | 1.0 | 970 | $940 | $0.97 | 20d | 1 | 0.50mi |
| 1401 N Midwest Blvd Unit 112 Midwest City, OK | 2.0 | 1.0 | 970 | $940 | $0.97 | 4d | 1 | 0.50mi |
| 1312 N Midwest Blvd Oklahoma City, OK | 3.0 | 1.5 | 946 | $970 | $1.03 | 3d | 1 | 0.51mi |
| 801 Meadowridge Dr Oklahoma City, OK | 3.0 | 1.5 | 1095 | $1,095 | $1.00 | 44d | 1 | 0.55mi |
| 1632 N Spencer Rd Oklahoma City, OK | 2.0 | 1.0 | 772 | $895 | $1.16 | 15d | 1 | 0.61mi |
| 1008 Willow Brook Dr Oklahoma City, OK | 3.0 | 1.5 | 1045 | $1,125 | $1.08 | 24d | 1 | 0.75mi |
| 212 Cambridge Dr Oklahoma City, OK | 3.0 | 2.0 | 1472 | $1,400 | $0.95 | 24d | 1 | 0.76mi |
| 7801 NE 10th St Oklahoma City, OK | 1.0–3.0 | 1.0–2.5 | 940 | $1,199 | $1.28 | 2d | 23 | 0.80mi |
| 8741 Hillridge Dr Oklahoma City, OK | 3.0 | 2.0 | 1182 | $1,495 | $1.26 | 44d | 1 | 0.80mi |
| 8741 Hillridge Dr Oklahoma City, OK | 3.0 | 2.0 | 1182 | $1,495 | $1.26 | 2d | 1 | 0.80mi |
| 2008 Midridge Dr Oklahoma City, OK | 3.0 | 2.0 | 1232 | $1,325 | $1.08 | 15d | 1 | 0.83mi |
| 2823 Juvene Cir Spencer, OK | 3.0 | 2.0 | 1080 | $1,800 | $1.67 | 3d | 1 | 0.85mi |
| 3807 Bradfred St Unit 3809 Midwest City, OK | 3.0 | 2.0 | 1339 | $1,245 | $0.93 | 2d | 1 | 0.86mi |
| 8511 Justin Pl Oklahoma City, OK | 2.0 | 1.0 | 962 | $950 | $0.99 | 15d | 1 | 0.90mi |
| 208 W Shadywood Dr Oklahoma City, OK | 3.0 | 1.0 | 891 | $1,099 | $1.23 | 24d | 1 | 0.90mi |
| 1020 N Spencer Rd Oklahoma City, OK | 2.0 | 1.0 | 962 | $895 | $0.93 | 24d | 1 | 0.93mi |
| 911 Crabtree Cv Oklahoma City, OK | 4.0 | 1.0 | 1144 | $1,650 | $1.44 | 44d | 1 | 0.93mi |
| 1014 Spencer Rd Oklahoma City, OK | 2.0 | 2.0 | 800 | $1,000 | $1.25 | 44d | 1 | 0.94mi |
| 1619 N Douglas Blvd Oklahoma City, OK | 3.0 | 2.0 | 1152 | $1,129 | $0.98 | 2d | 1 | 0.97mi |
| 4033 S Locust Dr Oklahoma City, OK | 2.0 | 1.0 | 800 | $900 | $1.12 | 24d | 1 | 1.03mi |
| 1250 N Air Depot Blvd Midwest City, OK | 1.0–2.0 | 1.0–2.0 | 692 | $909 | $1.31 | 4d | 1 | 1.16mi |
| 3512 Brookside Dr Oklahoma City, OK | 4.0 | 2.0 | 763 | $1,595 | $2.09 | 2d | 1 | 1.17mi |
| 1617 Cynthia Dr Oklahoma City, OK | 4.0 | 1.0 | 1161 | $1,450 | $1.25 | 44d | 1 | 1.18mi |
| 3512 N Holman Ct Oklahoma City, OK | 3.0 | 2.0 | 1092 | $1,275 | $1.17 | 3d | 1 | 1.18mi |
| 3721 Parkwoods Ln Oklahoma City, OK | 4.0 | 1.5 | 1266 | $1,625 | $1.28 | 2d | 1 | 1.19mi |
| 1620 Cynthia Dr Oklahoma City, OK | 4.0 | 1.0 | 1203 | $1,450 | $1.21 | 44d | 1 | 1.20mi |
| 910 N Oakview Dr Oklahoma City, OK | 3.0 | 2.0 | 1512 | $1,239 | $0.82 | 2d | 1 | 1.23mi |
| 3609 Woodside Dr Midwest City, OK | 3.0 | 1.0 | 858 | $995 | $1.16 | 3d | 1 | 1.25mi |
| 3413 Willow Creek Dr Oklahoma City, OK | 3.0 | 1.0 | 872 | $975 | $1.12 | 3d | 1 | 1.26mi |
| 3409 Willow Creek Dr Oklahoma City, OK | 3.0 | 1.0 | 932 | $1,050 | $1.13 | 24d | 1 | 1.27mi |
| 1168 N Douglas Blvd Oklahoma City, OK | 1.0–2.0 | 1.0 | 725 | $1,020 | $1.41 | 17d | 1 | 1.27mi |
| 9212 Jennifer Pl Oklahoma City, OK | 3.0 | 2.0 | 960 | $1,250 | $1.30 | 44d | 1 | 1.28mi |
| 1040 Sycamore Dr Oklahoma City, OK | 4.0 | 1.0 | 1144 | $1,595 | $1.39 | 2d | 1 | 1.29mi |
| 3513 Parkwoods Ln Oklahoma City, OK | 3.0 | 1.5 | 903 | $1,150 | $1.27 | 45d | 1 | 1.32mi |
| 1400 Marydale Ave Oklahoma City, OK | 3.0 | 1.0 | 1082 | $1,150 | $1.06 | 16d | 1 | 1.41mi |
Listing history 12 events
-
2026-04-21status Pending
-
2026-03-27$165,000 Active
-
2012-06-19soldstatus $35,000 263-char remark
Show marketing remark (263 chars)
Great investment property! 1 acre more or less, 3 bedroom 1 bath with fireplace. Well water but has Midwest City sewer & trash pickup. Owner started repairs and some renovation but could not complete it. Central Heat & Air quit working and was removed.
-
2011-12-05$37,500 263-char remark
Show marketing remark (263 chars)
Great investment property! 1 acre more or less, 3 bedroom 1 bath with fireplace. Well water but has Midwest City sewer & trash pickup. Owner started repairs and some renovation but could not complete it. Central Heat & Air quit working and was removed.
-
2009-08-06historical
-
2009-02-19$35,000
-
2008-09-19soldstatus $47,000
-
2008-09-15soldstatus $47,000
-
2007-12-19historical
-
2007-09-11$49,900
-
2003-12-03$53,550
-
1976-09-01soldstatus $15,033
ⓘ Source: listings_history table (triggers on properties + properties_extension) + one-shot
backfill from property_details.listing_events for pre-trigger history.
Tax reassessment forecast OK · Resets to sale price
- Current annual tax
- $1,133 · $94/mo
- Projected year-2 tax
- $1,485 · $124/mo
- Expected delta
- +$352/yr (+$29/mo · 31.0%)
ⓘ Screening estimate from a state-policy table — verify with the county assessor before closing.
Climate risk First Street
- Flood 1/10 Low FEMA zone X (unshaded) · 0% chance over 30 yrs
- Wildfire 3/10 Moderate
- Heat 5/10 Major 7 d/yr ≥107°F today · 18 d/yr by 30 yrs out
- Wind 2/10 Low 4% chance of damaging wind over 30 yrs
- Air quality 2/10 Low 1 unhealthy d/yr today · 2 by 30 yrs out
Nearby sold comps map
Loading sold comps map…
Walkable amenities ~0.75 mi
Loading nearby amenities…
Taxation est. · year 1
- Rental income
- $14,585
- − Mortgage interest
- −$9,243
- − Property taxes
- −$1,133
- − Insurance
- −$825
- − Repairs & maintenance
- −$1,167
- − Management
- −$1,167
- − Depreciation
- −$4,800
- Taxable loss
- −$3,749
- Est. tax savings @ 24.0%
- +$900
- After-tax cash flow
- $80/yr
For passive investors: Depreciation is non-cash, so a rental often shows a tax loss while cash-flowing — sheltering income. Rental losses are passive: they offset passive income freely, and up to $25,000/yr can offset ordinary (W-2) income if you actively participate and your MAGI is under $100k (phasing out to $0 by $150k); unused losses carry forward. On sale, claimed depreciation is recaptured at up to 25%, and gains may owe capital-gains tax (a 1031 exchange can defer both). Figures are a year-1 estimate at your 24.0% rate — not tax advice; consult a CPA.
Schools (NCES district)
- District
- Oklahoma City
- NCES district ID
- 4022770
- Math proficiency
- 7% ▼ -5.00%
- Reading proficiency
- 10% ▼ -6.00%
- Median HH income
- $35,606
- Composite
- 7.0/100
- National rank
- #9970
- State rank
- #254 of 270 in OK
Livability — Midwest City
- Score
- 71/100
- State rank
- #30
- US rank
- #6637
Category grades
Schools grade is shown separately in the Schools card above.
Census & demographics
- Census place
- Midwest City, OK
- County
- Oklahoma County · 771,644 people
- City population
- 57,386
- Metro
- Oklahoma City, OK
- Population (ZIP)
- 3,562
- Household income
- $58,670
- Rent vs Own
- Severe rent burden
- 54.0
Population outlook (Oklahoma County) Hauer SSP2
- Today (2025)
- 911,875 people
- By 2030
- 982,413 · +7.7%
- By 2040
- 1,130,468 · +24.0%
- By 2050
- 1,288,422 · +41.3%
- By 2075
- 1,711,482 · +87.7%
- By 2100
- 2,088,448 · +129.0%
Race, ethnicity, and origin ACS 2023
- Neighborhood character
- Diverse neighborhood (Simpson 0.67)
- Race & ethnicity
- Black 43% White 35% Hispanic / Latino 15% Two or more races 11%
- Hispanic origin (detail)
- Mexican 14%
- Common ancestry
- Iranian 2% Serbian 1%
- Foreign-born
- 4% · Canada
- Languages at home
- 91% English-only · Spanish 9%
Political lean MEDSL · Oklahoma
- 2024 margin
- Toss-up / Even · D 48.0% · R 49.7% · Other 2.3%
- 2008→2024 swing
- +15.1pp toward D · 2008: -16.8pp · 2024: -1.7pp
- All cycles
- 2024: R+1.7 2020: R+1.1 2016: R+10.5 2012: R+16.7 2008: R+16.8
Not yet ingested
- Civics
- —
Market trends
- HPI YoY
- ▲ 2.19%
- Current HPI
- 312.8025
- Rent YoY
- —
- Metro
- Oklahoma City, OK
- State GDP YoY
- ▲ 1.55%
- F500 in state
- 6
Industry mix (Fortune 500 HQ in OK)
| Industry | F500 HQs | Revenue |
|---|---|---|
| Energy | 3 | $48B |
|
||
Price history
+997.6% since first listed12 events — show timeline
- 2026-04-21 Pending — MLSOK
- 2026-03-27 Listed $165,000 MLSOK
- 2012-06-19 Sold (MLS) $35,000 MLSOK
- 2011-12-05 Listed $37,500 MLSOK
- 2009-08-06 Listing Removed — MLSOK
- 2009-02-19 Listed $35,000 MLSOK
- 2008-09-19 Sold (Public Records) $47,000 Public Records
- 2008-09-15 Sold (MLS) $47,000 MLSOK
- 2007-12-19 Listing Removed — MLSOK
- 2007-09-11 Listed $49,900 MLSOK
- 2003-12-03 Listed $53,550 MLSOK
- 1976-09-01 Sold (Public Records) $15,033 Public Records
Property tax history
+4.8%/yrLatest (2025): $1,133 · +3.4% YoY. Source: county tax records.
Cash-flow waterfall
monthlySold comps — $/sqft
last 12 mo · ≤1 miLoading sold comps…