 🏢 Co-op
41 Pine St #49 · Peabody, MA
Flood risk 1/10 · Minimal
- FEMA flood zone
- X (unshaded)
- Chance of flooding over 30 yrs
- 0.0%
- Est. flood insurance / yr
- $507 – $1,088
Fire risk 1/10 · Minimal
- Est. fire insurance / yr
- $915 – $1,699
Heat risk 5/10 · Moderate
- Hot days now (above 97°F)
- 7 days/yr
- Hot days in 30 yrs
- 15 days/yr
Wind risk 6/10 · Moderate
- Chance of severe wind over 30 yrs
- 64.0%
Air-quality risk 3/10 · Minor
- Unhealthy air days now
- 3 days/yr
- Unhealthy air days in 30 yrs
- 3 days/yr
Risk factors via First Street. Map © Google.
Why this score? — see what drove the B+ grade
The composite is a weighted blend of 9 inputs, each scored 0–100. Each bar is that input's sub-score; the figure is the points it added to the 100-point composite (weight × sub-score).
- Cash flow +30.0/30.0
- ARV discount +15.0/15.0
- 1% rule +10.0/10.0
- DSCR +10.0/10.0
- Livability +4.0/5.0
- Schools +3.1/10.0
- Condition / age +2.8/5.0
- Rent growth +2.3/5.0
- Appreciation +0.0/10.0
$149,900
🖨 Deal sheet (PDF) 📄 Offer letter ✓ Due diligence
Listing remarks MLS
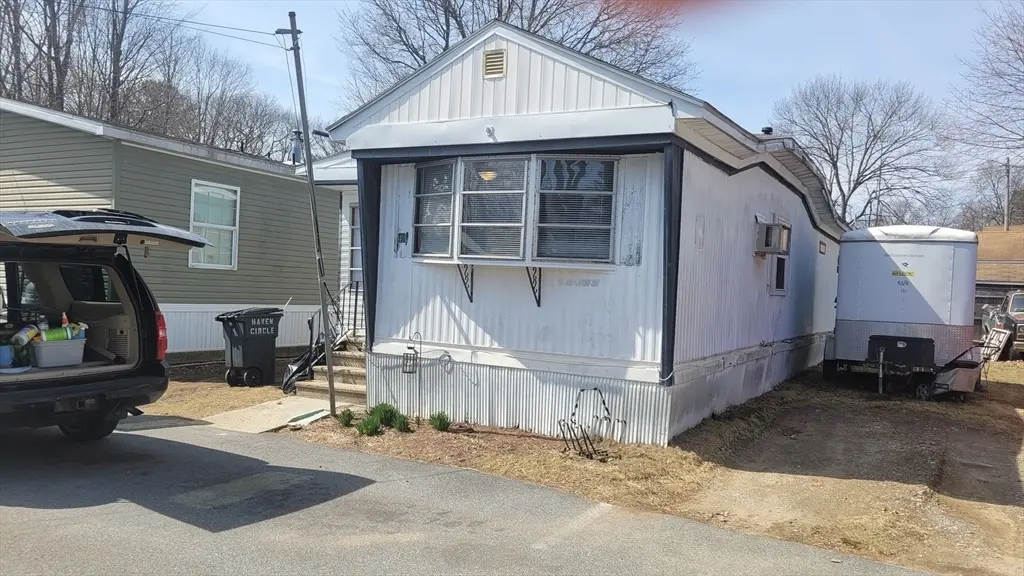
LOCATED AT HAVEN CIRCLE COOPERATIVE PARK IN WEST PEABODY. THIS LARGE UNIT HAS MANY UPDATES INCLUDING NEW FURNCE, NEW FLOORING, NEWER ROOF, NEWER ELECTRICAL AND MUCH MORE....THERE IS A LARGE BREZWAY AND A VERY NICE YARD. PITCHED ROOF . THE COOP FEE IS ONLY 270 A MONTH AND INCLUDES, RE TAXES, WATER AND SEWER, RUBBUSH REMOVAL AND COMMON AREA MAINTENANCE....BATHROOM AND PLUMBING NEEDS ATTENTION. ..1972 CROWN VANGUARD SERIAL NUMBER 2707-72
Key facts
- New furnace
- Newer roof
- New flooring
Tags
Neighborhood map
What this means for you Summary
Snapshot
- This is a 2-bed/1.0-bath manufactured listed at $150k. Condition is rated average.
Deal economics
- At list price, monthly cash flow is $1k ($15k/yr) — positive.
- The deal already cash-flows at list — no discount required.
- Meets the 1% rule at list price ($3k rent vs $150k).
- Recommended offer: $141k (6.0% below list) — sets the bar for market timing.
- Cap rate 16.1% vs local median 3.4% in Peabody — top-decile yield for the area; either an underpriced asset or a hidden risk that comps aren't pricing in. Stress-test before assuming the spread holds.
Location & tenants
- Location reads 79/100 on livability (#44 in MA, #2,070 nationally) — a middle-class / working-renter tenant base. Strengths: commute A+, employment A+, health & safety A+; Watch: amenities D+, cost of living F.
- Peabody (suburban): math 29% / reading 40% proficiency, ranked #233 of 302 in MA (top 77%) — families likely to look elsewhere, expect single-tenant / working-renter base with shorter leases.
- Market conditions: Rents soft (-0.9%/yr); 49 active listings in the ZIP; 3 comparable units currently listed for rent nearby; rentals leasing fast (median 0d on market — plan ~1-2 weeks tenant-placement turnaround); solid renter incomes; 1,032 units permitted in Essex County in 2024 (590 in 5+ unit buildings).
- This rent runs 40% of the median local income ($97k/yr) — at the standard rent-burdened threshold; future hikes will face affordability resistance.
Forward outlook
- Local home prices are declining (-3.0%/yr); year-one equity from $1k of loan paydown is wiped out by about $4k of value loss. Plan a longer hold.
- Essex County population projected at +15% by 2050 — long-run rental-demand tailwind backs the buy-and-hold thesis.
- At projected returns (-3.0% appreciation + 0.0% rent growth), your $42k cash investment doubles in ~4 years — after that, you're playing with house money.
Negotiation context
- It's been on market 77 days — a 6% lower offer ($141k) is reasonable based on typical stale-listing flexibility.
Risks & watch-outs
- Climate carrying-cost: major wind risk, 64% chance of damaging wind over 30y; extreme-heat days projected 7→15/yr by 2055 (HVAC capex compounding) — expect insurance premiums to compound above CPI over the hold.
Questions for the listing agent
- It's been on market 77 days. Have you received any prior offers? Is the seller open to a 6% concession, seller financing, or rate buy-down credit?
- Built in 1972 — when were the roof, HVAC, electrical panel, plumbing, and water heater last replaced?
- What does the HOA fee cover, when was the last increase, and are there any pending special assessments or reserve-fund shortfalls?
- Why hasn't it sold? Are there any deal-killer items the seller is aware of (foundation, flood, title, zoning, code violations)?
- Is there a deadline driving the sale (1031 exchange, divorce, estate, relocation)? That informs how much negotiation room exists.
- What's the average days-on-market for RENTAL listings here right now (not sales)? A rising rental-DOM trend means longer vacancies and softer asking-rent achievability than the comps imply.
- What's the recent tenant-quality profile in this submarket — average credit score on applications, eviction rate, late-payment / NSF rate, and stable-employment percentage? A property-management company in the area should have these aggregated.
- How much new for-sale + rental construction is in the pipeline within 1–3 miles? Heavy new supply typically softens prices + rents 12–24 months out; constrained supply supports both.
Investment metrics
- 1% rule
- 2.14% ✓
- Cap rate
- 16.13%
- Cash-on-cash
- 35.13%
- DSCR
- 2.56
- GRM
- 3.9
CMA / ARV
- ARV (median comp)
- $206,450
- List price
- $149,900
- Delta
- -27.39%
- Verdict
- UNDERPRICED
- Comps
- 4 within 1.0 mi
Show comp detail 1 sale within ~0.75 mi
| Address | Dist | Beds/Ba | Sqft | Sold | Price | $/sf | Match |
|---|---|---|---|---|---|---|---|
| 154 Newbury St #37 | 0.40mi | 2/1.5 | 720 (-3%) | 21mo | $240,000 | $333 | 57 |
Match score weights: distance 35% · size 25% · config 20% · recency 20%. Top-matched comps best support the ARV.
Projected returns pro-forma
-3.0% appreciation · 0.0% rent growth · sell at horizon
- IRR
- 26.9%
- Equity multiple
- 2.07×
- Total profit
- $44,790
- Equity at exit
- $22,351
- IRR
- 32.4%
- Equity multiple
- 3.49×
- Total profit
- $104,318
- Equity at exit
- $12,961
Cash invested: $41,972 (down + closing). Projections, not guarantees.
Landlord ↔ Tenant lean methodology
- Overall (STATE)
- 20 Strongly Tenant-Friendly
- State Massachusetts
- 20 Strongly Tenant-Friendly · D+15
- County
- — inherits STATE
- City
- — inherits STATE
ZIP-level market 01960
- Rents YoY
- -0.9%
- Active inventory
- 49
- Price-to-rent
- 3.9×
Monthly cashflow live
- Estimated rent
- $3,209 medium interval (Pro) →
- Mortgage (P&I)
- −$786
- Tax est. 1.5%
- −$187 /mo · $2,248/yr
- Insurance
- −$62
- HOA
- −$270
- Vacancy / Maint / Mgmt
- −$674
- Net cashflow
- $1,229
Break-even live
Sensitivity live
| Price | -10% $1,332 | -5% $1,281 | +0% $1,229 | +5% $1,177 | +10% $1,125 |
|---|---|---|---|---|---|
| Rent | -10% $975 | -5% $1,102 | +0% $1,229 | +5% $1,356 | +10% $1,482 |
| Rate | -1.0pp $1,304 | -0.5pp $1,267 | base $1,229 | +0.5pp $1,190 | +1.0pp $1,151 |
UW: 25.0% down · 7.5% · 30yr · 1.5% tax · 5.0% vac · 8.0% maint · 8.0% mgmt
Financing live
Cash to close
- Down payment
- $37,475
- Closing costs
- $4,497
- Reserves months
- —
- Total cash needed
- —
Loan-product check · same deal, 3 products live
Conventional
25% down · 7.5% · 30yr
- Down + closing
- —
- Monthly P&I
- —
- Monthly cashflow
- —
- DSCR
- —
- Eligible?
- —
Personal DTI + credit; lowest rate.
DSCR
20% down · 8.5% · 30yr
- Down + closing
- —
- Monthly P&I
- —
- Monthly cashflow
- —
- DSCR
- —
- Eligible?
- —
No personal income docs; deal must DSCR.
Hard money
10% down · 12.0% · 12mo
- Down + closing
- —
- Monthly P&I
- —
- Monthly cashflow
- —
- DSCR
- —
- Eligible?
- —
Short-term bridge; refi at stabilization.
Rent comps 3 comps
| Address | Beds | Baths | Sqft | Rent | $/sqft | DOM | Units | Dist |
|---|---|---|---|---|---|---|---|---|
| 128 Newbury St Peabody, MA | 3.0 | 1.0–2.0 | 955 | $3,554 | $3.72 | 0d | 14 | 0.64mi |
| 1000 Crane Brook Way Peabody, MA | 1.0–3.0 | 1.0–2.0 | 1137 | $3,184 | $2.80 | 0d | 25 | 1.19mi |
| 19 Magnolia Way Peabody, MA | 1.0–3.0 | 1.0–2.0 | 1034 | $3,248 | $3.14 | 0d | 29 | 1.47mi |
HOA detail
- Monthly dues
- $270 · $3,240/yr
- Likely covers
- watersewerelectric
Listing history 14 events
-
2026-06-15days on market $149,900 Active 77 DOM
-
2026-06-13days on market $149,900 Active 75 DOM
-
2026-06-13days on market $149,900 Active 74 DOM
-
2026-06-09days on market $149,900 Active 71 DOM
-
2026-06-08days on market $149,900 Active 70 DOM
-
2026-06-07days on market $149,900 Active 69 DOM
-
2026-06-04days on market $149,900 Active 66 DOM
-
2026-06-03days on market $149,900 Active 65 DOM
-
2026-06-02days on market $149,900 Active 64 DOM
-
2026-06-01days on market $149,900 Active 63 DOM
-
2026-05-31days on market $149,900 Active 62 DOM
-
2026-03-30price $149,900 448-char remark
Show marketing remark (448 chars)
LOCATED AT HAVEN CIRCLE COOPERATIVE PARK IN WEST PEABODY. THIS LARGE UNIT HAS MANY UPDATES INCLUDING NEW FURNCE, NEW FLOORING, NEWER ROOF, NEWER ELECTRICAL AND MUCH MORE....THERE IS A LARGE BREZWAY AND A VERY NICE YARD. PITCHED ROOF . THE COOP FEE IS ONLY 270 A MONTH AND INCLUDES, RE TAXES, WATER AND SEWER, RUBBUSH REMOVAL AND COMMON AREA MAINTENANCE....BATHROOM AND PLUMBING NEEDS ATTENTION. ..1972 CROWN VANGUARD SERIAL NUMBER 2707-72
-
2026-03-30price $159,900 448-char remark
Show marketing remark (448 chars)
LOCATED AT HAVEN CIRCLE COOPERATIVE PARK IN WEST PEABODY. THIS LARGE UNIT HAS MANY UPDATES INCLUDING NEW FURNCE, NEW FLOORING, NEWER ROOF, NEWER ELECTRICAL AND MUCH MORE....THERE IS A LARGE BREZWAY AND A VERY NICE YARD. PITCHED ROOF . THE COOP FEE IS ONLY 270 A MONTH AND INCLUDES, RE TAXES, WATER AND SEWER, RUBBUSH REMOVAL AND COMMON AREA MAINTENANCE....BATHROOM AND PLUMBING NEEDS ATTENTION. ..1972 CROWN VANGUARD SERIAL NUMBER 2707-72
-
2026-03-30$149,900 New 448-char remark
Show marketing remark (448 chars)
LOCATED AT HAVEN CIRCLE COOPERATIVE PARK IN WEST PEABODY. THIS LARGE UNIT HAS MANY UPDATES INCLUDING NEW FURNCE, NEW FLOORING, NEWER ROOF, NEWER ELECTRICAL AND MUCH MORE....THERE IS A LARGE BREZWAY AND A VERY NICE YARD. PITCHED ROOF . THE COOP FEE IS ONLY 270 A MONTH AND INCLUDES, RE TAXES, WATER AND SEWER, RUBBUSH REMOVAL AND COMMON AREA MAINTENANCE....BATHROOM AND PLUMBING NEEDS ATTENTION. ..1972 CROWN VANGUARD SERIAL NUMBER 2707-72
ⓘ Source: listings_history table (triggers on properties + properties_extension) + one-shot
backfill from property_details.listing_events for pre-trigger history.
Climate risk First Street
- Flood 1/10 Low FEMA zone X (unshaded) · 0% chance over 30 yrs
- Wildfire 1/10 Low
- Heat 5/10 Major 7 d/yr ≥97°F today · 15 d/yr by 30 yrs out
- Wind 6/10 Major 64% chance of damaging wind over 30 yrs
- Air quality 3/10 Moderate 3 unhealthy d/yr today · 3 by 30 yrs out
Nearby sold comps map
Loading sold comps map…
Walkable amenities ~0.75 mi
Loading nearby amenities…
Taxation est. · year 1
- Rental income
- $38,504
- − Mortgage interest
- −$8,397
- − Property taxes
- −$2,248
- − Insurance
- −$750
- − Repairs & maintenance
- −$3,080
- − Management
- −$3,080
- − HOA
- −$3,240
- − Depreciation
- −$4,361
- Taxable income
- $13,348
- Est. tax owed @ 24.0%
- −$3,203
- After-tax cash flow
- $11,543/yr
For passive investors: Depreciation is non-cash, so a rental often shows a tax loss while cash-flowing — sheltering income. Rental losses are passive: they offset passive income freely, and up to $25,000/yr can offset ordinary (W-2) income if you actively participate and your MAGI is under $100k (phasing out to $0 by $150k); unused losses carry forward. On sale, claimed depreciation is recaptured at up to 25%, and gains may owe capital-gains tax (a 1031 exchange can defer both). Figures are a year-1 estimate at your 24.0% rate — not tax advice; consult a CPA.
Condition & rehab AI · 8 photos
This manufactured home has moderate rehabilitation needs, with a focus on updating the bathroom and kitchen to improve both resale and rental value.
Repairs flagged
- Major bathroom fixtures — existing fixtures need replacement
- Major bathroom flooring — existing flooring needs replacement
Value-add opportunities
- Both new bathroom fixtures and flooring — improves both resale and rental value
- Both new kitchen appliances — enhances both resale and rental appeal
Renovation cost estimate screening
| Repair item | Severity | Est. cost |
|---|---|---|
| bathroom fixtures · existing fixtures need replacement | Major | $15,000–50,000 |
| bathroom flooring · existing flooring needs replacement | Major | $15,000–50,000 |
| Total estimated repair cost · 2 items | $30,000–100,000 |
Value-add ROI direction
- Both new bathroom fixtures and flooring — improves both resale and rental value ↑
- Both new kitchen appliances — enhances both resale and rental appeal ↑
ⓘ Cost ranges are severity-bucket heuristics (US national rule-of-thumb). Get contractor quotes + a written scope before underwriting a rehab budget.
Schools (NCES district)
- District
- Peabody
- NCES district ID
- 2509360
- Math proficiency
- 29% ▼ -13.00%
- Reading proficiency
- 40% ▼ -5.00%
- Median HH income
- $64,022
- Composite
- 31.23/100
- National rank
- #6033
- State rank
- #233 of 302 in MA
Livability — Peabody
- Score
- 79/100
- State rank
- #44
- US rank
- #2070
Category grades
Schools grade is shown separately in the Schools card above.
Census & demographics
- Census place
- Peabody, MA
- County
- Essex County · 632,995 people
- City population
- 54,474
- Metro
- Boston-Cambridge-Newton, MA-NH
- Population (ZIP)
- 54,474
- Household income
- $96,501
- Rent vs Own
- Severe rent burden
- 2570.0
Population outlook (Essex County) Hauer SSP2
- Today (2025)
- 840,920 people
- By 2030
- 872,201 · +3.7%
- By 2040
- 927,918 · +10.3%
- By 2050
- 970,206 · +15.4%
- By 2075
- 1,077,993 · +28.2%
- By 2100
- 1,103,053 · +31.2%
Race, ethnicity, and origin ACS 2023
- Neighborhood character
- Predominantly White (77%)
- Race & ethnicity
- White 77% Hispanic / Latino 12% Two or more races 10% Black 4% Asian 2%
- Hispanic origin (detail)
- Puerto Rican 2% Dominican 6%
- Common ancestry
- Russian 6% Lithuanian 4% Romanian 3%
- Foreign-born
- 17% · Canada, China
- Languages at home
- 76% English-only · Other Indo-European 11% Spanish 8% French/Haitian/Cajun 2%
Political lean MEDSL · Essex
- 2024 margin
- Strong D (+20.3) · D 59.2% · R 38.9% · Other 1.9%
- 2008→2024 swing
- 0.0pp no change · 2008: 20.3pp · 2024: 20.3pp
- All cycles
- 2024: D+20.3 2020: D+29.1 2016: D+22.5 2012: D+16.2 2008: D+20.3
Not yet ingested
- Civics
- —
Market trends
- HPI YoY
- ▼ -565.60%
- Current HPI
- 285.9699
- Rent YoY
- ▼ -0.91%
- Metro
- Boston-Cambridge-Newton, MA-NH
- State GDP YoY
- ▲ 2.28%
- F500 in state
- 38
Industry mix (Fortune 500 HQ in MA)
| Industry | F500 HQs | Revenue |
|---|---|---|
| Technology | 3 | $17B |
|
||
| Insurance | 2 | $84B |
|
||
| Retail | 2 | $76B |
|
||
| Life Sciences | 1 | $43B |
|
||
| Energy Technology | 1 | $31B |
|
||
| Aerospace / Defense | 1 | $18B |
|
||
Price history
+0.0% since first listed3 events — show timeline
- 2026-03-30 Price Changed $149,900 MLS PIN
- 2026-03-30 Price Changed $159,900 MLS PIN
- 2026-03-30 Listed $149,900 MLS PIN
Cash-flow waterfall
monthlySold comps — $/sqft
last 12 mo · ≤1 miLoading sold comps…