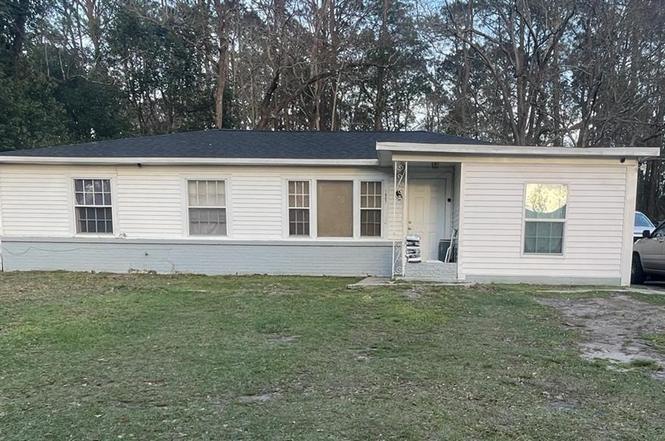
1607 Faure Dr E · Mobile, AL
Flood risk 1/10 · Minimal
- FEMA flood zone
- X (unshaded)
- Chance of flooding over 30 yrs
- 0.0%
- Est. flood insurance / yr
- $507 – $1,088
Fire risk 3/10 · Minor
- Est. fire insurance / yr
- $916 – $1,700
Heat risk 9/10 · Severe
- Hot days now (above 105°F)
- 7 days/yr
- Hot days in 30 yrs
- 19 days/yr
Wind risk 9/10 · Severe
- Chance of severe wind over 30 yrs
- 99.0%
Air-quality risk 2/10 · Minimal
- Unhealthy air days now
- 1 days/yr
- Unhealthy air days in 30 yrs
- 1 days/yr
Risk factors via First Street. Map © Google.
Why this score? — see what drove the B grade
The composite is a weighted blend of 9 inputs, each scored 0–100. Each bar is that input's sub-score; the figure is the points it added to the 100-point composite (weight × sub-score).
- Cash flow +30.0/30.0
- 1% rule +10.0/10.0
- DSCR +10.0/10.0
- ARV discount +7.6/15.0
- Rent growth +4.6/5.0
- Livability +3.8/5.0
- Condition / age +2.5/5.0
- Schools +2.3/10.0
- Appreciation +0.0/10.0
$89,900
🖨 Deal sheet (PDF) 📄 Offer letter ✓ Due diligence
Listing remarks MLS
Investor Special in an area where updated houses are selling well! 3/1 1288 sqft, vinyl exterior home on a slab. Solid house in need of some updates. Includes a living room, dining room, bonus room/den and indoor utility room. Needs a roof and flooring throughout. Needs paint and the kitchen needs updates. The Electrical is original but in good condition per the seller. City water & sewer.
Key facts
- Newer vinyl siding
- Newer water heater
- Laminate countertops
Tags
Neighborhood map
What this means for you Summary
Snapshot
- This is a 4-bed/1.0-bath single-family listed at $90k.
Deal economics
- At list price, monthly cash flow is $590 ($7k/yr) — positive.
- The deal already cash-flows at list — no discount required.
- Meets the 1% rule at list price ($1k rent vs $90k).
- Cap rate 14.2% vs local median 4.9% in Mobile — top-decile yield for the area; either an underpriced asset or a hidden risk that comps aren't pricing in. Stress-test before assuming the spread holds.
Location & tenants
- Location reads 75/100 on livability (#20 in AL, #4,262 nationally) — a middle-class / working-renter tenant base. Strengths: commute A+, cost of living A+, housing A+; Watch: crime F, employment D-.
- Mobile County (urban): math 15% / reading 39% proficiency, ranked #81 of 129 in AL (top 63%) — low school quality limits family demand, transient renter base, plan for 1-2y turnover; 67% free/reduced lunch — lower-income household profile, screen leases tightly.
- Zoned schools: Morningside Elementary School (math 9% / reading 29%, grade F, #478 of 627 statewide, top 76%, 455 students, 98% FRL); Pillans Middle School (math 2% / reading 17%, grade F, #233 of 257 statewide, top 91%, 537 students, 96% FRL); Lillie B Williamson High School (math 2% / reading 12%, grade F, #273 of 305 statewide, top 89%, 956 students, 94% FRL) — zoned schools average 96% FRL vs 67% district-wide (29 pts higher); higher-poverty schools than district average — tighter screening recommended.
- Zoned-school proficiency averages 12% at this address vs 27% district-wide (-15 pts) — the specific schools serving this property underperform the Mobile County average; the district grade overstates school quality for this exact location.
- Market conditions: Rents rising fast (+8.3%/yr); 139 active listings in the ZIP; 10 comparable units currently listed for rent nearby; rentals lingering (median 45d on market — plan ~5-8 weeks vacancy on turnover, expect pricing pressure); 60% of comp listings sitting > 30 days — soft ceiling on asking rent; lower-income renter base — watch delinquency; 1,678 units permitted in Mobile County in 2024 (264 in 5+ unit buildings).
- This rent runs 40% of the median local income ($44k/yr) — at the standard rent-burdened threshold; future hikes will face affordability resistance.
Forward outlook
- Local home prices are declining (-3.0%/yr); year-one equity from $622 of loan paydown is wiped out by about $3k of value loss. Plan a longer hold.
- Mobile County population projected to shrink 8% by 2050 — rents likely to lag national; underwrite the cash flow, not the appreciation.
- At projected returns (-3.0% appreciation + 8.0% rent growth), your $25k cash investment doubles in ~4 years — after that, you're playing with house money.
Negotiation context
- Only 8 days on market — expect competitive offers; lowballing is unlikely to land.
- 3 sale attempts since 4y ago with the ask held roughly flat each time — persistent listings suggest the price (not the market) is what's stuck; bring a comps-based counter.
- Current owner paid $30k; list at $90k implies a 200% gain — meaningful room to come down on a strong offer.
Risks & watch-outs
- Climate carrying-cost: severe wind risk, 99% chance of damaging wind over 30y; extreme-heat days projected 7→19/yr by 2055 (HVAC capex compounding) — expect insurance premiums to compound above CPI over the hold.
Questions for the listing agent
- Is there a deadline driving the sale (1031 exchange, divorce, estate, relocation)? That informs how much negotiation room exists.
- Schools are D-rated, which usually means shorter tenancies and higher turnover. Who's the typical renter profile here, and what's been the actual vacancy rate?
- Crime grade is F in this area — have there been break-ins, vandalism, or insurance claims at this property in the last 3 years? What carrier currently insures it and at what premium?
- What's the average days-on-market for RENTAL listings here right now (not sales)? A rising rental-DOM trend means longer vacancies and softer asking-rent achievability than the comps imply.
- What's the recent tenant-quality profile in this submarket — average credit score on applications, eviction rate, late-payment / NSF rate, and stable-employment percentage? A property-management company in the area should have these aggregated.
- How much new for-sale + rental construction is in the pipeline within 1–3 miles? Heavy new supply typically softens prices + rents 12–24 months out; constrained supply supports both.
Investment metrics
- 1% rule
- 1.62% ✓
- Cap rate
- 14.17%
- Cash-on-cash
- 28.12%
- DSCR
- 2.25
- GRM
- 5.1
CMA / ARV
- ARV (on-the-fly)
- $90,160
- Comps found
- 12
Show comp detail 12 sales within ~0.75 mi
| Address | Dist | Beds/Ba | Sqft | Sold | Price | $/sf | Match |
|---|---|---|---|---|---|---|---|
| 1607 Faure Dr E | 0.00mi | 4/1.0 | 1,288 (0%) | 1mo | $85,000 | $66 | 99 |
| 2707 Faure Dr S | 0.32mi | 4/1.0 | 1,244 (-3%) | 1mo | $93,000 | $75 | 78 |
| 2354 Octavia Dr S | 0.41mi | 3/1.5 (-1) | 1,300 (+1%) | 5mo | $55,000 | $42 | 68 |
| 1663 Darwood Dr | 0.29mi | 4/1.5 | 1,350 (+5%) | 11mo | $95,000 | $70 | 68 |
| 1609 Darwood Dr | 0.45mi | 3/1.0 (-1) | 1,248 (-3%) | 2mo | $76,000 | $61 | 67 |
| 1575 Marengo Dr | 0.45mi | 3/1.0 (-1) | 1,342 (+4%) | 9mo | $104,000 | $77 | 59 |
| 1611 Darwood Dr | 0.44mi | 4/1.5 | 1,148 (-11%) | 5mo | $112,500 | $98 | 55 |
| 2365 Dog River Dr N | 0.42mi | 4/2.0 | 1,400 (+9%) | 8mo | $65,000 | $46 | 55 |
| 2331 S Dog River Dr | 0.59mi | 3/1.0 (-1) | 1,366 (+6%) | 8mo | $167,000 | $122 | 51 |
| 2504 Oakmont Ct | 0.63mi | 3/2.0 (-1) | 1,269 (-2%) | 11mo | $170,000 | $134 | 50 |
| 2518 Greenlawn Dr | 0.42mi | 3/1.0 (-1) | 1,120 (-13%) | 6mo | $60,000 | $54 | 49 |
| 2606 Eldorado Dr | 0.34mi | 3/1.5 (-1) | 1,131 (-12%) | 11mo | $75,000 | $66 | 48 |
Match score weights: distance 35% · size 25% · config 20% · recency 20%. Top-matched comps best support the ARV.
Projected returns pro-forma
-3.0% appreciation · 8.0% rent growth · sell at horizon
- IRR
- 27.6%
- Equity multiple
- 2.22×
- Total profit
- $30,682
- Equity at exit
- $13,404
- IRR
- 37.8%
- Equity multiple
- 5.37×
- Total profit
- $110,040
- Equity at exit
- $7,773
Cash invested: $25,172 (down + closing). Projections, not guarantees.
Landlord ↔ Tenant lean methodology
- Overall (STATE)
- 90 Strongly Landlord-Friendly
- State Alabama
- 90 Strongly Landlord-Friendly · R+15
- County
- — inherits STATE
- City
- — inherits STATE
ZIP-level market 36605
- Rents YoY
- 8.3%
- Active inventory
- 139
- Price-to-rent
- 5.1×
Monthly cashflow live
- Estimated rent
- $1,455 high interval (Pro) →
- Mortgage (P&I)
- −$471
- Tax from tax record
- −$51 /mo · $610/yr
- Insurance
- −$37
- HOA
- −$0
- Vacancy / Maint / Mgmt
- −$306
- Net cashflow
- $590
Break-even live
Sensitivity live
| Price | -10% $641 | -5% $615 | +0% $590 | +5% $565 | +10% $539 |
|---|---|---|---|---|---|
| Rent | -10% $475 | -5% $532 | +0% $590 | +5% $647 | +10% $705 |
| Rate | -1.0pp $635 | -0.5pp $613 | base $590 | +0.5pp $567 | +1.0pp $543 |
UW: 25.0% down · 7.5% · 30yr · 1.5% tax · 5.0% vac · 8.0% maint · 8.0% mgmt
Financing live
Cash to close
- Down payment
- $22,475
- Closing costs
- $2,697
- Reserves months
- —
- Total cash needed
- —
Loan-product check · same deal, 3 products live
Conventional
25% down · 7.5% · 30yr
- Down + closing
- —
- Monthly P&I
- —
- Monthly cashflow
- —
- DSCR
- —
- Eligible?
- —
Personal DTI + credit; lowest rate.
DSCR
20% down · 8.5% · 30yr
- Down + closing
- —
- Monthly P&I
- —
- Monthly cashflow
- —
- DSCR
- —
- Eligible?
- —
No personal income docs; deal must DSCR.
Hard money
10% down · 12.0% · 12mo
- Down + closing
- —
- Monthly P&I
- —
- Monthly cashflow
- —
- DSCR
- —
- Eligible?
- —
Short-term bridge; refi at stabilization.
Rent comps 10 comps
| Address | Beds | Baths | Sqft | Rent | $/sqft | DOM | Units | Dist |
|---|---|---|---|---|---|---|---|---|
| 2665 S Faure Dr Mobile, AL | 4.0 | 1.0 | 1817 | $1,514 | $0.83 | 22d | 1 | 0.22mi |
| 2359 Vermillion Dr Mobile, AL | 3.0 | 1.0 | 1064 | $895 | $0.84 | 22d | 1 | 0.44mi |
| 1466 Darwood Dr Mobile, AL | 3.0 | 1.5 | 1053 | $1,400 | $1.33 | 45d | 1 | 0.59mi |
| 1411 Greenbrier Dr Mobile, AL | 3.0 | 1.0 | 1069 | $995 | $0.93 | 45d | 1 | 0.70mi |
| 2255 Dog River Ct Unit 1043454P Mobile, AL | 4.0 | 2.0 | 1851 | $2,890 | $1.56 | 22d | 1 | 0.75mi |
| 2456 McLaughlin Dr Mobile, AL | 3.0 | 1.0 | 1405 | $1,300 | $0.93 | 45d | 1 | 0.76mi |
| 2115 Barron Pl Mobile, AL | 3.0 | 1.0 | 1000 | $1,200 | $1.20 | 45d | 1 | 1.14mi |
| 1601 Neshota Dr Mobile, AL | 2.0–3.0 | 1.0 | 815 | $825 | $1.01 | 15d | 7 | 1.34mi |
| 1601 Neshota Dr Apt 86 Mobile, AL | 3.0 | 1.0 | 880 | $900 | $1.02 | 45d | 1 | 1.34mi |
| 1351 Dauphin Island Pkwy Mobile, AL | 3.0 | 1.0 | 992 | $1,095 | $1.10 | 45d | 1 | 1.40mi |
Listing history 12 events
-
2026-04-27status Pending
-
2026-04-21status Active
-
2026-03-13status Pending
-
2026-03-13historical
-
2026-03-11$89,900 Active
-
2022-10-26soldstatus $30,000 Closed 396-char remark
Show marketing remark (396 chars)
Investor Special in an area where updated houses are selling well! 3/1 1288 sqft, vinyl exterior home on a slab. Solid house in need of some updates. Includes a living room, dining room, bonus room/den and indoor utility room. Needs a roof and flooring throughout. Needs paint and the kitchen needs updates. The Electrical is original but in good condition per the seller. City water & sewer.
-
2022-10-15historical 396-char remark
Show marketing remark (396 chars)
Investor Special in an area where updated houses are selling well! 3/1 1288 sqft, vinyl exterior home on a slab. Solid house in need of some updates. Includes a living room, dining room, bonus room/den and indoor utility room. Needs a roof and flooring throughout. Needs paint and the kitchen needs updates. The Electrical is original but in good condition per the seller. City water & sewer.
-
2022-09-29price $34,900 396-char remark
Show marketing remark (396 chars)
Investor Special in an area where updated houses are selling well! 3/1 1288 sqft, vinyl exterior home on a slab. Solid house in need of some updates. Includes a living room, dining room, bonus room/den and indoor utility room. Needs a roof and flooring throughout. Needs paint and the kitchen needs updates. The Electrical is original but in good condition per the seller. City water & sewer.
-
2022-09-22price $39,900 396-char remark
Show marketing remark (396 chars)
Investor Special in an area where updated houses are selling well! 3/1 1288 sqft, vinyl exterior home on a slab. Solid house in need of some updates. Includes a living room, dining room, bonus room/den and indoor utility room. Needs a roof and flooring throughout. Needs paint and the kitchen needs updates. The Electrical is original but in good condition per the seller. City water & sewer.
-
2022-09-19price $43,000 396-char remark
Show marketing remark (396 chars)
Investor Special in an area where updated houses are selling well! 3/1 1288 sqft, vinyl exterior home on a slab. Solid house in need of some updates. Includes a living room, dining room, bonus room/den and indoor utility room. Needs a roof and flooring throughout. Needs paint and the kitchen needs updates. The Electrical is original but in good condition per the seller. City water & sewer.
-
2022-09-08price $44,900 396-char remark
Show marketing remark (396 chars)
Investor Special in an area where updated houses are selling well! 3/1 1288 sqft, vinyl exterior home on a slab. Solid house in need of some updates. Includes a living room, dining room, bonus room/den and indoor utility room. Needs a roof and flooring throughout. Needs paint and the kitchen needs updates. The Electrical is original but in good condition per the seller. City water & sewer.
-
2022-08-31$49,900 Active 396-char remark
Show marketing remark (396 chars)
Investor Special in an area where updated houses are selling well! 3/1 1288 sqft, vinyl exterior home on a slab. Solid house in need of some updates. Includes a living room, dining room, bonus room/den and indoor utility room. Needs a roof and flooring throughout. Needs paint and the kitchen needs updates. The Electrical is original but in good condition per the seller. City water & sewer.
ⓘ Source: listings_history table (triggers on properties + properties_extension) + one-shot
backfill from property_details.listing_events for pre-trigger history.
Tax reassessment forecast AL · Resets to sale price
- Current annual tax
- $610 · $51/mo
- Projected year-2 tax
- $610 · $51/mo
- Expected delta
- $0/yr ($0/mo · 0.0%)
ⓘ Screening estimate from a state-policy table — verify with the county assessor before closing.
Climate risk First Street
- Flood 1/10 Low FEMA zone X (unshaded) · 0% chance over 30 yrs
- Wildfire 3/10 Moderate
- Heat 9/10 Extreme 7 d/yr ≥105°F today · 19 d/yr by 30 yrs out
- Wind 9/10 Extreme 99% chance of damaging wind over 30 yrs
- Air quality 2/10 Low 1 unhealthy d/yr today · 1 by 30 yrs out
Nearby sold comps map
Loading sold comps map…
Walkable amenities ~0.75 mi
Loading nearby amenities…
Taxation est. · year 1
- Rental income
- $17,463
- − Mortgage interest
- −$5,036
- − Property taxes
- −$610
- − Insurance
- −$450
- − Repairs & maintenance
- −$1,397
- − Management
- −$1,397
- − Depreciation
- −$2,615
- Taxable income
- $5,959
- Est. tax owed @ 24.0%
- −$1,430
- After-tax cash flow
- $5,649/yr
For passive investors: Depreciation is non-cash, so a rental often shows a tax loss while cash-flowing — sheltering income. Rental losses are passive: they offset passive income freely, and up to $25,000/yr can offset ordinary (W-2) income if you actively participate and your MAGI is under $100k (phasing out to $0 by $150k); unused losses carry forward. On sale, claimed depreciation is recaptured at up to 25%, and gains may owe capital-gains tax (a 1031 exchange can defer both). Figures are a year-1 estimate at your 24.0% rate — not tax advice; consult a CPA.
Schools (NCES district)
- District
- Mobile County
- NCES district ID
- 0102370
- Math proficiency
- 15% ▼ -28.00%
- Reading proficiency
- 39% ▬ 0.00%
- Median HH income
- $42,455
- Composite
- 22.9/100
- National rank
- #8002
- State rank
- #81 of 129 in AL
Livability — Mobile
- Score
- 75/100
- State rank
- #20
- US rank
- #4262
Category grades
Schools grade is shown separately in the Schools card above.
Census & demographics
- Census place
- Mobile, AL
- County
- Mobile County · 246,577 people
- City population
- 205,729
- Metro
- Mobile, AL
- Population (ZIP)
- 25,104
- Household income
- $43,538
- Rent vs Own
- Severe rent burden
- 1521.0
Population outlook (Mobile County) Hauer SSP2
- Today (2025)
- 415,303 people
- By 2030
- 411,755 · -0.9%
- By 2040
- 399,670 · -3.8%
- By 2050
- 382,616 · -7.9%
- By 2075
- 337,353 · -18.8%
- By 2100
- 283,391 · -31.8%
Race, ethnicity, and origin ACS 2023
- Neighborhood character
- Predominantly Black (67%)
- Race & ethnicity
- Black 67% White 27% Two or more races 4% Hispanic / Latino 3%
- Common ancestry
- Lithuanian 3% Slovak 2% Iranian 1%
- Foreign-born
- 3% · Canada
- Languages at home
- 97% English-only · Spanish 2%
Political lean MEDSL · Mobile
- 2024 margin
- R (+16.4) · D 41.3% · R 57.7%
- 2008→2024 swing
- -7.7pp toward R · 2008: -8.7pp · 2024: -16.4pp
- All cycles
- 2024: R+16.4 2020: R+11.9 2016: R+13.9 2012: R+9.3 2008: R+8.7
Not yet ingested
- Civics
- —
Market trends
- HPI YoY
- ▼ -96.46%
- Current HPI
- 125.9526
- Rent YoY
- ▲ 8.26%
- Metro
- Mobile, AL
- State GDP YoY
- ▲ 2.94%
- F500 in state
- 4
Industry mix (Fortune 500 HQ in AL)
| Industry | F500 HQs | Revenue |
|---|---|---|
| Financial Services | 1 | $8B |
|
||
| Healthcare | 1 | $5B |
|
||
Price history
+80.2% since first listed12 events — show timeline
- 2026-04-27 Pending — GCMLS AL
- 2026-04-21 Relisted — GCMLS AL
- 2026-03-13 Pending — GCMLS AL
- 2026-03-13 Delisted — GCMLS AL
- 2026-03-11 Listed $89,900 GCMLS AL
- 2022-10-26 Sold (MLS) $30,000 GCMLS AL
- 2022-10-15 Delisted — GCMLS AL
- 2022-09-29 Price Changed $34,900 GCMLS AL
- 2022-09-22 Price Changed $39,900 GCMLS AL
- 2022-09-19 Price Changed $43,000 GCMLS AL
- 2022-09-08 Price Changed $44,900 GCMLS AL
- 2022-08-31 Listed $49,900 GCMLS AL
Property tax history
+2.6%/yrLatest (2025): $610 · +7.6% YoY. Source: county tax records.
Cash-flow waterfall
monthlySold comps — $/sqft
last 12 mo · ≤1 miLoading sold comps…