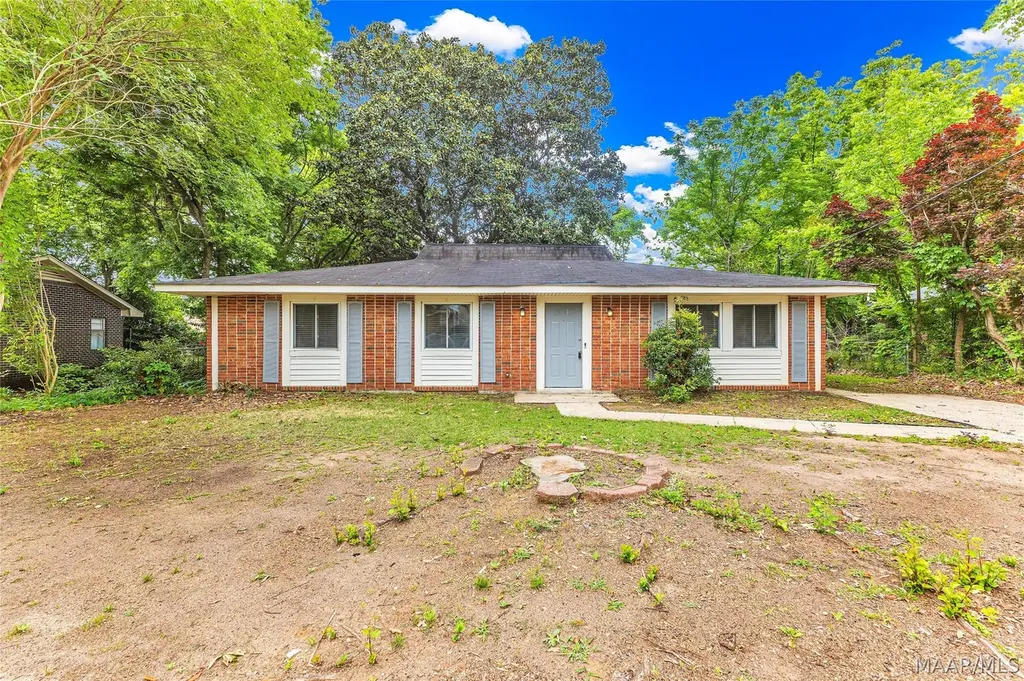
6132 Gladstone Dr · Montgomery, AL
Flood risk 1/10 · Minimal
- FEMA flood zone
- X (unshaded)
- Chance of flooding over 30 yrs
- 0.0%
- Est. flood insurance / yr
- $507 – $1,088
Fire risk 4/10 · Minor
- Est. fire insurance / yr
- $916 – $1,700
Heat risk 8/10 · Major
- Hot days now (above 107°F)
- 7 days/yr
- Hot days in 30 yrs
- 20 days/yr
Wind risk 8/10 · Major
- Chance of severe wind over 30 yrs
- 80.0%
Air-quality risk 4/10 · Minor
- Unhealthy air days now
- 4 days/yr
- Unhealthy air days in 30 yrs
- 5 days/yr
Risk factors via First Street. Map © Google.
Why this score? — see what drove the D grade
The composite is a weighted blend of 9 inputs, each scored 0–100. Each bar is that input's sub-score; the figure is the points it added to the 100-point composite (weight × sub-score).
- Cash flow +19.4/30.0
- DSCR +6.1/10.0
- 1% rule +4.2/10.0
- Rent growth +3.2/5.0
- Livability +3.2/5.0
- Condition / age +2.5/5.0
- Schools +1.7/10.0
- ARV discount +0.4/15.0
- Appreciation +0.0/10.0
$164,800
🖨 Deal sheet 📄 Offer letter ✓ Due diligence
Listing remarks
Welcome to this beautifully remodeled 4-bedroom, 2-bath home featuring an open floor plan and abundant natural lighting throughout. Thoughtfully updated from top to bottom, this home boasts brand new flooring, fresh paint, updated fixtures, new cabinetry, granite countertops, and stylish new vanities. Every detail has been carefully designed to create a modern and inviting space perfect for its new owners. Step outside to enjoy the spacious fully fenced backyard, ideal for pets, entertaining, or simply relaxing after a long day. A detached storage building also conveys with the property, providing the perfect amount of additional storage space. This move in ready home is one you won’t
Key facts
- Natural lighting
- Remodeled
- Open floor plan
Tags
Property features AI
Exterior
- Parking: Driveway; Carport for 2 vehicles
- Utilities: Public water; Public sewer; Electricity available; Cable available; High-speed internet available
- Home design: Single-story home
- Construction: Brick and wood siding exterior; Slab foundation; Built (year per public records)
- Exterior features: Fully fenced lot; Porch; Patio; Exterior storage; Mature trees; Paved road access; City lot
Interior
- Kitchen: Eat-in kitchen; Plumbed for ice maker
- Bedrooms: Three first-floor bedrooms
- Flooring: Plank flooring; Vinyl flooring
- Bathrooms: Two full bathrooms (first floor)
- Heating & cooling: Central heating (electric); Central air conditioning (electric)
- Interior features: Blinds and window treatments
- Laundry & utility: First-floor laundry; Washer and dryer hookups; Electric water heater
Neighborhood map
What this means for you Summary
Snapshot
- This is a 4-bed/2.0-bath single-family listed at $165k.
Deal economics
- At list price, monthly cash flow is $185 ($2k/yr) — positive.
- The deal already cash-flows at list — no discount required.
- To meet the 1% rule (rent ≥ 1% of price), the offer needs to be $152k (7.7% below list).
- Recommended offer: $152k (7.7% below list) — sets the bar for 1% rule.
- Cap rate 7.6% vs local median 6.0% in Montgomery — meaningfully above typical; check what's discounted (condition, days-on-market, listing class) to confirm the premium yield is real.
Location & tenants
- Location reads 65/100 on livability (#138 in AL) — a middle-class / working-renter tenant base. Strengths: cost of living A+, housing A+; Watch: schools C-, employment D, crime F.
- Montgomery County (urban): math 9% / reading 31% proficiency, ranked #106 of 129 in AL (top 82%) — low school quality limits family demand, transient renter base, plan for 1-2y turnover; 70% free/reduced lunch — lower-income household profile, screen leases tightly.
- Market conditions: Rents rising (+3.0%/yr); 407 active listings in the ZIP; 34 comparable units currently listed for rent nearby; rentals at typical pace (median 21d on market — plan ~3-4 weeks tenant-placement turnaround); 460 units permitted in Montgomery County in 2024 (37 in 5+ unit buildings).
Forward outlook
- Local home prices are declining (-3.0%/yr); year-one equity from $1k of loan paydown is wiped out by about $5k of value loss. Plan a longer hold.
- Montgomery County population projected to shrink 8% by 2050 — rents likely to lag national; underwrite the cash flow, not the appreciation.
Negotiation context
- It's been on market 41 days — a 3% lower offer ($160k) is reasonable based on typical stale-listing flexibility.
- 2 sale attempts with the ask held roughly flat each time — persistent listings suggest the price (not the market) is what's stuck; bring a comps-based counter.
- Current owner paid $60k; list at $165k implies a 175% gain — meaningful room to come down on a strong offer.
Risks & watch-outs
- Climate carrying-cost: severe wind risk, 80% chance of damaging wind over 30y; extreme-heat days projected 7→20/yr by 2055 (HVAC capex compounding) — expect insurance premiums to compound above CPI over the hold.
Questions for the listing agent
- It's been on market 41 days. Have you received any prior offers? Is the seller open to a 8% concession, seller financing, or rate buy-down credit?
- Built in 1971 — when were the roof, HVAC, electrical panel, plumbing, and water heater last replaced?
- Is there a deadline driving the sale (1031 exchange, divorce, estate, relocation)? That informs how much negotiation room exists.
- Crime grade is F in this area — have there been break-ins, vandalism, or insurance claims at this property in the last 3 years? What carrier currently insures it and at what premium?
- The area grade is low — what's the realistic commute time and amenity access for the typical tenant pool here? Any planned neighborhood developments (good or bad) we should know about?
- What's the average days-on-market for RENTAL listings here right now (not sales)? A rising rental-DOM trend means longer vacancies and softer asking-rent achievability than the comps imply.
- What's the recent tenant-quality profile in this submarket — average credit score on applications, eviction rate, late-payment / NSF rate, and stable-employment percentage? A property-management company in the area should have these aggregated.
- How much new for-sale + rental construction is in the pipeline within 1–3 miles? Heavy new supply typically softens prices + rents 12–24 months out; constrained supply supports both.
Investment metrics
- 1% rule
- 0.92% ✗
- Cap rate
- 7.64%
- Cash-on-cash
- 4.81%
- DSCR
- 1.21
- GRM
- 9.0
CMA / ARV
- ARV (median comp)
- $142,304
- List price
- $164,800
- Delta
- 15.81%
- Verdict
- OVERPRICED
- Comps
- 20 within 1.0 mi
Show comp detail 12 sales within ~0.75 mi
| Address | Dist | Beds/Ba | Sqft | Sold | Price | $/sf | Match |
|---|---|---|---|---|---|---|---|
| 424 Mulligan Dr | 0.11mi | 4/2.0 | 1,566 (+1%) | 2mo | $168,000 | $107 | 91 |
| 341 N Burbank Dr | 0.29mi | 4/2.0 | 1,584 (+3%) | 2mo | $165,000 | $104 | 80 |
| 415 Stroll Dr | 0.18mi | 4/2.0 | 1,710 (+11%) | 0mo | $175,900 | $103 | 73 |
| 220 Newcastle Ln | 0.23mi | 3/2.0 (-1) | 1,368 (-11%) | 2mo | $162,500 | $119 | 63 |
| 6120 Hinchcliff Rd | 0.18mi | 3/2.0 (-1) | 1,350 (-13%) | 3mo | $159,000 | $118 | 63 |
| 6625 Rock Ledge Rd | 0.59mi | 3/2.0 (-1) | 1,480 (-4%) | 1mo | $189,500 | $128 | 59 |
| 5791 Darien Dr | 0.64mi | 3/2.0 (-1) | 1,473 (-5%) | 1mo | $153,000 | $104 | 57 |
| 5737 Darien Dr | 0.72mi | 3/2.0 (-1) | 1,511 (-2%) | 3mo | $172,000 | $114 | 55 |
| 6265 Wares Ferry Rd | 0.54mi | 3/2.0 (-1) | 1,336 (-14%) | 0mo | $141,000 | $106 | 47 |
| 6515 Ridgeview Ln | 0.53mi | 3/2.0 (-1) | 1,343 (-13%) | 4mo | $210,000 | $156 | 45 |
| 404 Rock Ledge Ct | 0.65mi | 3/2.0 (-1) | 1,372 (-11%) | 5mo | $200,000 | $146 | 42 |
| 576 Dunbarton Rd | 0.67mi | 3/2.0 (-1) | 1,355 (-12%) | 4mo | $152,000 | $112 | 40 |
Match score weights: distance 35% · size 25% · config 20% · recency 20%. Top-matched comps best support the ARV.
Projected returns pro-forma
-3.0% appreciation · 2.99% rent growth · sell at horizon
- IRR
- -8.9%
- Equity multiple
- 0.68×
- Total profit
- $-14,982
- Equity at exit
- $24,572
- IRR
- 0.6%
- Equity multiple
- 1.04×
- Total profit
- $1,861
- Equity at exit
- $14,249
Cash invested: $46,144 (down + closing). Projections, not guarantees.
Landlord ↔ Tenant lean methodology
- Overall (STATE)
- 90 Strongly Landlord-Friendly
- State Alabama
- 90 Strongly Landlord-Friendly · R+15
- County
- — inherits STATE
- City
- — inherits STATE
ZIP-level market 36117
- Home prices YoY
- -20.0%
- Rents YoY
- 3.0%
- Active inventory
- 407
- Price-to-rent
- 9.0×
Monthly cashflow live
- Estimated rent
- $1,521 high interval (Pro) →
- Mortgage (P&I)
- −$864
- Tax from tax record
- −$84 /mo · $1,007/yr
- Insurance
- −$69
- HOA
- −$0
- Vacancy / Maint / Mgmt
- −$319
- Net cashflow
- $185
Break-even live
UW: 25.0% down · 7.5% · 30yr · 1.5% tax · 5.0% vac · 8.0% maint · 8.0% mgmt
Financing live
Cash to close
- Down payment
- $41,200
- Closing costs
- $4,944
- Reserves months
- —
- Total cash needed
- —
Loan-product check · same deal, 3 products live
Conventional
25% down · 7.5% · 30yr
- Down + closing
- —
- Monthly P&I
- —
- Monthly cashflow
- —
- DSCR
- —
- Eligible?
- —
Personal DTI + credit; lowest rate.
DSCR
20% down · 8.5% · 30yr
- Down + closing
- —
- Monthly P&I
- —
- Monthly cashflow
- —
- DSCR
- —
- Eligible?
- —
No personal income docs; deal must DSCR.
Hard money
10% down · 12.0% · 12mo
- Down + closing
- —
- Monthly P&I
- —
- Monthly cashflow
- —
- DSCR
- —
- Eligible?
- —
Short-term bridge; refi at stabilization.
Rent comps 34 comps
| Address | Beds | Baths | Sqft | Rent | $/sqft | DOM | Units | Dist |
|---|---|---|---|---|---|---|---|---|
| 438 Mulligan Dr Montgomery, AL | 4.0 | 2.0 | 1232 | $1,500 | $1.22 | 43d | 1 | 0.10mi |
| 457 Mulligan Dr Montgomery, AL | 3.0 | 2.0 | 1344 | $1,335 | $0.99 | 43d | 1 | 0.15mi |
| 241 Kroy Dr Montgomery, AL | 4.0 | 2.0 | 1450 | $1,195 | $0.82 | 43d | 1 | 0.18mi |
| 428 Fieldbrook Dr Montgomery, AL | 3.0 | 1.5 | 1440 | $995 | $0.69 | 21d | 1 | 0.19mi |
| 6265 Nature Dr Montgomery, AL | 3.0 | 2.0 | 1400 | $1,050 | $0.75 | 13d | 1 | 0.26mi |
| 341 N Burbank Dr Montgomery, AL | 5.0 | 2.0 | 1584 | $1,800 | $1.14 | 13d | 1 | 0.28mi |
| 323 N Burbank Dr Montgomery, AL | 4.0 | 2.0 | 1584 | $1,381 | $0.87 | 13d | 1 | 0.29mi |
| 523 Placid Dr Montgomery, AL | 3.0 | 2.0 | 1122 | $1,195 | $1.07 | 43d | 1 | 0.30mi |
| 6320 Burbank Crossing Loop Montgomery, AL | 3.0 | 2.0 | 1238 | $1,600 | $1.29 | 43d | 1 | 0.33mi |
| 6411 Pinebrook Dr Montgomery, AL | 3.0 | 1.5 | 1120 | $1,095 | $0.98 | 43d | 1 | 0.34mi |
| 6121 Boardwalk Blvd Montgomery, AL | 3.0 | 2.0 | 1155 | $1,075 | $0.93 | 21d | 1 | 0.38mi |
| 6121 Boardwalk Blvd Montgomery, AL | 1.0–3.0 | 1.0–2.0 | 877 | $1,075 | $1.23 | 13d | 4 | 0.38mi |
| 706 Placid Dr Montgomery, AL | 3.0 | 1.5 | 1120 | $1,400 | $1.25 | 13d | 1 | 0.49mi |
| 760 N Burbank Dr Montgomery, AL | 3.0 | 2.0 | 1102 | $1,400 | $1.27 | 43d | 1 | 0.51mi |
| 6265 Wares Ferry Rd Montgomery, AL | 3.0 | 2.0 | 1336 | $1,600 | $1.20 | 13d | 1 | 0.51mi |
| 5805 Hyde Park Dr Montgomery, AL | 3.0 | 2.0 | 1757 | $1,511 | $0.86 | 21d | 1 | 0.66mi |
| 5712 Roxboro Dr Montgomery, AL | 4.0 | 2.0 | 1544 | $1,450 | $0.94 | 21d | 1 | 0.67mi |
| 6637 Ridgeview Cir Montgomery, AL | 3.0 | 2.5 | 1458 | $1,700 | $1.17 | 21d | 1 | 0.73mi |
| 713 Amity Ln Montgomery, AL | 4.0 | 2.0 | 1696 | $1,900 | $1.12 | 43d | 1 | 0.74mi |
| 728 Amity Ln Montgomery, AL | 4.0 | 2.0 | 1218 | $1,700 | $1.40 | 13d | 1 | 0.75mi |
| 5926 Carmel Dr Montgomery, AL | 3.0 | 2.0 | 1158 | $1,200 | $1.04 | 43d | 1 | 1.01mi |
| 203 Eastdale Rd S Montgomery, AL | 1.0–3.0 | 1.0–2.0 | 931 | $1,290 | $1.39 | 13d | 13 | 1.05mi |
| 135 Hambleton Rd Montgomery, AL | 1.0–3.0 | 1.0–2.0 | 900 | $1,640 | $1.82 | 13d | 11 | 1.05mi |
| 529 Mitylene Dr Montgomery, AL | 3.0 | 2.0 | 1463 | $1,550 | $1.06 | 21d | 1 | 1.08mi |
| 5735 Sweet Meadow Dr Montgomery, AL | 3.0 | 2.0 | 1413 | $1,525 | $1.08 | 43d | 1 | 1.12mi |
| 113 Kentucky Oaks Montgomery, AL | 3.0 | 2.0 | 1246 | $1,600 | $1.28 | 21d | 1 | 1.27mi |
| 500 Eastdale Rd S Montgomery, AL | 1.0–3.0 | 1.0–2.5 | 1042 | $900 | $0.86 | 21d | 20 | 1.28mi |
| 6409 Deerwood Pl Montgomery, AL | 3.0 | 2.0 | 1504 | $1,711 | $1.14 | 13d | 1 | 1.29mi |
| 516 Lawndale Ln Montgomery, AL | 3.0 | 1.0 | 1125 | $1,150 | $1.02 | 43d | 1 | 1.30mi |
| 535 Lawndale Ln Montgomery, AL | 4.0 | 1.5 | 1260 | $1,100 | $0.87 | 13d | 1 | 1.35mi |
| 633 Groveland Dr Montgomery, AL | 3.0 | 2.0 | 1424 | $1,200 | $0.84 | 43d | 1 | 1.42mi |
| 6272 Deerwood Dr Montgomery, AL | 3.0 | 2.0 | 1754 | $1,875 | $1.07 | 21d | 1 | 1.44mi |
| 6272 Deerwood Dr Montgomery, AL | 3.0 | 2.0 | 1754 | $1,785 | $1.02 | 13d | 1 | 1.44mi |
| 6061 Karen Valley Cv Montgomery, AL | 3.0 | 2.0 | 1509 | $1,500 | $0.99 | 21d | 1 | 1.49mi |
Listing history 19 events
-
2026-06-18days on market $164,800 Active 41 DOM
-
2026-06-17days on market $164,800 Active 40 DOM
-
2026-06-16days on market $164,800 Active 39 DOM
-
2026-06-15days on market $164,800 Active 38 DOM
-
2026-06-14days on market $164,800 Active 36 DOM
-
2026-06-13days on market $164,800 Active 35 DOM
-
2026-06-10days on market $164,800 Active 33 DOM
-
2026-06-09days on market $164,800 Active 32 DOM
-
2026-06-08days on market $164,800 Active 31 DOM
-
2026-06-07days on market $164,800 Active 30 DOM
-
2026-06-03days on market $164,800 Active 26 DOM
-
2026-06-02days on market $164,800 Active 25 DOM
-
2026-06-01days on market $164,800 Active 24 DOM
-
2026-05-31days on market $164,800 Active 23 DOM
-
2026-05-30days on market $164,800 Active 22 DOM
-
2026-05-18status Active 713-char remark
-
2026-05-16historical Contingent 713-char remark
-
2026-05-08$164,900 Active 713-char remark
-
2026-01-26soldstatus $60,000
ⓘ Source: listings_history table (triggers on properties + properties_extension) + one-shot
backfill from property_details.listing_events for pre-trigger history.
Tax reassessment forecast AL · Resets to sale price
- Current annual tax
- $1,007 · $84/mo
- Projected year-2 tax
- $1,007 · $84/mo
- Expected delta
- $0/yr ($0/mo · -0.0%)
ⓘ Screening estimate from a state-policy table — verify with the county assessor before closing.
Climate risk First Street
- Flood 1/10 Low FEMA zone X (unshaded) · 0% chance over 30 yrs
- Wildfire 4/10 Moderate
- Heat 8/10 Severe 7 d/yr ≥107°F today · 20 d/yr by 30 yrs out
- Wind 8/10 Severe 80% chance of damaging wind over 30 yrs
- Air quality 4/10 Moderate 4 unhealthy d/yr today · 5 by 30 yrs out
Nearby sold comps map
Loading sold comps map…
Walkable amenities ~0.75 mi
Loading nearby amenities…
Taxation est. · year 1
- Rental income
- $18,257
- − Mortgage interest
- −$9,231
- − Property taxes
- −$1,007
- − Insurance
- −$824
- − Repairs & maintenance
- −$1,461
- − Management
- −$1,461
- − Depreciation
- −$4,794
- Taxable loss
- −$521
- Est. tax savings @ 24.0%
- +$125
- After-tax cash flow
- $2,346/yr
For passive investors: Depreciation is non-cash, so a rental often shows a tax loss while cash-flowing — sheltering income. Rental losses are passive: they offset passive income freely, and up to $25,000/yr can offset ordinary (W-2) income if you actively participate and your MAGI is under $100k (phasing out to $0 by $150k); unused losses carry forward. On sale, claimed depreciation is recaptured at up to 25%, and gains may owe capital-gains tax (a 1031 exchange can defer both). Figures are a year-1 estimate at your 24.0% rate — not tax advice; consult a CPA.
Schools (NCES district)
- District
- Montgomery County
- NCES district ID
- 0102430
- Math proficiency
- 9% ▼ -21.00%
- Reading proficiency
- 31% ▼ -1.00%
- Median HH income
- $43,902
- Composite
- 17.24/100
- National rank
- #9093
- State rank
- #106 of 129 in AL
Livability — Montgomery
- Score
- 65/100
- State rank
- #138
- US rank
- #13416
Category grades
Schools grade is shown separately in the Schools card above.
Census & demographics
- Census place
- Montgomery, AL
- County
- Montgomery County · 190,016 people
- City population
- 175,913
- Metro
- Montgomery, AL
- Population (ZIP)
- 53,172
- Household income
- $74,720
- Rent vs Own
- Severe rent burden
- 1742.0
Population outlook (Montgomery County) Hauer SSP2
- Today (2025)
- 224,008 people
- By 2030
- 221,460 · -1.1%
- By 2040
- 214,179 · -4.4%
- By 2050
- 204,912 · -8.5%
- By 2075
- 177,821 · -20.6%
- By 2100
- 145,134 · -35.2%
Race, ethnicity, and origin ACS 2023
- Neighborhood character
- Diverse neighborhood (Simpson 0.60)
- Race & ethnicity
- Black 53% White 34% Asian 8% Two or more races 3% Hispanic / Latino 3%
- Common ancestry
- Italian 1% Slovak 1% Lithuanian 1%
- Foreign-born
- 9% · South Korea, Canada, China
- Languages at home
- 90% English-only · Korean 4% Spanish 3% Other Indo-European 1%
Political lean MEDSL · Montgomery
- 2024 margin
- Solid D (+30.7) · D 64.8% · R 34.1% · Other 1.1%
- 2008→2024 swing
- +11.5pp toward D · 2008: 19.2pp · 2024: 30.7pp
- All cycles
- 2024: D+30.7 2020: D+31.5 2016: D+26.2 2012: D+24.3 2008: D+19.2
Not yet ingested
- Civics
- —
Market trends
- HPI YoY
- ▼ -37.24%
- Current HPI
- 148.7728
- Rent YoY
- ▲ 2.99%
- Metro
- Montgomery, AL
- State GDP YoY
- ▲ 2.94%
- F500 in state
- 4
Industry mix (Fortune 500 HQ in AL)
| Industry | F500 HQs | Revenue |
|---|---|---|
| Financial Services | 1 | $8B |
|
||
| Healthcare | 1 | $5B |
|
||
Price history
+174.7% since first listed5 events — show timeline
- 2026-05-23 Price Changed $164,800 MAAR
- 2026-05-18 Relisted — MAAR
- 2026-05-16 Contingent — MAAR
- 2026-05-08 Listed $164,900 MAAR
- 2026-01-26 Sold (Public Records) $60,000 Public Records
Property tax history
+6.1%/yrLatest (2025): $1,007 · +2.4% YoY. Source: county tax records.
Cash-flow waterfall
monthlySold comps — $/sqft
last 12 mo · ≤1 miLoading sold comps…