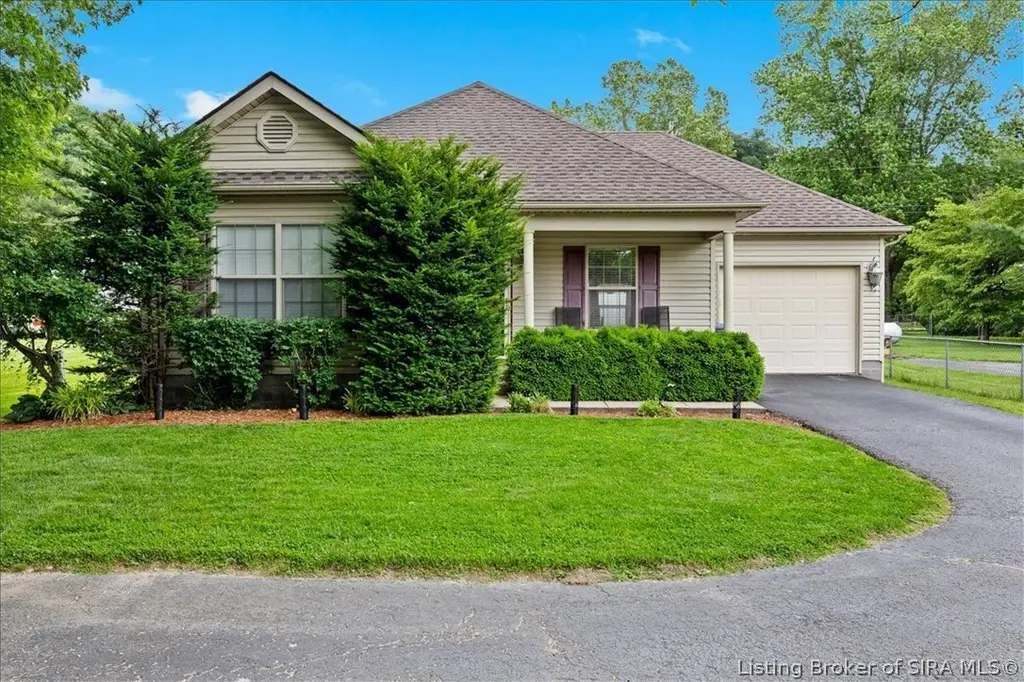
307 W Water St · Borden, IN
Flood risk 4/10 · Minor
- FEMA flood zone
- X (unshaded)
- Chance of flooding over 30 yrs
- 0.22%
- Est. flood insurance / yr
- $507 – $1,088
Fire risk 3/10 · Minor
- Est. fire insurance / yr
- $717 – $1,331
Heat risk 5/10 · Moderate
- Hot days now (above 104°F)
- 7 days/yr
- Hot days in 30 yrs
- 21 days/yr
Wind risk 2/10 · Minimal
- Chance of severe wind over 30 yrs
- 1.0%
Air-quality risk 2/10 · Minimal
- Unhealthy air days now
- 1 days/yr
- Unhealthy air days in 30 yrs
- 2 days/yr
Risk factors via First Street. Map © Google.
Why this score? — see what drove the C+ grade
The composite is a weighted blend of 9 inputs, each scored 0–100. Each bar is that input's sub-score; the figure is the points it added to the 100-point composite (weight × sub-score).
- Cash flow +18.2/30.0
- ARV discount +12.7/15.0
- Appreciation +10.0/10.0
- DSCR +5.7/10.0
- Schools +5.0/10.0
- 1% rule +3.9/10.0
- Livability +3.1/5.0
- Rent growth +2.5/5.0
- Condition / age +2.5/5.0
$230,000
🖨 Deal sheet 📄 Offer letter ✓ Due diligence
Listing remarks
Welcome home to this well-maintained 3-bedroom, 2-bath ranch offering comfortable one-level living and a spacious, functional floor plan. The inviting living room features a tray ceiling and opens seamlessly to the eat-in kitchen, where abundant cabinetry, a center island with seating, and generous dining space make everyday living and entertaining easy. The primary suite provides a private retreat with an en-suite bath, while two additional bedrooms offer flexibility for family, guests, or a home office. Neutral finishes throughout create a warm and welcoming atmosphere, and the home has been lovingly cared for and move-in ready. Step outside to enjoy the backyard patio, perfect for relaxi
Key facts
- Backyard patio
- Eat in kitchen
- Storage shed
Tags
Property features AI
Finance
- Financial info: Annual property tax listed
Exterior
- Parking: Attached garage with automatic garage door opener (1 car)
- Utilities: Public water; Public sewer; Connected to municipal water
- Home design: Single-story home; Frame construction with vinyl siding; Shingle roof; Poured foundation; Residential zoning
- Construction: Frame construction with vinyl siding; Shingle roof; Poured foundation; Built as single-story
- Exterior features: Landscaping; Paved driveway; Covered porch; Patio
Interior
- Kitchen: Oven; Range; Dishwasher; Refrigerator; Vinyl flooring in kitchen
- Bedrooms: Two first-floor bedrooms (approx. 9 x 11 and 10 x 11); Main bedroom includes attached full bath
- Flooring: Carpet in living areas and bedrooms; Vinyl in dining room and kitchen
- Bathrooms: Two full bathrooms (one attached to main bedroom)
- Heating & cooling: Forced air heating; Central air conditioning
- Interior features: Ceramic bath; Ceiling fan(s); Main level primary bedroom; Window treatments; Blinds; Thermal windows
- Laundry & utility: Main-level laundry in a laundry closet
Neighborhood map
What this means for you Summary
Snapshot
- This is a 3-bed/1.0-bath single-family listed at $230k.
Deal economics
- At list price, monthly cash flow is $205 ($2k/yr) — positive.
- The deal already cash-flows at list — no discount required.
- To meet the 1% rule (rent ≥ 1% of price), the offer needs to be $204k (11.3% below list).
- Recommended offer: $204k (11.3% below list) — sets the bar for 1% rule.
Location & tenants
- Location reads 61/100 on livability (#507 in IN) — a middle-class / working-renter tenant base. Strengths: crime A+, cost of living A+, housing A+; Watch: employment D+, amenities F, commute F.
- Market conditions: 26 active listings in the ZIP; 911 units permitted in Clark County in 2024 (133 in 5+ unit buildings).
Forward outlook
- In year one you build about $25k of equity ($2k loan paydown + $23k appreciation (10.0% local appreciation)).
- Clark County population projected at +17% by 2050 — long-run rental-demand tailwind backs the buy-and-hold thesis.
- At projected returns (10.0% appreciation + 3.0% rent growth), your $64k cash investment doubles in ~3 years — after that, you're playing with house money.
- By year 2, paydown + projected appreciation supports a ~$40k cash-out refi (75% LTV) — recoverable capital for the next deal without selling this one.
Negotiation context
- Only 1 days on market — expect competitive offers; lowballing is unlikely to land.
Risks & watch-outs
- Climate carrying-cost: extreme-heat days projected 7→21/yr by 2055 (HVAC capex compounding) — expect insurance premiums to compound above CPI over the hold.
Questions for the listing agent
- Is there a deadline driving the sale (1031 exchange, divorce, estate, relocation)? That informs how much negotiation room exists.
- Schools are B-rated — typically a magnet for longer-tenancy family renters. What's the average tenant stay here, and is there a school-zone premium baked into asking?
- What's the average days-on-market for RENTAL listings here right now (not sales)? A rising rental-DOM trend means longer vacancies and softer asking-rent achievability than the comps imply.
- What's the recent tenant-quality profile in this submarket — average credit score on applications, eviction rate, late-payment / NSF rate, and stable-employment percentage? A property-management company in the area should have these aggregated.
- How much new for-sale + rental construction is in the pipeline within 1–3 miles? Heavy new supply typically softens prices + rents 12–24 months out; constrained supply supports both.
Investment metrics
- 1% rule
- 0.89% ✗
- Cap rate
- 7.36%
- Cash-on-cash
- 3.81%
- DSCR
- 1.17
- GRM
- 9.4
CMA / ARV
- ARV (on-the-fly)
- $260,164
- Comps found
- 5
Show comp detail 5 sales within ~0.75 mi
| Address | Dist | Beds/Ba | Sqft | Sold | Price | $/sf | Match |
|---|---|---|---|---|---|---|---|
| 633 W Water St | 0.26mi | 3/1.0 | 1,200 (-11%) | 8mo | $240,000 | $200 | 63 |
| 112 Mckinley Dr | 0.28mi | 4/1.0 (+1) | 1,242 (-8%) | 7mo | $204,000 | $164 | 63 |
| 236 Brewer Dr | 0.44mi | 3/2.0 | 1,148 (-15%) | 0mo | $225,000 | $196 | 51 |
| 203 Borden Ridge Dr | 0.42mi | 3/2.0 | 1,215 (-10%) | 12mo | $235,000 | $193 | 50 |
| 206 Borden Ridge Dr | 0.43mi | 4/2.0 (+1) | 1,542 (+14%) | 10mo | $235,000 | $152 | 39 |
Match score weights: distance 35% · size 25% · config 20% · recency 20%. Top-matched comps best support the ARV.
Projected returns pro-forma
10.0% appreciation · 3.0% rent growth · sell at horizon
- IRR
- 27.0%
- Equity multiple
- 3.15×
- Total profit
- $138,215
- Equity at exit
- $207,202
- IRR
- 23.6%
- Equity multiple
- 7.16×
- Total profit
- $396,611
- Equity at exit
- $446,839
Cash invested: $64,400 (down + closing). Projections, not guarantees.
Landlord ↔ Tenant lean methodology
- Overall (STATE)
- 90 Strongly Landlord-Friendly
- State Indiana
- 90 Strongly Landlord-Friendly · R+11
- County
- — inherits STATE
- City
- — inherits STATE
ZIP-level market 47106
- Home prices YoY
- 6.7%
- Active inventory
- 26
- Price-to-rent
- 9.4×
Monthly cashflow live
- Estimated rent
- $2,041 medium interval (Pro) →
- Mortgage (P&I)
- −$1,206
- Tax from tax record
- −$106 /mo · $1,270/yr
- Insurance
- −$96
- HOA
- −$0
- Vacancy / Maint / Mgmt
- −$429
- Net cashflow
- $205
Break-even live
UW: 25.0% down · 7.5% · 30yr · 1.5% tax · 5.0% vac · 8.0% maint · 8.0% mgmt
Financing live
Cash to close
- Down payment
- $57,500
- Closing costs
- $6,900
- Reserves months
- —
- Total cash needed
- —
Loan-product check · same deal, 3 products live
Conventional
25% down · 7.5% · 30yr
- Down + closing
- —
- Monthly P&I
- —
- Monthly cashflow
- —
- DSCR
- —
- Eligible?
- —
Personal DTI + credit; lowest rate.
DSCR
20% down · 8.5% · 30yr
- Down + closing
- —
- Monthly P&I
- —
- Monthly cashflow
- —
- DSCR
- —
- Eligible?
- —
No personal income docs; deal must DSCR.
Hard money
10% down · 12.0% · 12mo
- Down + closing
- —
- Monthly P&I
- —
- Monthly cashflow
- —
- DSCR
- —
- Eligible?
- —
Short-term bridge; refi at stabilization.
Listing history 2 events
-
2026-06-02remarks 699-char remark
-
2026-06-02$230,000 Active 1 DOM
ⓘ Source: listings_history table (triggers on properties + properties_extension) + one-shot
backfill from property_details.listing_events for pre-trigger history.
Tax reassessment forecast IN · Partial reset (capped growth)
- Current annual tax
- $1,270 · $106/mo
- Projected year-2 tax
- $1,612 · $134/mo
- Expected delta
- +$343/yr (+$29/mo · 27.0%)
ⓘ Screening estimate from a state-policy table — verify with the county assessor before closing.
Climate risk First Street
- Flood 4/10 Moderate FEMA zone X (unshaded) · 22% chance over 30 yrs
- Wildfire 3/10 Moderate
- Heat 5/10 Major 7 d/yr ≥104°F today · 21 d/yr by 30 yrs out
- Wind 2/10 Low 100% chance of damaging wind over 30 yrs
- Air quality 2/10 Low 1 unhealthy d/yr today · 2 by 30 yrs out
Nearby sold comps map
Loading sold comps map…
Walkable amenities ~0.75 mi
Loading nearby amenities…
Taxation est. · year 1
- Rental income
- $24,492
- − Mortgage interest
- −$12,884
- − Property taxes
- −$1,270
- − Insurance
- −$1,150
- − Repairs & maintenance
- −$1,959
- − Management
- −$1,959
- − Depreciation
- −$6,691
- Taxable loss
- −$1,421
- Est. tax savings @ 24.0%
- +$341
- After-tax cash flow
- $2,796/yr
For passive investors: Depreciation is non-cash, so a rental often shows a tax loss while cash-flowing — sheltering income. Rental losses are passive: they offset passive income freely, and up to $25,000/yr can offset ordinary (W-2) income if you actively participate and your MAGI is under $100k (phasing out to $0 by $150k); unused losses carry forward. On sale, claimed depreciation is recaptured at up to 25%, and gains may owe capital-gains tax (a 1031 exchange can defer both). Figures are a year-1 estimate at your 24.0% rate — not tax advice; consult a CPA.
Schools (NCES district)
No district data.
Livability — Borden
- Score
- 61/100
- State rank
- #507
- US rank
- #17982
Category grades
Schools grade is shown separately in the Schools card above.
Census & demographics
- Census place
- Borden, IN
- Population (ZIP)
- 4,583
Population outlook (Clark County) Hauer SSP2
- Today (2025)
- 126,401 people
- By 2030
- 131,455 · +4.0%
- By 2040
- 140,471 · +11.1%
- By 2050
- 147,677 · +16.8%
- By 2075
- 161,702 · +27.9%
- By 2100
- 164,078 · +29.8%
Race, ethnicity, and origin ACS 2023
- Neighborhood character
- Predominantly White (95%)
- Race & ethnicity
- White 95% Two or more races 2%
- Common ancestry
- Lithuanian 2% Serbian 2% Italian 2%
- Foreign-born
- 0%
Political lean MEDSL · Clark
- 2024 margin
- Strong R (+20.4) · D 38.9% · R 59.3% · Other 1.8%
- 2008→2024 swing
- -13.3pp toward R · 2008: -7.1pp · 2024: -20.4pp
- All cycles
- 2024: R+20.4 2020: R+18.3 2016: R+22.0 2012: R+9.9 2008: R+7.1
Not yet ingested
- Civics
- —
Market trends
- HPI YoY
- ▲ 21.50%
- Current HPI
- 344.4
- Rent YoY
- —
- Metro
- —
- State GDP YoY
- ▲ 2.90%
- F500 in state
- 18
Industry mix (Fortune 500 HQ in IN)
| Industry | F500 HQs | Revenue |
|---|---|---|
| Industrial Machinery | 2 | $37B |
|
||
| Healthcare | 1 | $177B |
|
||
| Pharmaceuticals | 1 | $45B |
|
||
| Metals / Steel | 1 | $18B |
|
||
| Agriculture | 1 | $17B |
|
||
| Packaging | 1 | $12B |
|
||
Price history
1 event — show timeline
- 2026-06-02 Listed $230,000 SIRA
Property tax history
+3.7%/yrLatest (2024): $1,270 · +19.8% YoY. Source: county tax records.
Cash-flow waterfall
monthlySold comps — $/sqft
last 12 mo · ≤1 miLoading sold comps…