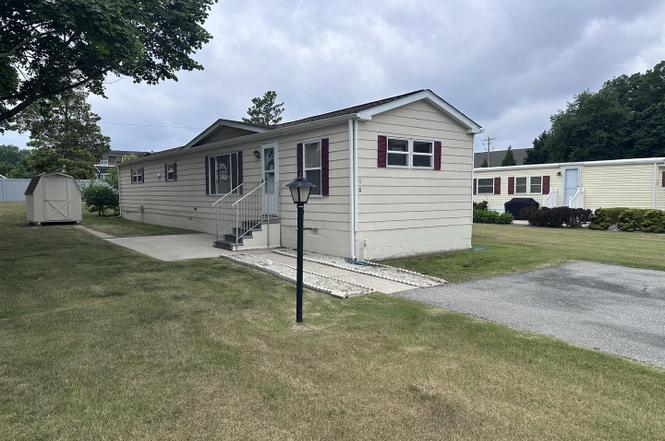
18 Branchwood Dr · Rehoboth Beach, DE
Flood risk 6/10 · Moderate
- FEMA flood zone
- X (shaded)
- Chance of flooding over 30 yrs
- 0.7%
- Est. flood insurance / yr
- $473 – $860
Fire risk 1/10 · Minimal
- Est. fire insurance / yr
- $476 – $884
Heat risk 9/10 · Severe
- Hot days now (above 101°F)
- 7 days/yr
- Hot days in 30 yrs
- 18 days/yr
Wind risk 8/10 · Major
- Chance of severe wind over 30 yrs
- 80.0%
Air-quality risk 2/10 · Minimal
- Unhealthy air days now
- 1 days/yr
- Unhealthy air days in 30 yrs
- 1 days/yr
Risk factors via First Street. Map © Google.
Why this score? — see what drove the D grade
The composite is a weighted blend of 9 inputs, each scored 0–100. Each bar is that input's sub-score; the figure is the points it added to the 100-point composite (weight × sub-score).
- Cash flow +15.0/30.0
- 1% rule +5.0/10.0
- DSCR +5.0/10.0
- ARV discount +4.6/15.0
- Schools +4.2/10.0
- Livability +3.6/5.0
- Rent growth +2.5/5.0
- Condition / age +2.5/5.0
- Appreciation +0.0/10.0
$34,900
🖨 Deal sheet (PDF) 📄 Offer letter ✓ Due diligence
Listing remarks
Handyman Special Opportunity! Bring your vision, creativity, and a little elbow grease to unlock this home's full potential. Priced to reflect the work needed, this property offers a great chance to build equity while customizing the space to your own style and preferences. Whether you're a first-time buyer looking for an affordable entry into homeownership or an investor seeking your next project, the possibilities are endless. The home does require some TLC and updates, but the reward can be well worth the effort. Buyers should note that certain exterior improvements and resale-related repairs are required by the community and must be completed within a specified timeframe following settl
Key facts
- 5,227 sq ft lot
- 2 parking spots
- Built 1978
Property features AI
Finance
- Other: Improvement assessed value reported
- Financial info: Land lease: $762 per month; Land lease has 1 year remaining; Annual ground rent listed as an income/expense item
Exterior
- Parking: Driveway parking; Two driveway spaces (total 2 garage/parking spaces)
- Utilities: Public sewer; Community water
- Home design: Manufactured home, single wide; Above-grade living space (910 finished)
- Construction: Block construction
- Exterior features: Not in a federal flood zone; Ground rent exists; paid annually
Interior
- Bedrooms: Two bedrooms on the main level
- Bathrooms: Two full bathrooms on the main level
- Heating & cooling: Forced air heating (oil fuel); Central air conditioning (electric); Electric hot water
- Interior features: Estimated living area; No basement; Accessibility features present
Neighborhood map
What this means for you Summary
Snapshot
- This is a 2-bed/2.0-bath manufactured listed at $35k.
Deal economics
- At list price, monthly cash flow is $2k ($26k/yr) — positive.
- The deal already cash-flows at list — no discount required.
- Meets the 1% rule at list price ($3k rent vs $35k).
- Cap rate 81.3% vs local median 1.1% in Rehoboth Beach — top-decile yield for the area; either an underpriced asset or a hidden risk that comps aren't pricing in. Stress-test before assuming the spread holds.
Location & tenants
- Location reads 71/100 on livability (#20 in DE) — a middle-class / working-renter tenant base. Strengths: schools A+, amenities A+, employment A+; Watch: crime F, commute F, cost of living F.
- Cape Henlopen School District (town): math 42% / reading 55% proficiency, ranked #5 of 26 in DE (top 19%) — families likely to look elsewhere, expect single-tenant / working-renter base with shorter leases.
- Market conditions: 331 active listings in the ZIP; 2 comparable units currently listed for rent nearby; solid renter incomes; 4,354 units permitted in Sussex County in 2024 (344 in 5+ unit buildings).
- This rent runs 36% of the median local income ($102k/yr) — at the standard rent-burdened threshold; future hikes will face affordability resistance.
Forward outlook
- Local home prices are declining (-3.0%/yr); year-one equity from $241 of loan paydown is wiped out by about $1k of value loss. Plan a longer hold.
- Sussex County population projected at +25% by 2050 — long-run rental-demand tailwind backs the buy-and-hold thesis.
- At projected returns (-3.0% appreciation + 3.0% rent growth), your $10k cash investment doubles in ~1 year — after that, you're playing with house money.
Negotiation context
- Only 3 days on market — expect competitive offers; lowballing is unlikely to land.
Risks & watch-outs
- Climate carrying-cost: major flood risk; severe wind risk, 80% chance of damaging wind over 30y; extreme-heat days projected 7→18/yr by 2055 (HVAC capex compounding) — expect insurance premiums to compound above CPI over the hold.
Questions for the listing agent
- Built in 1978 — when were the roof, HVAC, electrical panel, plumbing, and water heater last replaced?
- Is there a deadline driving the sale (1031 exchange, divorce, estate, relocation)? That informs how much negotiation room exists.
- Schools are A-rated — typically a magnet for longer-tenancy family renters. What's the average tenant stay here, and is there a school-zone premium baked into asking?
- Crime grade is F in this area — have there been break-ins, vandalism, or insurance claims at this property in the last 3 years? What carrier currently insures it and at what premium?
- The area grade is low — what's the realistic commute time and amenity access for the typical tenant pool here? Any planned neighborhood developments (good or bad) we should know about?
- What's the average days-on-market for RENTAL listings here right now (not sales)? A rising rental-DOM trend means longer vacancies and softer asking-rent achievability than the comps imply.
- What's the recent tenant-quality profile in this submarket — average credit score on applications, eviction rate, late-payment / NSF rate, and stable-employment percentage? A property-management company in the area should have these aggregated.
- How much new for-sale + rental construction is in the pipeline within 1–3 miles? Heavy new supply typically softens prices + rents 12–24 months out; constrained supply supports both.
Investment metrics
- 1% rule
- 8.68% ✓
- Cap rate
- 81.35%
- Cash-on-cash
- 268.05%
- DSCR
- 12.93
- GRM
- 1.0
CMA / ARV
- ARV (on-the-fly)
- $32,760
- Comps found
- 1
Show comp detail 1 sale within ~0.75 mi
| Address | Dist | Beds/Ba | Sqft | Sold | Price | $/sf | Match |
|---|---|---|---|---|---|---|---|
| 19962 Center Ave #3125 | 0.69mi | 3/1.0 (+1) | 886 (-3%) | 13mo | $32,000 | $36 | 44 |
Match score weights: distance 35% · size 25% · config 20% · recency 20%. Top-matched comps best support the ARV.
Projected returns pro-forma
-3.0% appreciation · 3.0% rent growth · sell at horizon
- IRR
- —
- Equity multiple
- 14.65×
- Total profit
- $133,396
- Equity at exit
- $5,204
- IRR
- —
- Equity multiple
- 31.22×
- Total profit
- $295,285
- Equity at exit
- $3,018
Cash invested: $9,772 (down + closing). Projections, not guarantees.
Landlord ↔ Tenant lean methodology
- Overall (STATE)
- 70 Landlord-Friendly
- State Delaware
- 70 Landlord-Friendly · D+7
- County
- — inherits STATE
- City
- — inherits STATE
ZIP-level market 19971
- Active inventory
- 331
- Price-to-rent
- 1.0×
Monthly cashflow live
- Estimated rent
- $3,030 medium interval (Pro) →
- Mortgage (P&I)
- −$183
- Tax from tax record
- −$13 /mo · $156/yr
- Insurance
- −$15
- HOA
- −$0
- Vacancy / Maint / Mgmt
- −$636
- Net cashflow
- $2,183
Break-even live
Sensitivity live
| Price | -10% $2,203 | -5% $2,193 | +0% $2,183 | +5% $2,173 | +10% $2,163 |
|---|---|---|---|---|---|
| Rent | -10% $1,943 | -5% $2,063 | +0% $2,183 | +5% $2,302 | +10% $2,422 |
| Rate | -1.0pp $2,200 | -0.5pp $2,192 | base $2,183 | +0.5pp $2,174 | +1.0pp $2,165 |
UW: 25.0% down · 7.5% · 30yr · 1.5% tax · 5.0% vac · 8.0% maint · 8.0% mgmt
Financing live
Cash to close
- Down payment
- $8,725
- Closing costs
- $1,047
- Reserves months
- —
- Total cash needed
- —
Loan-product check · same deal, 3 products live
Conventional
25% down · 7.5% · 30yr
- Down + closing
- —
- Monthly P&I
- —
- Monthly cashflow
- —
- DSCR
- —
- Eligible?
- —
Personal DTI + credit; lowest rate.
DSCR
20% down · 8.5% · 30yr
- Down + closing
- —
- Monthly P&I
- —
- Monthly cashflow
- —
- DSCR
- —
- Eligible?
- —
No personal income docs; deal must DSCR.
Hard money
10% down · 12.0% · 12mo
- Down + closing
- —
- Monthly P&I
- —
- Monthly cashflow
- —
- DSCR
- —
- Eligible?
- —
Short-term bridge; refi at stabilization.
Rent comps 2 comps
| Address | Beds | Baths | Sqft | Rent | $/sqft | DOM | Units | Dist |
|---|---|---|---|---|---|---|---|---|
| 36400 Warwick Dr Rehoboth Beach, DE | 3.0 | 2.5 | 792 | $3,500 | $4.42 | 44d | 1 | 0.13mi |
| 107 Strawberry Way Rehoboth Beach, DE | 3.0 | 2.0 | 1025 | $2,750 | $2.68 | 44d | 1 | 1.41mi |
Listing history 5 events
-
2026-06-19status $34,900 Pending 3 DOM
-
2026-06-18days on market $34,900 Active 3 DOM
-
2026-06-17days on market $34,900 Active 2 DOM
-
2026-06-16remarks 699-char remark
-
2026-06-16$34,900 Active 1 DOM
ⓘ Source: listings_history table (triggers on properties + properties_extension) + one-shot
backfill from property_details.listing_events for pre-trigger history.
Tax reassessment forecast DE · Partial reset (capped growth)
- Current annual tax
- $156 · $13/mo
- Projected year-2 tax
- $179 · $15/mo
- Expected delta
- +$23/yr (+$2/mo · 14.8%)
ⓘ Screening estimate from a state-policy table — verify with the county assessor before closing.
Climate risk First Street
- Flood 6/10 Major FEMA zone X (shaded) · 70% chance over 30 yrs
- Wildfire 1/10 Low
- Heat 9/10 Extreme 7 d/yr ≥101°F today · 18 d/yr by 30 yrs out
- Wind 8/10 Severe 80% chance of damaging wind over 30 yrs
- Air quality 2/10 Low 1 unhealthy d/yr today · 1 by 30 yrs out
Nearby sold comps map
Loading sold comps map…
Walkable amenities ~0.75 mi
Loading nearby amenities…
Taxation est. · year 1
- Rental income
- $36,355
- − Mortgage interest
- −$1,955
- − Property taxes
- −$156
- − Insurance
- −$174
- − Repairs & maintenance
- −$2,908
- − Management
- −$2,908
- − Depreciation
- −$1,015
- Taxable income
- $27,238
- Est. tax owed @ 24.0%
- −$6,537
- After-tax cash flow
- $19,657/yr
For passive investors: Depreciation is non-cash, so a rental often shows a tax loss while cash-flowing — sheltering income. Rental losses are passive: they offset passive income freely, and up to $25,000/yr can offset ordinary (W-2) income if you actively participate and your MAGI is under $100k (phasing out to $0 by $150k); unused losses carry forward. On sale, claimed depreciation is recaptured at up to 25%, and gains may owe capital-gains tax (a 1031 exchange can defer both). Figures are a year-1 estimate at your 24.0% rate — not tax advice; consult a CPA.
Schools (NCES district)
- District
- Cape Henlopen School District
- NCES district ID
- 1000170
- Math proficiency
- 42% ▼ -14.00%
- Reading proficiency
- 55% ▼ -10.00%
- Median HH income
- $60,196
- Composite
- 42.47/100
- National rank
- #3214
- State rank
- #5 of 26 in DE
Livability — Rehoboth Beach
- Score
- 71/100
- State rank
- #20
- US rank
- #6520
Category grades
Schools grade is shown separately in the Schools card above.
Census & demographics
- County
- Sussex County · 82,708 people
- City population
- 14,886
- Metro
- Salisbury, MD-DE
- Population (ZIP)
- 14,886
- Household income
- $102,146
- Rent vs Own
- Severe rent burden
- 317.0
Population outlook (Sussex County) Hauer SSP2
- Today (2025)
- 248,853 people
- By 2030
- 264,464 · +6.3%
- By 2040
- 290,980 · +16.9%
- By 2050
- 311,259 · +25.1%
- By 2075
- 352,488 · +41.6%
- By 2100
- 367,406 · +47.6%
Race, ethnicity, and origin ACS 2023
- Neighborhood character
- Predominantly White (88%)
- Race & ethnicity
- White 88% Black 4% Two or more races 4% Hispanic / Latino 3% Asian 2%
- Common ancestry
- Romanian 5% Slovak 3% Italian 3%
- Foreign-born
- 6% · Canada, China
- Languages at home
- 95% English-only · Spanish 2% Russian/Polish/Slavic 1% French/Haitian/Cajun 1%
Political lean MEDSL · Sussex
- 2024 margin
- R (+11.0) · D 43.9% · R 54.9% · Other 1.2%
- 2008→2024 swing
- -2.4pp toward R · 2008: -8.6pp · 2024: -11.0pp
- All cycles
- 2024: R+11.0 2020: R+11.2 2016: R+22.0 2012: R+13.0 2008: R+8.6
Not yet ingested
- Civics
- —
Market trends
- HPI YoY
- ▼ -220.39%
- Current HPI
- 353.3977
- Rent YoY
- —
- Metro
- Salisbury, MD-DE
- State GDP YoY
- —
- F500 in state
- 0
Price history
1 event — show timeline
- 2026-06-15 Listed $34,900 BRIGHT MLS
Property tax history
-7.4%/yrLatest (2025): $156 · -53.7% YoY. Source: county tax records.
Cash-flow waterfall
monthlySold comps — $/sqft
last 12 mo · ≤1 miLoading sold comps…