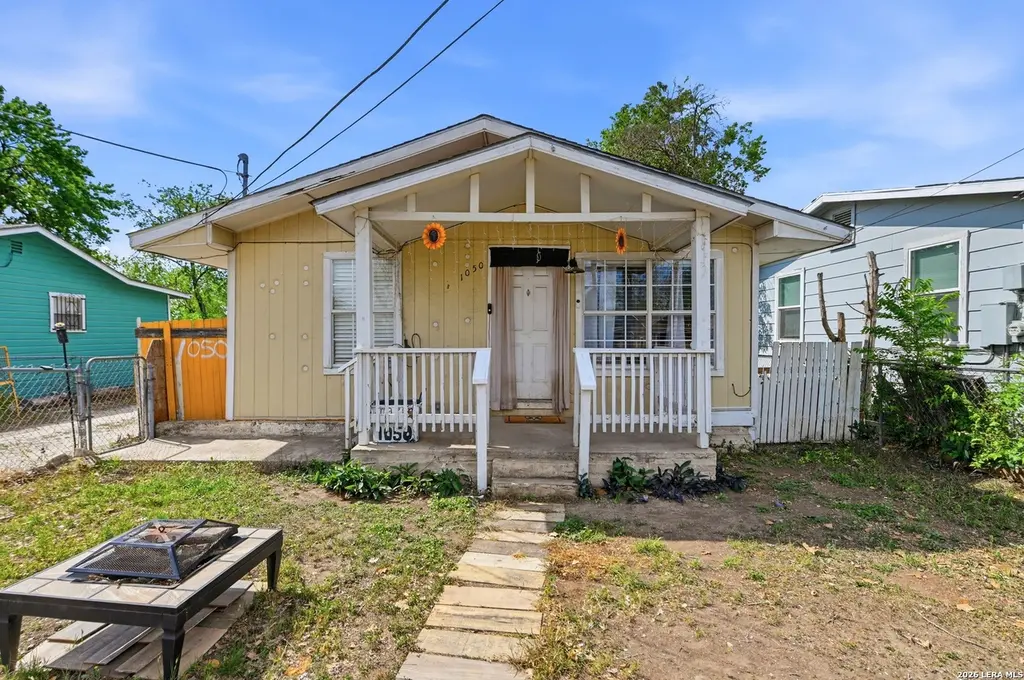
1050 Kendalia Ave · San Antonio, TX
Flood risk 1/10 · Minimal
- FEMA flood zone
- X (unshaded)
- Chance of flooding over 30 yrs
- 0.0%
- Est. flood insurance / yr
- $507 – $1,088
Fire risk 1/10 · Minimal
- Est. fire insurance / yr
- $1,222 – $2,270
Heat risk 8/10 · Major
- Hot days now (above 108°F)
- 7 days/yr
- Hot days in 30 yrs
- 22 days/yr
Wind risk 8/10 · Major
- Chance of severe wind over 30 yrs
- 80.0%
Air-quality risk 2/10 · Minimal
- Unhealthy air days now
- 1 days/yr
- Unhealthy air days in 30 yrs
- 2 days/yr
Risk factors via First Street. Map © Google.
Why this score? — see what drove the C- grade
The composite is a weighted blend of 9 inputs, each scored 0–100. Each bar is that input's sub-score; the figure is the points it added to the 100-point composite (weight × sub-score).
- Cash flow +16.2/30.0
- ARV discount +10.0/15.0
- 1% rule +6.0/10.0
- Appreciation +6.0/10.0
- DSCR +5.0/10.0
- Livability +4.0/5.0
- Condition / age +2.5/5.0
- Schools +1.9/10.0
- Rent growth +0.7/5.0
$130,000
🖨 Deal sheet 📄 Offer letter ✓ Due diligence
Listing remarks MLS
Charming and cozy 3 bed 2 bath home features new light fixtures and new ceiling fans in every bedroom. Plumbing work and foundation repair has been completed with transferable warranty. Home is prime for an investor who wants to have residual income with high rental opportunities! Huge backyard is great for entertainment.
Key facts
- 9,234 sq ft lot
- Garage
- Built 1958
Neighborhood map
What this means for you Summary
Snapshot
- This is a 3-bed/2.0-bath single-family listed at $130k.
Deal economics
- At list price, monthly cash flow is $69 ($824/yr) — positive.
- The deal already cash-flows at list — no discount required.
- Meets the 1% rule at list price ($1k rent vs $130k).
- Cap rate 6.9% vs local median 3.8% in San Antonio — top-decile yield for the area; either an underpriced asset or a hidden risk that comps aren't pricing in. Stress-test before assuming the spread holds.
Location & tenants
- Location reads 80/100 on livability (#31 in TX, #1,616 nationally) — a professional / high-income tenant draw. Strengths: amenities A+, commute A+, cost of living A+; Watch: schools C-, crime F.
- Harlandale ISD (urban): math 20% / reading 27% proficiency, ranked #748 of 826 in TX (top 91%) — low school quality limits family demand, transient renter base, plan for 1-2y turnover; 66% free/reduced lunch — lower-income household profile, screen leases tightly.
- Market conditions: Rents falling (-7.2%/yr); 369 active listings in the ZIP; 25 comparable units currently listed for rent nearby; rentals at typical pace (median 24d on market — plan ~3-4 weeks tenant-placement turnaround); 8,308 units permitted in Bexar County in 2024 (2,506 in 5+ unit buildings).
Forward outlook
- In year one you build about $4k of equity ($899 loan paydown + $3k appreciation (2.0% local appreciation)).
- Bexar County population projected at +50% by 2050 — long-run rental-demand tailwind backs the buy-and-hold thesis.
- At projected returns (2.0% appreciation + 0.0% rent growth), your $36k cash investment doubles in ~9 years — after that, you're playing with house money.
- By year 9, paydown + projected appreciation supports a ~$30k cash-out refi (75% LTV) — recoverable capital for the next deal without selling this one.
Negotiation context
- Only 1 days on market — expect competitive offers; lowballing is unlikely to land.
- 6 sale attempts since 19y ago with the ask held roughly flat each time — persistent listings suggest the price (not the market) is what's stuck; bring a comps-based counter.
Risks & watch-outs
- Watch-outs: property tax is 3.0% of price; built in 1958 — expect roof / HVAC / electrical / plumbing capex.
- Climate carrying-cost: severe wind risk, 80% chance of damaging wind over 30y; extreme-heat days projected 7→22/yr by 2055 (HVAC capex compounding) — expect insurance premiums to compound above CPI over the hold.
Questions for the listing agent
- Built in 1958 — when were the roof, HVAC, electrical panel, plumbing, and water heater last replaced?
- Property tax is high relative to price — has the assessment been appealed recently, and will the sale trigger a re-assessment?
- Is there a deadline driving the sale (1031 exchange, divorce, estate, relocation)? That informs how much negotiation room exists.
- Crime grade is F in this area — have there been break-ins, vandalism, or insurance claims at this property in the last 3 years? What carrier currently insures it and at what premium?
- What's the average days-on-market for RENTAL listings here right now (not sales)? A rising rental-DOM trend means longer vacancies and softer asking-rent achievability than the comps imply.
- What's the recent tenant-quality profile in this submarket — average credit score on applications, eviction rate, late-payment / NSF rate, and stable-employment percentage? A property-management company in the area should have these aggregated.
- How much new for-sale + rental construction is in the pipeline within 1–3 miles? Heavy new supply typically softens prices + rents 12–24 months out; constrained supply supports both.
Investment metrics
- 1% rule
- 1.10% ✓
- Cap rate
- 6.93%
- Cash-on-cash
- 2.26%
- DSCR
- 1.10
- GRM
- 7.6
CMA / ARV
- ARV (on-the-fly)
- $137,522
- Comps found
- 11
Show comp detail 11 sales within ~0.75 mi
| Address | Dist | Beds/Ba | Sqft | Sold | Price | $/sf | Match |
|---|---|---|---|---|---|---|---|
| 1043 Kendalia Ave | 0.04mi | 3/1.0 | 942 (-9%) | 11mo | $120,000 | $127 | 71 |
| 26 Vickers | 0.45mi | 3/1.0 | 1,047 (+1%) | 6mo | $169,500 | $162 | 68 |
| 1319 W Pyron Ave | 0.37mi | 3/2.0 | 1,144 (+11%) | 17mo | $135,000 | $118 | 51 |
| 10 Linden | 0.51mi | 3/1.0 | 913 (-12%) | 3mo | $97,000 | $106 | 51 |
| 927 Kendalia Ave | 0.26mi | 3/2.0 | 1,162 (+12%) | 21mo | $210,000 | $181 | 50 |
| 1419 W Harding Blvd | 0.56mi | 3/1.0 | 1,020 (-1%) | 23mo | $144,999 | $142 | 49 |
| 671 Kendalia | 0.71mi | 3/1.0 | 984 (-5%) | 9mo | $149,999 | $152 | 47 |
| 114 Halsey | 0.30mi | 2/1.0 (-1) | 902 (-13%) | 14mo | $120,000 | $133 | 44 |
| 511 Verne St | 0.69mi | 2/1.0 (-1) | 1,008 (-2%) | 18mo | $135,000 | $134 | 39 |
| 240 Escalon | 0.35mi | 2/1.0 (-1) | 1,159 (+12%) | 21mo | $98,000 | $85 | 37 |
| 1424 W Gerald Ave | 0.55mi | 2/1.0 (-1) | 1,180 (+14%) | 11mo | $98,999 | $84 | 32 |
Match score weights: distance 35% · size 25% · config 20% · recency 20%. Top-matched comps best support the ARV.
Projected returns pro-forma
2.03% appreciation · 0.0% rent growth · sell at horizon
- IRR
- 4.9%
- Equity multiple
- 1.26×
- Total profit
- $9,394
- Equity at exit
- $51,476
- IRR
- 6.7%
- Equity multiple
- 1.85×
- Total profit
- $31,057
- Equity at exit
- $74,280
Cash invested: $36,400 (down + closing). Projections, not guarantees.
Landlord ↔ Tenant lean methodology
- Overall (STATE)
- 87 Strongly Landlord-Friendly
- State Texas
- 87 Strongly Landlord-Friendly · R+5
- County
- — inherits STATE
- City
- — inherits STATE
ZIP-level market 78221
- Home prices YoY
- 0.8%
- Rents YoY
- -7.2%
- Active inventory
- 369
- Price-to-rent
- 7.6×
Monthly cashflow live
- Estimated rent
- $1,434 high interval (Pro) →
- Mortgage (P&I)
- −$682
- Tax from tax record
- −$329 /mo · $3,944/yr
- Insurance
- −$54
- HOA
- −$0
- Vacancy / Maint / Mgmt
- −$301
- Net cashflow
- $69
Break-even live
UW: 25.0% down · 7.5% · 30yr · 1.5% tax · 5.0% vac · 8.0% maint · 8.0% mgmt
Financing live
Cash to close
- Down payment
- $32,500
- Closing costs
- $3,900
- Reserves months
- —
- Total cash needed
- —
Loan-product check · same deal, 3 products live
Conventional
25% down · 7.5% · 30yr
- Down + closing
- —
- Monthly P&I
- —
- Monthly cashflow
- —
- DSCR
- —
- Eligible?
- —
Personal DTI + credit; lowest rate.
DSCR
20% down · 8.5% · 30yr
- Down + closing
- —
- Monthly P&I
- —
- Monthly cashflow
- —
- DSCR
- —
- Eligible?
- —
No personal income docs; deal must DSCR.
Hard money
10% down · 12.0% · 12mo
- Down + closing
- —
- Monthly P&I
- —
- Monthly cashflow
- —
- DSCR
- —
- Eligible?
- —
Short-term bridge; refi at stabilization.
Rent comps 25 comps
| Address | Beds | Baths | Sqft | Rent | $/sqft | DOM | Units | Dist |
|---|---|---|---|---|---|---|---|---|
| 838 McCauley Blvd San Antonio, TX | 3.0 | 2.0 | 1009 | $1,646 | $1.63 | 15d | 1 | 0.26mi |
| 422 Wagner Ave San Antonio, TX | 3.0 | 2.0 | 1220 | $1,750 | $1.43 | 43d | 1 | 0.55mi |
| 1467 W Gerald Ave San Antonio, TX | 3.0 | 2.5 | 1120 | $1,300 | $1.16 | 11d | 1 | 0.63mi |
| 620 Linden Ave Unit 2 San Antonio, TX | 2.0 | 1.0 | 733 | $1,200 | $1.64 | 43d | 1 | 0.76mi |
| 923 Whitman Ave San Antonio, TX | 4.0 | 2.0 | 1208 | $1,700 | $1.41 | 15d | 1 | 0.83mi |
| 737 W Mayfield Blvd San Antonio, TX | 3.0 | 1.0 | 1150 | $1,462 | $1.27 | 43d | 1 | 0.89mi |
| 202 McCauley Blvd San Antonio, TX | 3.0 | 2.0 | 1232 | $1,595 | $1.29 | 24d | 1 | 0.98mi |
| 830 W Hutchins Pl #11 San Antonio, TX | 3.0 | 1.0 | 800 | $1,000 | $1.25 | 43d | 1 | 1.05mi |
| 830 W Hutchins Pl #3 San Antonio, TX | 2.0 | 1.0 | 800 | $800 | $1.00 | 43d | 1 | 1.05mi |
| 1222 Brighton Ave Unit B San Antonio, TX | 3.0 | 1.0 | 725 | $999 | $1.38 | 17d | 1 | 1.06mi |
| 611 Brunswick Blvd San Antonio, TX | 3.0 | 2.0 | 1080 | $1,700 | $1.57 | 24d | 1 | 1.12mi |
| 611 Brunswick Blvd San Antonio, TX | 3.0 | 2.0 | 1080 | $1,700 | $1.57 | 15d | 1 | 1.12mi |
| 607 Brunswick Blvd San Antonio, TX | 3.0 | 2.0 | 1350 | $1,750 | $1.30 | 43d | 1 | 1.12mi |
| 535 W Hutchins Pl San Antonio, TX | 1.0–2.0 | 1.0 | 650 | $935 | $1.44 | 43d | 6 | 1.16mi |
| 102 Shrine Ave San Antonio, TX | 3.0 | 1.0 | 1262 | $1,200 | $0.95 | 22d | 1 | 1.25mi |
| 102 Shrine Ave San Antonio, TX | 3.0 | 1.0 | 1262 | $1,200 | $0.95 | 24d | 1 | 1.25mi |
| 238 W Vestal Pl San Antonio, TX | 2.0 | 1.0 | 750 | $975 | $1.30 | 24d | 1 | 1.29mi |
| 1400 Clamp Ave San Antonio, TX | 2.0 | 1.0 | 750 | $900 | $1.20 | 43d | 1 | 1.32mi |
| 1400 Clamp Ave Unit 101 San Antonio, TX | 2.0 | 1.0 | 750 | $950 | $1.27 | 43d | 1 | 1.32mi |
| 834 Division Ave San Antonio, TX | 2.0 | 1.0 | 700 | $1,050 | $1.50 | 24d | 1 | 1.35mi |
| 834 Division Ave Unit 2 San Antonio, TX | 2.0 | 1.0 | 936 | $950 | $1.01 | 4d | 1 | 1.35mi |
| 1862 Kendalia Ave San Antonio, TX | 3.0 | 1.0 | 1345 | $1,350 | $1.00 | 24d | 1 | 1.41mi |
| 138 Ware Blvd Unit 1105 San Antonio, TX | 2.0 | 1.5 | 768 | $950 | $1.24 | 20d | 1 | 1.42mi |
| 326 Stonewall St San Antonio, TX | 3.0 | 1.0 | 1080 | $1,200 | $1.11 | 24d | 1 | 1.47mi |
| 503 W Hart Ave San Antonio, TX | 3.0 | 1.0 | 1232 | $1,750 | $1.42 | 11d | 1 | 1.48mi |
Listing history 20 events
-
2026-04-12status Pending
-
2026-04-12Active Option
-
2026-04-11$130,000
-
2017-12-20soldstatus
-
2017-12-19status Pending 326-char remark
Show marketing remark (326 chars)
Charming and cozy 3 bed 2 bath home features new light fixtures and new ceiling fans in every bedroom. Plumbing work and foundation repair has been completed with transferable warranty. Home is prime for an investor who wants to have residual income with high rental opportunities! Huge backyard is great for entertainment.
-
2017-12-19soldstatus Sold 326-char remark
Show marketing remark (326 chars)
Charming and cozy 3 bed 2 bath home features new light fixtures and new ceiling fans in every bedroom. Plumbing work and foundation repair has been completed with transferable warranty. Home is prime for an investor who wants to have residual income with high rental opportunities! Huge backyard is great for entertainment.
-
2017-11-13historical Active Option 326-char remark
Show marketing remark (326 chars)
Charming and cozy 3 bed 2 bath home features new light fixtures and new ceiling fans in every bedroom. Plumbing work and foundation repair has been completed with transferable warranty. Home is prime for an investor who wants to have residual income with high rental opportunities! Huge backyard is great for entertainment.
-
2017-11-11$110,000 New 326-char remark
Show marketing remark (326 chars)
Charming and cozy 3 bed 2 bath home features new light fixtures and new ceiling fans in every bedroom. Plumbing work and foundation repair has been completed with transferable warranty. Home is prime for an investor who wants to have residual income with high rental opportunities! Huge backyard is great for entertainment.
-
2017-10-07historical
-
2017-08-06$110,000 New
-
2017-07-14soldstatus
-
2017-07-12soldstatus Sold
-
2017-07-01status Pending
-
2017-06-24historical Active Option
-
2017-06-21$75,000 New
-
2007-09-21soldstatus
-
2007-09-19soldstatus
-
2007-04-30$77,900
-
2006-11-15soldstatus
-
2002-02-28soldstatus
ⓘ Source: listings_history table (triggers on properties + properties_extension) + one-shot
backfill from property_details.listing_events for pre-trigger history.
Tax reassessment forecast TX · Resets to sale price
- Current annual tax
- $3,944 · $329/mo
- Projected year-2 tax
- $3,944 · $329/mo
- Expected delta
- $0/yr ($0/mo · 0.0%)
ⓘ Screening estimate from a state-policy table — verify with the county assessor before closing.
Climate risk First Street
- Flood 1/10 Low FEMA zone X (unshaded) · 0% chance over 30 yrs
- Wildfire 1/10 Low
- Heat 8/10 Severe 7 d/yr ≥108°F today · 22 d/yr by 30 yrs out
- Wind 8/10 Severe 80% chance of damaging wind over 30 yrs
- Air quality 2/10 Low 1 unhealthy d/yr today · 2 by 30 yrs out
Nearby sold comps map
Loading sold comps map…
Walkable amenities ~0.75 mi
Loading nearby amenities…
Taxation est. · year 1
- Rental income
- $17,213
- − Mortgage interest
- −$7,282
- − Property taxes
- −$3,944
- − Insurance
- −$650
- − Repairs & maintenance
- −$1,377
- − Management
- −$1,377
- − Depreciation
- −$3,782
- Taxable loss
- −$1,198
- Est. tax savings @ 24.0%
- +$288
- After-tax cash flow
- $1,112/yr
For passive investors: Depreciation is non-cash, so a rental often shows a tax loss while cash-flowing — sheltering income. Rental losses are passive: they offset passive income freely, and up to $25,000/yr can offset ordinary (W-2) income if you actively participate and your MAGI is under $100k (phasing out to $0 by $150k); unused losses carry forward. On sale, claimed depreciation is recaptured at up to 25%, and gains may owe capital-gains tax (a 1031 exchange can defer both). Figures are a year-1 estimate at your 24.0% rate — not tax advice; consult a CPA.
Schools (NCES district)
- District
- Harlandale ISD
- NCES district ID
- 4822470
- Math proficiency
- 20% ▼ -22.00%
- Reading proficiency
- 27% ▼ -9.00%
- Median HH income
- $33,850
- Composite
- 19.25/100
- National rank
- #8806
- State rank
- #748 of 826 in TX
Livability — San Antonio
- Score
- 80/100
- State rank
- #31
- US rank
- #1616
Category grades
Schools grade is shown separately in the Schools card above.
Census & demographics
- Census place
- San Antonio, TX
- County
- Bexar County · 1,990,555 people
- City population
- 1,806,925
- Metro
- San Antonio-New Braunfels, TX
- Population (ZIP)
- 42,178
- Household income
- $63,811
- Rent vs Own
- Severe rent burden
- 1180.0
Population outlook (Bexar County) Hauer SSP2
- Today (2025)
- 2,336,851 people
- By 2030
- 2,560,728 · +9.6%
- By 2040
- 3,020,569 · +29.3%
- By 2050
- 3,493,522 · +49.5%
- By 2075
- 4,668,459 · +99.8%
- By 2100
- 5,533,242 · +136.8%
Race, ethnicity, and origin ACS 2023
- Neighborhood character
- Predominantly Hispanic (89%)
- Race & ethnicity
- Hispanic / Latino 89% Two or more races 28% White 9% Native American 2%
- Hispanic origin (detail)
- Mexican 74%
- Common ancestry
- Lithuanian 1% Romanian 1%
- Foreign-born
- 16% · Canada
- Languages at home
- 45% English-only · Spanish 54%
Political lean MEDSL · Bexar
- 2024 margin
- Lean D (+9.8) · D 54.3% · R 44.6% · Other 1.1%
- 2008→2024 swing
- +4.2pp toward D · 2008: 5.6pp · 2024: 9.8pp
- All cycles
- 2024: D+9.8 2020: D+18.2 2016: D+13.5 2012: D+4.6 2008: D+5.6
Not yet ingested
- Civics
- —
Market trends
- HPI YoY
- ▲ 2.03%
- Current HPI
- 251.1635
- Rent YoY
- ▼ -7.21%
- Metro
- San Antonio-New Braunfels, TX
- State GDP YoY
- ▲ 3.95%
- F500 in state
- 110
Industry mix (Fortune 500 HQ in TX)
| Industry | F500 HQs | Revenue |
|---|---|---|
| Energy | 16 | $1,198B |
|
||
| Technology | 5 | $198B |
|
||
| Engineering / Construction | 4 | $72B |
|
||
| Energy Services | 3 | $60B |
|
||
| Utilities | 3 | $41B |
|
||
| Healthcare | 2 | $330B |
|
||
Price history
+66.9% since first listed20 events — show timeline
- 2026-04-12 Pending — LERA
- 2026-04-12 Listed — LERA
- 2026-04-11 Listed $130,000 LERA
- 2017-12-20 Sold (Public Records) — Public Records
- 2017-12-19 Pending — LERA
- 2017-12-19 Sold (MLS) — LERA
- 2017-11-13 Contingent — LERA
- 2017-11-11 Listed $110,000 LERA
- 2017-10-07 Listing Removed — LERA
- 2017-08-06 Listed $110,000 LERA
- 2017-07-14 Sold (Public Records) — Public Records
- 2017-07-12 Sold (MLS) — LERA
- 2017-07-01 Pending — LERA
- 2017-06-24 Contingent — LERA
- 2017-06-21 Listed $75,000 LERA
- 2007-09-21 Sold (Public Records) — Public Records
- 2007-09-19 Sold (MLS) — LERA
- 2007-04-30 Listed $77,900 LERA
- 2006-11-15 Sold (Public Records) — Public Records
- 2002-02-28 Sold (Public Records) — Public Records
Property tax history
+6.8%/yrLatest (2025): $3,944 · -0.6% YoY. Source: county tax records.
Cash-flow waterfall
monthlySold comps — $/sqft
last 12 mo · ≤1 miLoading sold comps…