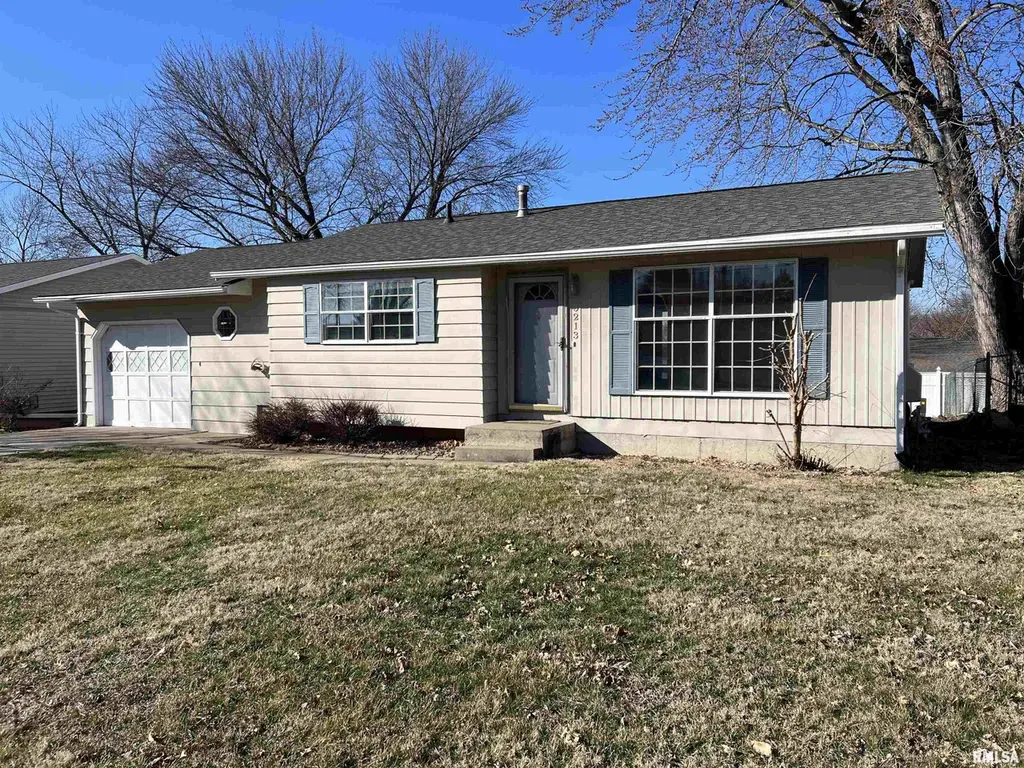
3213 Harrison St · Quincy, IL
Flood risk 1/10 · Minimal
- FEMA flood zone
- X (unshaded)
- Chance of flooding over 30 yrs
- 0.0%
- Est. flood insurance / yr
- $473 – $860
Fire risk 1/10 · Minimal
- Est. fire insurance / yr
- $804 – $1,492
Heat risk 3/10 · Minor
- Hot days now (above 106°F)
- 7 days/yr
- Hot days in 30 yrs
- 17 days/yr
Wind risk 2/10 · Minimal
- Chance of severe wind over 30 yrs
- —
Air-quality risk 2/10 · Minimal
- Unhealthy air days now
- 1 days/yr
- Unhealthy air days in 30 yrs
- 1 days/yr
Risk factors via First Street. Map © Google.
Why this score? — see what drove the D+ grade
The composite is a weighted blend of 9 inputs, each scored 0–100. Each bar is that input's sub-score; the figure is the points it added to the 100-point composite (weight × sub-score).
- ARV discount +15.0/15.0
- Cash flow +13.6/30.0
- Rent growth +5.0/5.0
- 1% rule +4.1/10.0
- DSCR +4.1/10.0
- Livability +3.4/5.0
- Condition / age +2.5/5.0
- Schools +2.2/10.0
- Appreciation +0.0/10.0
$146,000
🖨 Deal sheet 📄 Offer letter ✓ Due diligence
Listing remarks MLS
Move right in. Beautiful kitchen with glass back splash, the darker cabinetry and all stainless steel appliances. The office on the main level with sliding doors to deck could be converted back to 3rd bedroom. Finished lower level with bar and "other" room in basement is being used as bedroom. 2016 new roof & gutters. New blue tooth garage door opener. Some newer flooring. Some rooms have been freshly painted. Garage has a 12 x 16 workshop. This home is a must see.
Key facts
- Darker cabinetry
- Steel appliances
- Office on main level
Tags
Property features AI
Exterior
- Parking: Attached garage with 1 parking space
- Utilities: Public water; Public sewer
- Home design: Single family residence; Residential zoning; Built in 1971
- Construction: Not new construction
- Exterior features: Other roof; Lot features: other; Lot dimensions approximately 61 x 99; Finished full basement
Interior
- Kitchen: Dishwasher; Microwave; Refrigerator
- Bedrooms: 3 bedrooms (bedrooms located on main level)
- Flooring: Laminate flooring in bedrooms, living areas, and basement bonus rooms; Tile flooring in kitchen
- Bathrooms: 1 full bathroom
- Heating & cooling: Central air; Forced air heating; Gas water heater
- Interior features: Ceiling fan(s)
Neighborhood map
What this means for you Summary
Snapshot
- This is a 3-bed/1.0-bath single-family listed at $146k.
Deal economics
- At list price, monthly cash flow is $7 ($88/yr) — positive.
- The deal already cash-flows at list — no discount required.
- To meet the 1% rule (rent ≥ 1% of price), the offer needs to be $133k (9.1% below list).
- Recommended offer: $133k (9.1% below list) — sets the bar for 1% rule.
- Cap rate 6.4% vs local median 4.3% in Quincy — top-decile yield for the area; either an underpriced asset or a hidden risk that comps aren't pricing in. Stress-test before assuming the spread holds.
Location & tenants
- Location reads 67/100 on livability (#506 in IL) — a middle-class / working-renter tenant base. Strengths: cost of living A+, housing A+; Watch: crime D, employment D, amenities D-.
- Quincy SD 172 (town): math 24% / reading 27% proficiency, ranked #328 of 620 in IL (top 53%) — low school quality limits family demand, transient renter base, plan for 1-2y turnover.
- Zoned schools: Lincoln-Douglas Elementary School (math 30% / reading 25%, grade F, #742 of 2,056 statewide, top 36%, 588 students, 0% FRL); Quincy Jr High School (math 25% / reading 30%, grade F, #295 of 665 statewide, top 45%, 1,348 students, 0% FRL); Quincy Sr High School (math 21% / reading 28%, grade F, #256 of 693 statewide, top 44%, 1,924 students, 0% FRL) — zoned schools average 0% FRL vs 48% district-wide (48 pts lower); this property's tenant base skews higher-income than the district average.
- Market conditions: Rents rising fast (+10.8%/yr); 180 active listings in the ZIP; 68 units permitted in Adams County in 2024 (0 in 5+ unit buildings).
- This rent runs 31% of the median local income ($52k/yr) — at the standard rent-burdened threshold; future hikes will face affordability resistance.
Forward outlook
- Local home prices are declining (-3.0%/yr); year-one equity from $1k of loan paydown is wiped out by about $4k of value loss. Plan a longer hold.
- Adams County population projected at -14% by 2050 — secular population decline; favor cash flow + early exit over multi-decade hold.
Negotiation context
- It's been on market 44 days — a 3% lower offer ($142k) is reasonable based on typical stale-listing flexibility.
- 8 sale attempts since 16y ago with the ask held roughly flat each time — persistent listings suggest the price (not the market) is what's stuck; bring a comps-based counter.
- Current owner paid $105k; 39% above their basis — modest negotiation headroom, anchor on the comps not their cost.
Questions for the listing agent
- It's been on market 44 days. Have you received any prior offers? Is the seller open to a 9% concession, seller financing, or rate buy-down credit?
- Built in 1971 — when were the roof, HVAC, electrical panel, plumbing, and water heater last replaced?
- Is there a deadline driving the sale (1031 exchange, divorce, estate, relocation)? That informs how much negotiation room exists.
- Schools are D-rated, which usually means shorter tenancies and higher turnover. Who's the typical renter profile here, and what's been the actual vacancy rate?
- Crime grade is D in this area — have there been break-ins, vandalism, or insurance claims at this property in the last 3 years? What carrier currently insures it and at what premium?
- The area grade is low — what's the realistic commute time and amenity access for the typical tenant pool here? Any planned neighborhood developments (good or bad) we should know about?
- What's the average days-on-market for RENTAL listings here right now (not sales)? A rising rental-DOM trend means longer vacancies and softer asking-rent achievability than the comps imply.
- What's the recent tenant-quality profile in this submarket — average credit score on applications, eviction rate, late-payment / NSF rate, and stable-employment percentage? A property-management company in the area should have these aggregated.
- How much new for-sale + rental construction is in the pipeline within 1–3 miles? Heavy new supply typically softens prices + rents 12–24 months out; constrained supply supports both.
Investment metrics
- 1% rule
- 0.91% ✗
- Cap rate
- 6.35%
- Cash-on-cash
- 0.22%
- DSCR
- 1.01
- GRM
- 9.2
CMA / ARV
- ARV (median comp)
- $242,595
- List price
- $146,000
- Delta
- -39.82%
- Verdict
- UNDERPRICED
- Comps
- 20 within 1.0 mi
Show comp detail 12 sales within ~0.75 mi
| Address | Dist | Beds/Ba | Sqft | Sold | Price | $/sf | Match |
|---|---|---|---|---|---|---|---|
| 1531 S 28th St | 0.41mi | 3/2.0 | 1,653 (+0%) | 5mo | $337,000 | $204 | 72 |
| 2905 Harrison St | 0.31mi | 3/2.5 | 1,668 (+2%) | 8mo | $226,500 | $136 | 70 |
| 3124 Fox Run East | 0.07mi | 3/1.5 | 1,502 (-9%) | 15mo | $168,000 | $112 | 68 |
| 740 Edgewood Dr | 0.60mi | 3/2.0 | 1,642 (-0%) | 1mo | $230,000 | $140 | 67 |
| 1122 Stone Crest Villa Dr | 0.38mi | 2/3.0 (-1) | 1,540 (-6%) | 1mo | $351,000 | $228 | 58 |
| 728 Ridgewood Dr | 0.62mi | 3/2.0 | 1,663 (+1%) | 13mo | $212,000 | $127 | 54 |
| 1246 Curtis Creek Rd | 0.51mi | 3/2.0 | 1,730 (+5%) | 11mo | $220,735 | $128 | 54 |
| 1629 Curtis Creek Rd | 0.61mi | 3/3.0 | 1,740 (+6%) | 7mo | $170,000 | $98 | 48 |
| 3508 Courts of Westview St | 0.16mi | 2/2.0 (-1) | 1,479 (-10%) | 23mo | $259,000 | $175 | 48 |
| 732 Edgewood Dr | 0.61mi | 3/1.5 | 1,770 (+8%) | 13mo | $135,000 | $76 | 46 |
| 1126 S 26th St | 0.64mi | 3/2.5 | 1,708 (+4%) | 15mo | $292,000 | $171 | 45 |
| 1210 Harrison Plz | 0.67mi | 4/3.5 (+1) | 1,800 (+10%) | 13mo | $435,000 | $242 | 27 |
Match score weights: distance 35% · size 25% · config 20% · recency 20%. Top-matched comps best support the ARV.
Projected returns pro-forma
-3.0% appreciation · 8.0% rent growth · sell at horizon
- IRR
- -10.3%
- Equity multiple
- 0.61×
- Total profit
- $-16,133
- Equity at exit
- $21,769
- IRR
- 5.0%
- Equity multiple
- 1.46×
- Total profit
- $18,656
- Equity at exit
- $12,623
Cash invested: $40,880 (down + closing). Projections, not guarantees.
Landlord ↔ Tenant lean methodology
- Overall (STATE)
- 43 Moderately Tenant-Leaning
- State Illinois
- 43 Moderately Tenant-Leaning · D+7
- County
- — inherits STATE
- City
- — inherits STATE
ZIP-level market 62301
- Rents YoY
- 10.8%
- Active inventory
- 180
- Price-to-rent
- 9.2×
Monthly cashflow live
- Estimated rent
- $1,328 medium interval (Pro) →
- Mortgage (P&I)
- −$766
- Tax from tax record
- −$215 /mo · $2,581/yr
- Insurance
- −$61
- HOA
- −$0
- Vacancy / Maint / Mgmt
- −$279
- Net cashflow
- $7
Break-even live
UW: 25.0% down · 7.5% · 30yr · 1.5% tax · 5.0% vac · 8.0% maint · 8.0% mgmt
Financing live
Cash to close
- Down payment
- $36,500
- Closing costs
- $4,380
- Reserves months
- —
- Total cash needed
- —
Loan-product check · same deal, 3 products live
Conventional
25% down · 7.5% · 30yr
- Down + closing
- —
- Monthly P&I
- —
- Monthly cashflow
- —
- DSCR
- —
- Eligible?
- —
Personal DTI + credit; lowest rate.
DSCR
20% down · 8.5% · 30yr
- Down + closing
- —
- Monthly P&I
- —
- Monthly cashflow
- —
- DSCR
- —
- Eligible?
- —
No personal income docs; deal must DSCR.
Hard money
10% down · 12.0% · 12mo
- Down + closing
- —
- Monthly P&I
- —
- Monthly cashflow
- —
- DSCR
- —
- Eligible?
- —
Short-term bridge; refi at stabilization.
Listing history 36 events
-
2026-06-19days on market $146,000 Under Contract 44 DOM
-
2026-06-18days on market $146,000 Under Contract 43 DOM
-
2026-06-17days on market $146,000 Under Contract 42 DOM
-
2026-06-16days on market $146,000 Under Contract 41 DOM
-
2026-06-15days on market $146,000 Under Contract 40 DOM
-
2026-06-14days on market $146,000 Under Contract 38 DOM
-
2026-06-12days on market $146,000 Under Contract 37 DOM
-
2026-06-09days on market $146,000 Under Contract 34 DOM
-
2026-06-08days on market $146,000 Under Contract 33 DOM
-
2026-06-07days on market $146,000 Under Contract 32 DOM
-
2026-06-03days on market $146,000 Under Contract 28 DOM
-
2026-06-02days on market $146,000 Under Contract 27 DOM
-
2026-06-01days on market $146,000 Under Contract 26 DOM
-
2026-05-31days on market $146,000 Under Contract 25 DOM
-
2026-05-30days on market $146,000 Under Contract 24 DOM
-
2026-05-14historical Under Contract 324-char remark
-
2026-05-04$146,000 Active 324-char remark
-
2022-09-27historical
-
2020-01-31soldstatus $105,000
Show marketing remark (483 chars)
Move right in. Beautiful kitchen with glass back splash, the darker cabinetry and all stainless steel appliances. The office on the main level with sliding doors to deck could be converted back to 3rd bedroom. Finished lower level with bar and "other" room in basement is being used as bedroom. 2016 new roof & gutters. New blue tooth garage door opener. Some newer flooring. Some rooms have been freshly painted. Garage has a 12 x 16 workshop. This home is a must see.
-
2019-11-05$105,000
Show marketing remark (483 chars)
Move right in. Beautiful kitchen with glass back splash, the darker cabinetry and all stainless steel appliances. The office on the main level with sliding doors to deck could be converted back to 3rd bedroom. Finished lower level with bar and "other" room in basement is being used as bedroom. 2016 new roof & gutters. New blue tooth garage door opener. Some newer flooring. Some rooms have been freshly painted. Garage has a 12 x 16 workshop. This home is a must see.
-
2015-05-26soldstatus $99,000
-
2012-12-12historical
-
2012-07-02soldstatus $105,000
-
2012-06-29soldstatus $105,000
-
2012-06-29soldstatus $105,000
-
2012-04-17$109,900
-
2012-04-17$109,900
-
2010-07-16soldstatus $77,000
-
2010-07-16soldstatus $77,000
-
2010-07-01soldstatus $77,000
-
2010-06-09$79,900
-
2010-06-09$79,900
ⓘ Source: listings_history table (triggers on properties + properties_extension) + one-shot
backfill from property_details.listing_events for pre-trigger history.
Tax reassessment forecast IL · Partial reset (capped growth)
- Current annual tax
- $2,581 · $215/mo
- Projected year-2 tax
- $2,948 · $246/mo
- Expected delta
- +$366/yr (+$31/mo · 14.2%)
ⓘ Screening estimate from a state-policy table — verify with the county assessor before closing.
Climate risk First Street
- Flood 1/10 Low FEMA zone X (unshaded) · 0% chance over 30 yrs
- Wildfire 1/10 Low
- Heat 3/10 Moderate 7 d/yr ≥106°F today · 17 d/yr by 30 yrs out
- Wind 2/10 Low
- Air quality 2/10 Low 1 unhealthy d/yr today · 1 by 30 yrs out
Nearby sold comps map
Loading sold comps map…
Walkable amenities ~0.75 mi
Loading nearby amenities…
Taxation est. · year 1
- Rental income
- $15,933
- − Mortgage interest
- −$8,178
- − Property taxes
- −$2,581
- − Insurance
- −$730
- − Repairs & maintenance
- −$1,275
- − Management
- −$1,275
- − Depreciation
- −$4,247
- Taxable loss
- −$2,353
- Est. tax savings @ 24.0%
- +$565
- After-tax cash flow
- $653/yr
For passive investors: Depreciation is non-cash, so a rental often shows a tax loss while cash-flowing — sheltering income. Rental losses are passive: they offset passive income freely, and up to $25,000/yr can offset ordinary (W-2) income if you actively participate and your MAGI is under $100k (phasing out to $0 by $150k); unused losses carry forward. On sale, claimed depreciation is recaptured at up to 25%, and gains may owe capital-gains tax (a 1031 exchange can defer both). Figures are a year-1 estimate at your 24.0% rate — not tax advice; consult a CPA.
Schools (NCES district)
- District
- Quincy SD 172
- NCES district ID
- 1733000
- Math proficiency
- 24% ▬ 0.00%
- Reading proficiency
- 27% ▬ 0.00%
- Median HH income
- $44,132
- Composite
- 21.91/100
- National rank
- #8229
- State rank
- #328 of 620 in IL
Livability — Quincy
- Score
- 67/100
- State rank
- #506
- US rank
- #10458
Category grades
Schools grade is shown separately in the Schools card above.
Census & demographics
- Census place
- Quincy, IL
- County
- Adams County · 30,746 people
- City population
- 30,746
- Metro
- Quincy, IL-MO
- Population (ZIP)
- 30,746
- Household income
- $52,055
- Rent vs Own
- Severe rent burden
- 1238.0
Population outlook (Adams County) Hauer SSP2
- Today (2025)
- 65,795 people
- By 2030
- 64,436 · -2.1%
- By 2040
- 61,007 · -7.3%
- By 2050
- 56,851 · -13.6%
- By 2075
- 46,424 · -29.4%
- By 2100
- 34,305 · -47.9%
Race, ethnicity, and origin ACS 2023
- Neighborhood character
- Predominantly White (84%)
- Race & ethnicity
- White 84% Two or more races 7% Black 6% Hispanic / Latino 3% Asian 1%
- Common ancestry
- Slovak 2% Iranian 1% Lithuanian 1%
- Foreign-born
- 2% · Canada
- Languages at home
- 96% English-only · Spanish 2%
Political lean MEDSL · Adams
- 2024 margin
- Solid R (+47.4) · D 25.6% · R 73.0% · Other 1.5%
- 2008→2024 swing
- -25.0pp toward R · 2008: -22.4pp · 2024: -47.4pp
- All cycles
- 2024: R+47.4 2020: R+46.5 2016: R+47.5 2012: R+35.2 2008: R+22.4
Not yet ingested
- Civics
- —
Market trends
- HPI YoY
- ▼ -121.44%
- Current HPI
- 131.7344
- Rent YoY
- ▲ 10.78%
- Metro
- Quincy, IL-MO
- State GDP YoY
- ▲ 1.59%
- F500 in state
- 60
Industry mix (Fortune 500 HQ in IL)
| Industry | F500 HQs | Revenue |
|---|---|---|
| Insurance | 4 | $201B |
|
||
| Consumer Goods | 4 | $87B |
|
||
| Industrial Machinery | 3 | $64B |
|
||
| Healthcare | 2 | $55B |
|
||
| Retail / Pharmacy | 1 | $148B |
|
||
| Agriculture / Food | 1 | $86B |
|
||
Price history
+82.7% since first listed21 events — show timeline
- 2026-05-14 Contingent — RMLSA as Distributed by MLS Grid
- 2026-05-04 Listed $146,000 RMLSA as Distributed by MLS Grid
- 2022-09-27 Listing Removed — RMLSA as Distributed by MLS Grid
- 2020-01-31 Sold (MLS) $105,000 Quincy AOR
- 2020-01-31 Sold (MLS) $105,000 MRED as Distributed by MLS Grid
- 2020-01-31 Sold (MLS) $105,000 RMLSA as Distributed by MLS Grid
- 2019-11-05 Listed $105,000 Quincy AOR
- 2019-11-05 Listed $105,000 MRED as Distributed by MLS Grid
- 2019-11-05 Listed $105,000 RMLSA as Distributed by MLS Grid
- 2015-05-26 Sold (Public Records) $99,000 Public Records
- 2012-12-12 Listing Removed — MRED as Distributed by MLS Grid
- 2012-07-02 Sold (Public Records) $105,000 Public Records
- 2012-06-29 Sold (MLS) $105,000 RMLSA as Distributed by MLS Grid
- 2012-06-29 Sold (MLS) $105,000 MRED as Distributed by MLS Grid
- 2012-04-17 Listed $109,900 RMLSA as Distributed by MLS Grid
- 2012-04-17 Listed $109,900 MRED as Distributed by MLS Grid
- 2010-07-16 Sold (MLS) $77,000 MRED as Distributed by MLS Grid
- 2010-07-16 Sold (MLS) $77,000 RMLSA as Distributed by MLS Grid
- 2010-07-01 Sold (Public Records) $77,000 Public Records
- 2010-06-09 Listed $79,900 MRED as Distributed by MLS Grid
- 2010-06-09 Listed $79,900 RMLSA as Distributed by MLS Grid
Property tax history
+2.7%/yrLatest (2023): $2,581 · +5.7% YoY. Source: county tax records.
Cash-flow waterfall
monthlySold comps — $/sqft
last 12 mo · ≤1 miLoading sold comps…