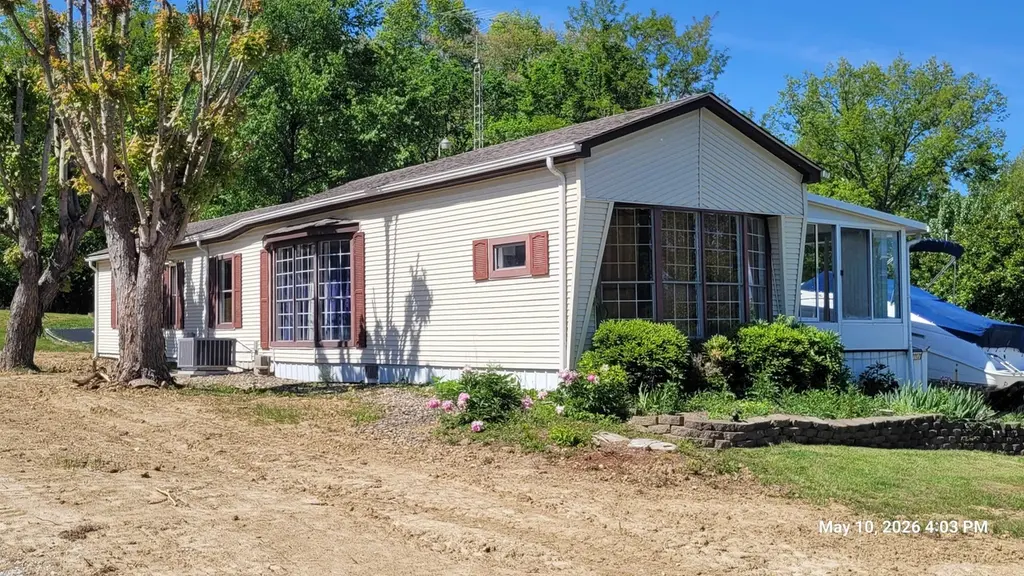
11131 Locust St · Lakeshore Resort, IN
Flood risk 1/10 · Minimal
- FEMA flood zone
- X (unshaded)
- Chance of flooding over 30 yrs
- 0.0%
- Est. flood insurance / yr
- $507 – $1,088
Fire risk 1/10 · Minimal
- Est. fire insurance / yr
- $717 – $1,331
Heat risk 3/10 · Minor
- Hot days now (above 102°F)
- 7 days/yr
- Hot days in 30 yrs
- 19 days/yr
Wind risk 2/10 · Minimal
- Chance of severe wind over 30 yrs
- 1.0%
Air-quality risk 2/10 · Minimal
- Unhealthy air days now
- 0 days/yr
- Unhealthy air days in 30 yrs
- 1 days/yr
Risk factors via First Street. Map © Google.
Why this score? — see what drove the B+ grade
The composite is a weighted blend of 9 inputs, each scored 0–100. Each bar is that input's sub-score; the figure is the points it added to the 100-point composite (weight × sub-score).
- Cash flow +30.0/30.0
- ARV discount +15.0/15.0
- DSCR +10.0/10.0
- 1% rule +9.1/10.0
- Schools +5.0/10.0
- Rent growth +2.5/5.0
- Livability +2.5/5.0
- Condition / age +2.5/5.0
- Appreciation +0.0/10.0
$71,900
🖨 Deal sheet 📄 Offer letter ✓ Due diligence
Listing remarks MLS
Refreshed Vacation Paradise! 1/4 mile from the Brookville Lake causeway. Close to the Causeway boat docks. The extra lot allows for convenient boat storage. New paint and flooring throughout. Also new HVAC & septic holding tank. You'll love relaxing in the large, enclosed porch on those rainy days! This 2-bedroom, 2 bath resort home offers full time comfort for your family and guests. Weekend or longer term lake retreat living at it's finest! * Assoc. Dues are $350 per lot and already paid for 2026. Lake Shore Resort Bylaws, Rules and Covenants can be found at https://lakeshoreresort. us/rules-and-covenants/ ______ Legal desc: Parcel #24-04-20-377-118.000-007 - Parcel #24-05-20-377-119.000-007
Key facts
- Garage
- Built 1978
- Listed 38 days
Property features AI
Exterior
- Parking: Detached garage with 1 parking space; Garage door opener; Concrete and gravel surfaces
- Home design: Single-family residence; Residential property
- Construction: Vinyl siding
- Exterior features: Storm door(s); Shed(s); Rolling slope lot
Interior
- Kitchen: Microwave; Range; Refrigerator
- Bathrooms: 2 full bathrooms
- Heating & cooling: Central air conditioning; Forced air heating
- Interior features: Microwave; Range; Refrigerator; Electric water heater; 4 total rooms
- Laundry & utility: Electric water heater
Neighborhood map
What this means for you Summary
Snapshot
- This is a 3-bed/1.0-bath single-family listed at $72k.
Deal economics
- At list price, monthly cash flow is $344 ($4k/yr) — positive.
- The deal already cash-flows at list — no discount required.
- Meets the 1% rule at list price ($1k rent vs $72k).
- Recommended offer: $70k (3.0% below list) — sets the bar for market timing.
Location & tenants
- Location reads: area grade B — affects rentability + tenant quality, not the cash-flow math above.
- Market conditions: 4 active listings in the ZIP; 58 units permitted in Franklin County in 2024 (0 in 5+ unit buildings).
Forward outlook
- Local home prices are declining (-3.0%/yr); year-one equity from $497 of loan paydown is wiped out by about $2k of value loss. Plan a longer hold.
- Franklin County population projected to shrink 10% by 2050 — rents likely to lag national; underwrite the cash flow, not the appreciation.
- At projected returns (-3.0% appreciation + 3.0% rent growth), your $20k cash investment doubles in ~6 years — after that, you're playing with house money.
Negotiation context
- It's been on market 38 days — a 3% lower offer ($70k) is reasonable based on typical stale-listing flexibility.
- 2 sale attempts with the ask held roughly flat each time — persistent listings suggest the price (not the market) is what's stuck; bring a comps-based counter.
Questions for the listing agent
- It's been on market 38 days. Have you received any prior offers? Is the seller open to a 3% concession, seller financing, or rate buy-down credit?
- Built in 1978 — when were the roof, HVAC, electrical panel, plumbing, and water heater last replaced?
- Is there a deadline driving the sale (1031 exchange, divorce, estate, relocation)? That informs how much negotiation room exists.
- What's the average days-on-market for RENTAL listings here right now (not sales)? A rising rental-DOM trend means longer vacancies and softer asking-rent achievability than the comps imply.
- What's the recent tenant-quality profile in this submarket — average credit score on applications, eviction rate, late-payment / NSF rate, and stable-employment percentage? A property-management company in the area should have these aggregated.
- How much new for-sale + rental construction is in the pipeline within 1–3 miles? Heavy new supply typically softens prices + rents 12–24 months out; constrained supply supports both.
Investment metrics
- 1% rule
- 1.41% ✓
- Cap rate
- 12.04%
- Cash-on-cash
- 20.53%
- DSCR
- 1.91
- GRM
- 5.9
CMA / ARV
- ARV (median comp)
- $87,072
- List price
- $71,900
- Delta
- -17.42%
- Verdict
- UNDERPRICED
- Comps
- 6 within 1.0 mi
Show comp detail 3 sales within ~0.75 mi
| Address | Dist | Beds/Ba | Sqft | Sold | Price | $/sf | Match |
|---|---|---|---|---|---|---|---|
| 11117 Red Bud Ln | 0.06mi | 2/1.0 (-1) | 938 (-6%) | 0mo | $67,000 | $71 | 82 |
| 11118 Cedar St | 0.11mi | 3/1.0 | 920 (-7%) | 7mo | $204,000 | $222 | 76 |
| 15047 Wren St | 0.65mi | 2/2.0 (-1) | 1,125 (+13%) | 10mo | $95,000 | $84 | 31 |
Match score weights: distance 35% · size 25% · config 20% · recency 20%. Top-matched comps best support the ARV.
Projected returns pro-forma
-3.0% appreciation · 3.0% rent growth · sell at horizon
- IRR
- 12.8%
- Equity multiple
- 1.51×
- Total profit
- $10,278
- Equity at exit
- $10,721
- IRR
- 21.7%
- Equity multiple
- 2.85×
- Total profit
- $37,156
- Equity at exit
- $6,217
Cash invested: $20,132 (down + closing). Projections, not guarantees.
Landlord ↔ Tenant lean methodology
- Overall (STATE)
- 90 Strongly Landlord-Friendly
- State Indiana
- 90 Strongly Landlord-Friendly · R+11
- County
- — inherits STATE
- City
- — inherits STATE
ZIP-level market 47012
- Home prices YoY
- -27.1%
- Active inventory
- 4
- Price-to-rent
- 5.9×
Monthly cashflow live
- Estimated rent
- $1,010 medium interval (Pro) →
- Mortgage (P&I)
- −$377
- Tax from tax record
- −$47 /mo · $562/yr
- Insurance
- −$30
- HOA
- −$0
- Vacancy / Maint / Mgmt
- −$212
- Net cashflow
- $344
Break-even live
UW: 25.0% down · 7.5% · 30yr · 1.5% tax · 5.0% vac · 8.0% maint · 8.0% mgmt
Financing live
Cash to close
- Down payment
- $17,975
- Closing costs
- $2,157
- Reserves months
- —
- Total cash needed
- —
Loan-product check · same deal, 3 products live
Conventional
25% down · 7.5% · 30yr
- Down + closing
- —
- Monthly P&I
- —
- Monthly cashflow
- —
- DSCR
- —
- Eligible?
- —
Personal DTI + credit; lowest rate.
DSCR
20% down · 8.5% · 30yr
- Down + closing
- —
- Monthly P&I
- —
- Monthly cashflow
- —
- DSCR
- —
- Eligible?
- —
No personal income docs; deal must DSCR.
Hard money
10% down · 12.0% · 12mo
- Down + closing
- —
- Monthly P&I
- —
- Monthly cashflow
- —
- DSCR
- —
- Eligible?
- —
Short-term bridge; refi at stabilization.
Listing history 16 events
-
2026-06-18days on market $71,900 Active 38 DOM
-
2026-06-17days on market $71,900 Active 37 DOM
-
2026-06-16days on market $71,900 Active 36 DOM
-
2026-06-15days on market $71,900 Active 35 DOM
-
2026-06-13days on market $71,900 Active 33 DOM
-
2026-06-13days on market $71,900 Active 32 DOM
-
2026-06-09days on market $71,900 Active 29 DOM
-
2026-06-08days on market $71,900 Active 28 DOM
-
2026-06-07days on market $71,900 Active 27 DOM
-
2026-06-04days on market $71,900 Active 24 DOM
-
2026-06-03days on market $71,900 Active 23 DOM
-
2026-06-02days on market $71,900 Active 22 DOM
-
2026-06-01days on market $71,900 Active 21 DOM
-
2026-05-31days on market $71,900 Active 20 DOM
-
2026-05-05$71,900 Active 711-char remark
Show marketing remark (711 chars)
Refreshed Vacation Paradise! 1/4 mile from the Brookville Lake causeway. Close to the Causeway boat docks. The extra lot allows for convenient boat storage. New paint and flooring throughout. Also new HVAC & septic holding tank. You'll love relaxing in the large, enclosed porch on those rainy days! This 2-bedroom, 2 bath resort home offers full time comfort for your family and guests. Weekend or longer term lake retreat living at it's finest! * Assoc. Dues are $350 per lot and already paid for 2026. Lake Shore Resort Bylaws, Rules and Covenants can be found at https://lakeshoreresort. us/rules-and-covenants/ ______ Legal desc: Parcel #24-04-20-377-118.000-007 - Parcel #24-05-20-377-119.000-007
-
2026-05-05$71,900 Active
Show marketing remark (711 chars)
Refreshed Vacation Paradise! 1/4 mile from the Brookville Lake causeway. Close to the Causeway boat docks. The extra lot allows for convenient boat storage. New paint and flooring throughout. Also new HVAC & septic holding tank. You'll love relaxing in the large, enclosed porch on those rainy days! This 2-bedroom, 2 bath resort home offers full time comfort for your family and guests. Weekend or longer term lake retreat living at it's finest! * Assoc. Dues are $350 per lot and already paid for 2026. Lake Shore Resort Bylaws, Rules and Covenants can be found at https://lakeshoreresort. us/rules-and-covenants/ ______ Legal desc: Parcel #24-04-20-377-118.000-007 - Parcel #24-05-20-377-119.000-007
ⓘ Source: listings_history table (triggers on properties + properties_extension) + one-shot
backfill from property_details.listing_events for pre-trigger history.
Tax reassessment forecast IN · Partial reset (capped growth)
- Current annual tax
- $562 · $47/mo
- Projected year-2 tax
- $586 · $49/mo
- Expected delta
- +$25/yr (+$2/mo · 4.4%)
ⓘ Screening estimate from a state-policy table — verify with the county assessor before closing.
Climate risk First Street
- Flood 1/10 Low FEMA zone X (unshaded) · 0% chance over 30 yrs
- Wildfire 1/10 Low
- Heat 3/10 Moderate 7 d/yr ≥102°F today · 19 d/yr by 30 yrs out
- Wind 2/10 Low 100% chance of damaging wind over 30 yrs
- Air quality 2/10 Low 0 unhealthy d/yr today · 1 by 30 yrs out
Nearby sold comps map
Loading sold comps map…
Walkable amenities ~0.75 mi
Loading nearby amenities…
Taxation est. · year 1
- Rental income
- $12,126
- − Mortgage interest
- −$4,028
- − Property taxes
- −$562
- − Insurance
- −$360
- − Repairs & maintenance
- −$970
- − Management
- −$970
- − Depreciation
- −$2,092
- Taxable income
- $3,146
- Est. tax owed @ 24.0%
- −$755
- After-tax cash flow
- $3,379/yr
For passive investors: Depreciation is non-cash, so a rental often shows a tax loss while cash-flowing — sheltering income. Rental losses are passive: they offset passive income freely, and up to $25,000/yr can offset ordinary (W-2) income if you actively participate and your MAGI is under $100k (phasing out to $0 by $150k); unused losses carry forward. On sale, claimed depreciation is recaptured at up to 25%, and gains may owe capital-gains tax (a 1031 exchange can defer both). Figures are a year-1 estimate at your 24.0% rate — not tax advice; consult a CPA.
Schools (NCES district)
No district data.
Livability — Lakeshore Resort
No livability data for this city. (Only ~50 U.S. cities are tracked.)
Census & demographics
- Census place
- Lakeshore Resort, IN
- Population (ZIP)
- 10,891
Population outlook (Franklin County) Hauer SSP2
- Today (2025)
- 22,796 people
- By 2030
- 22,556 · -1.1%
- By 2040
- 21,762 · -4.5%
- By 2050
- 20,575 · -9.7%
- By 2075
- 17,810 · -21.9%
- By 2100
- 13,698 · -39.9%
Race, ethnicity, and origin ACS 2023
- Neighborhood character
- Predominantly White (96%)
- Race & ethnicity
- White 96% Two or more races 2% Hispanic / Latino 2%
- Common ancestry
- Slovak 2% Italian 1% Romanian 1%
- Foreign-born
- 2% · Vietnam, Canada
- Languages at home
- 96% English-only · Korean 2% Vietnamese 1% Russian/Polish/Slavic 1%
Political lean MEDSL · Franklin
- 2024 margin
- Solid R (+64.4) · D 17.1% · R 81.5% · Other 1.3%
- 2008→2024 swing
- -30.3pp toward R · 2008: -34.1pp · 2024: -64.4pp
- All cycles
- 2024: R+64.4 2020: R+63.0 2016: R+60.9 2012: R+42.8 2008: R+34.1
Not yet ingested
- Civics
- —
Market trends
- HPI YoY
- ▼ -82.81%
- Current HPI
- 223.2183
- Rent YoY
- —
- Metro
- —
- State GDP YoY
- ▲ 2.90%
- F500 in state
- 18
Industry mix (Fortune 500 HQ in IN)
| Industry | F500 HQs | Revenue |
|---|---|---|
| Industrial Machinery | 2 | $37B |
|
||
| Healthcare | 1 | $177B |
|
||
| Pharmaceuticals | 1 | $45B |
|
||
| Metals / Steel | 1 | $18B |
|
||
| Agriculture | 1 | $17B |
|
||
| Packaging | 1 | $12B |
|
||
Price history
+0.0% since first listed2 events — show timeline
- 2026-05-05 Listed $71,900 ECIAOR
- 2026-05-05 Listed $71,900 RRELMS
Property tax history
+7.6%/yrLatest (2024): $562 · -2.9% YoY. Source: county tax records.
Cash-flow waterfall
monthlySold comps — $/sqft
last 12 mo · ≤1 miLoading sold comps…