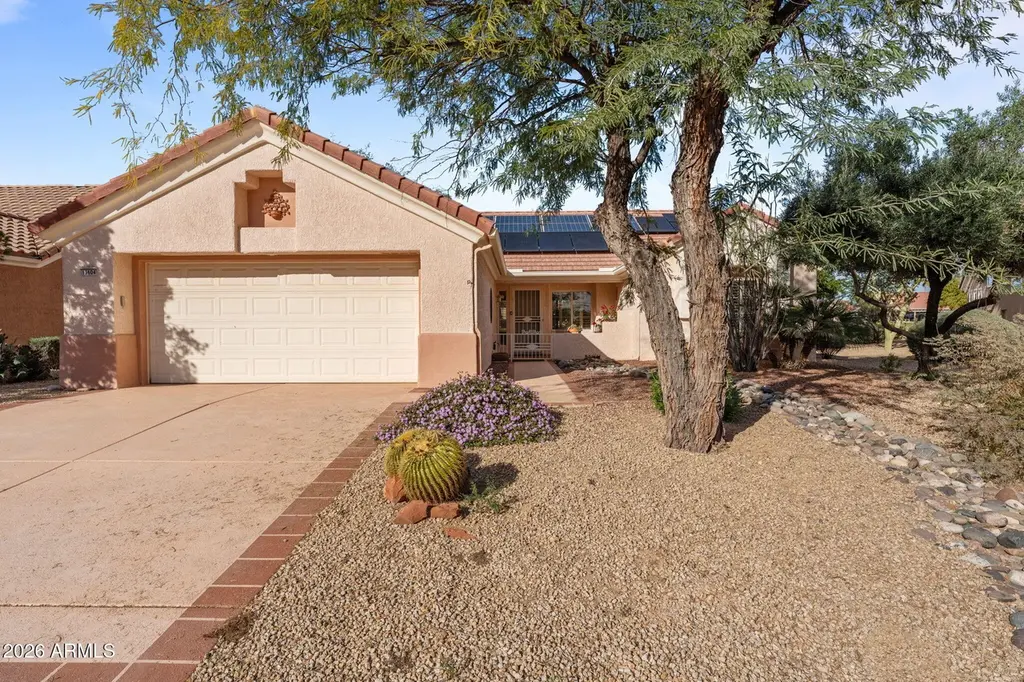
13604 W Robertson Dr · Sun City West, AZ
Flood risk 1/10 · Minimal
- FEMA flood zone
- X (shaded)
- Chance of flooding over 30 yrs
- 0.0%
- Est. flood insurance / yr
- $507 – $1,088
Fire risk 4/10 · Minor
- Est. fire insurance / yr
- $610 – $1,132
Heat risk 9/10 · Severe
- Hot days now (above 113°F)
- 5 days/yr
- Hot days in 30 yrs
- 12 days/yr
Wind risk 1/10 · Minimal
- Chance of severe wind over 30 yrs
- —
Air-quality risk 2/10 · Minimal
- Unhealthy air days now
- 1 days/yr
- Unhealthy air days in 30 yrs
- 1 days/yr
Risk factors via First Street. Map © Google.
Why this score? — see what drove the D grade
The composite is a weighted blend of 9 inputs, each scored 0–100. Each bar is that input's sub-score; the figure is the points it added to the 100-point composite (weight × sub-score).
- ARV discount +11.0/15.0
- Cash flow +10.7/30.0
- Rent growth +4.3/5.0
- Schools +3.5/10.0
- Livability +3.2/5.0
- DSCR +3.1/10.0
- 1% rule +2.8/10.0
- Condition / age +2.5/5.0
- Appreciation +0.0/10.0
$395,000
🖨 Deal sheet (PDF) 📄 Offer letter ✓ Due diligence
Listing remarks MLS
BIG PRICE REDUCTION!! FRESH NEW PAINT. NICE AND BRIGHT INSIDE. VERY CLEAN.WELCOME TO THIS 1,537 sq ft PAYSON MODEL NESTLED IN THE EXPANSION AREA OF SUN CITY WEST ON THE 15th TEE BOX OF DEER VALLEY GOLF COURSE. GOLF CART PATH IS ON THE OPPOSITE SIDE OF THE FAIRWAY. THIS HOME BOASTS PLANTATION SHUTTERS THROUGH-OUT, TWO CAR GARAGE, PATIOS IN BOTH THE FRONT OF THE HOME AS WELL AS THE BACK TO ENJOY YOUR MORNING COFFEE OR A NICE GLASS OF WINE IN THE EVENING. THIS MODEL OFFERS THE SPLIT BEDROOM CONCEPT PROVIDING THE PRIVACY FOR FAMILY AND FRIENDS. COME AND MAKE THIS HOME THE ENVY OF THE BLOCK!
Key facts
- 7,475 sq ft lot
- 2 garage spots
- Community pool
Neighborhood map
What this means for you Summary
Snapshot
- This is a 2-bed/3.0-bath single-family listed at $395k.
Deal economics
- At list price, monthly cash flow is $-186 ($-2k/yr) — negative.
- To cash-flow at today's rent, offer at most $362k (8.3% below list).
- To meet the 1% rule (rent ≥ 1% of price), the offer needs to be $307k (22.3% below list).
- Recommended offer: $307k (22.3% below list) — sets the bar for 1% rule.
- Cap rate 5.7% vs local median 4.1% in Sun City West — top-decile yield for the area; either an underpriced asset or a hidden risk that comps aren't pricing in. Stress-test before assuming the spread holds.
Location & tenants
- Location reads 63/100 on livability (#106 in AZ) — a middle-class / working-renter tenant base. Strengths: housing A+, crime B, cost of living B; Watch: schools D+, health & safety D, amenities F.
- Peoria Unified School District (4237) (suburban): math 36% / reading 42% proficiency, ranked #64 of 249 in AZ (top 26%) — families likely to look elsewhere, expect single-tenant / working-renter base with shorter leases.
- Market conditions: Rents rising fast (+7.0%/yr); 125 active listings in the ZIP; 18 comparable units currently listed for rent nearby; rentals at typical pace (median 23d on market — plan ~3-4 weeks tenant-placement turnaround); 36,011 units permitted in Maricopa County in 2024 (12,801 in 5+ unit buildings).
- At $3,068/mo this rent would consume 58% of the median local household income ($64k/yr) (locally 691% of renters already pay >50% of income on rent) — very limited rent-growth headroom before tenants either downsize or default.
Forward outlook
- Local home prices are declining (-3.0%/yr); year-one equity from $3k of loan paydown is wiped out by about $12k of value loss. Plan a longer hold.
- Maricopa County population projected at +38% by 2050 — long-run rental-demand tailwind backs the buy-and-hold thesis.
Negotiation context
- It's been on market 143 days — a 12% lower offer ($348k) is reasonable based on typical stale-listing flexibility.
- 2 sale attempts; this cycle's ask has dropped $25k (6%) from the opening price — seller is motivated, your offer sets the floor, not the list.
- Current owner paid $177k; list at $395k implies a 123% gain — meaningful room to come down on a strong offer.
Risks & watch-outs
- Climate carrying-cost: extreme-heat days projected 5→12/yr by 2055 (HVAC capex compounding) — expect insurance premiums to compound above CPI over the hold.
Questions for the listing agent
- What do current leases actually rent for vs. the listed asking? Can we see a recent rent roll and the last 12 months of T-12 income?
- It's been on market 143 days. Have you received any prior offers? Is the seller open to a 22% concession, seller financing, or rate buy-down credit?
- What does the HOA fee cover, when was the last increase, and are there any pending special assessments or reserve-fund shortfalls?
- Why hasn't it sold? Are there any deal-killer items the seller is aware of (foundation, flood, title, zoning, code violations)?
- Is there a deadline driving the sale (1031 exchange, divorce, estate, relocation)? That informs how much negotiation room exists.
- Schools are D-rated, which usually means shorter tenancies and higher turnover. Who's the typical renter profile here, and what's been the actual vacancy rate?
- The area grade is low — what's the realistic commute time and amenity access for the typical tenant pool here? Any planned neighborhood developments (good or bad) we should know about?
- What's the average days-on-market for RENTAL listings here right now (not sales)? A rising rental-DOM trend means longer vacancies and softer asking-rent achievability than the comps imply.
- What's the recent tenant-quality profile in this submarket — average credit score on applications, eviction rate, late-payment / NSF rate, and stable-employment percentage? A property-management company in the area should have these aggregated.
- How much new for-sale + rental construction is in the pipeline within 1–3 miles? Heavy new supply typically softens prices + rents 12–24 months out; constrained supply supports both.
Investment metrics
- 1% rule
- 0.78% ✗
- Cap rate
- 5.73%
- Cash-on-cash
- -2.02%
- DSCR
- 0.91
- GRM
- 10.7
CMA / ARV
- ARV (median comp)
- $428,186
- List price
- $395,000
- Delta
- -7.75%
- Verdict
- FAIR
- Comps
- 20 within 1.0 mi
Show comp detail 12 sales within ~0.75 mi
| Address | Dist | Beds/Ba | Sqft | Sold | Price | $/sf | Match |
|---|---|---|---|---|---|---|---|
| 22811 N Wagon Wheel Dr | 0.13mi | 2/2.0 | 1,653 (+8%) | 1mo | $449,000 | $272 | 76 |
| 22803 N Wagon Wheel Dr | 0.13mi | 2/2.0 | 1,404 (-9%) | 3mo | $353,600 | $252 | 73 |
| 13938 W Rico Dr | 0.49mi | 2/2.0 | 1,547 (+1%) | 2mo | $350,000 | $226 | 71 |
| 13734 W Via Tercero -- | 0.25mi | 2/2.0 | 1,669 (+9%) | 2mo | $458,000 | $274 | 68 |
| 13448 W Chapala Ct | 0.21mi | 2/2.0 | 1,684 (+10%) | 2mo | $398,000 | $236 | 68 |
| 13766 W Junipero Dr | 0.44mi | 3/3.0 (+1) | 1,625 (+6%) | 2mo | $405,000 | $249 | 64 |
| 13836 W Via Tercero -- | 0.37mi | 2/2.0 | 1,371 (-11%) | 4mo | $355,000 | $259 | 58 |
| 22303 N Montecito Ave | 0.40mi | 2/2.0 | 1,351 (-12%) | 2mo | $360,000 | $266 | 55 |
| 14022 W Via Tercero -- | 0.58mi | 2/2.0 | 1,653 (+8%) | 3mo | $395,000 | $239 | 54 |
| 13760 W Pecos Ln | 0.46mi | 2/2.0 | 1,762 (+15%) | 4mo | $405,000 | $230 | 47 |
| 13126 W Junipero Dr | 0.73mi | 2/2.0 | 1,378 (-10%) | 1mo | $362,000 | $263 | 44 |
| 22510 N Mirage Ln N | 0.70mi | 2/2.0 | 1,336 (-13%) | 3mo | $330,000 | $247 | 39 |
Match score weights: distance 35% · size 25% · config 20% · recency 20%. Top-matched comps best support the ARV.
Projected returns pro-forma
-3.0% appreciation · 7.03% rent growth · sell at horizon
- IRR
- -15.4%
- Equity multiple
- 0.43×
- Total profit
- $-62,929
- Equity at exit
- $58,896
- IRR
- -1.4%
- Equity multiple
- 0.89×
- Total profit
- $-12,423
- Equity at exit
- $34,152
Cash invested: $110,600 (down + closing). Projections, not guarantees.
Landlord ↔ Tenant lean methodology
- Overall (STATE)
- 87 Strongly Landlord-Friendly
- State Arizona
- 87 Strongly Landlord-Friendly · R+3
- County
- — inherits STATE
- City
- — inherits STATE
ZIP-level market 85375
- Rents YoY
- 7.0%
- Active inventory
- 125
- Price-to-rent
- 10.7×
Monthly cashflow live
- Estimated rent
- $3,068 high interval (Pro) →
- Mortgage (P&I)
- −$2,071
- Tax from tax record
- −$244 /mo · $2,928/yr
- Insurance
- −$165
- HOA
- −$130
- Vacancy / Maint / Mgmt
- −$644
- Net cashflow
- $-186
Break-even live
Sensitivity live
| Price | -10% $38 | -5% $-74 | +0% $-186 | +5% $-298 | +10% $-410 |
|---|---|---|---|---|---|
| Rent | -10% $-428 | -5% $-307 | +0% $-186 | +5% $-65 | +10% $57 |
| Rate | -1.0pp $13 | -0.5pp $-85 | base $-186 | +0.5pp $-288 | +1.0pp $-392 |
UW: 25.0% down · 7.5% · 30yr · 1.5% tax · 5.0% vac · 8.0% maint · 8.0% mgmt
Financing live
Cash to close
- Down payment
- $98,750
- Closing costs
- $11,850
- Reserves months
- —
- Total cash needed
- —
Loan-product check · same deal, 3 products live
Conventional
25% down · 7.5% · 30yr
- Down + closing
- —
- Monthly P&I
- —
- Monthly cashflow
- —
- DSCR
- —
- Eligible?
- —
Personal DTI + credit; lowest rate.
DSCR
20% down · 8.5% · 30yr
- Down + closing
- —
- Monthly P&I
- —
- Monthly cashflow
- —
- DSCR
- —
- Eligible?
- —
No personal income docs; deal must DSCR.
Hard money
10% down · 12.0% · 12mo
- Down + closing
- —
- Monthly P&I
- —
- Monthly cashflow
- —
- DSCR
- —
- Eligible?
- —
Short-term bridge; refi at stabilization.
Rent comps 18 comps
| Address | Beds | Baths | Sqft | Rent | $/sqft | DOM | Units | Dist |
|---|---|---|---|---|---|---|---|---|
| 13714 W Caballero Dr Sun City West, AZ | 2.0 | 2.0 | 1794 | $2,800 | $1.56 | 2d | 1 | 0.14mi |
| 22816 N Las Positas Dr Sun City West, AZ | 2.0 | 2.0 | 1351 | $4,500 | $3.33 | 2d | 1 | 0.19mi |
| 13452 W El Sueno Ct Sun City West, AZ | 2.0 | 2.0 | 1378 | $3,200 | $2.32 | 2d | 1 | 0.27mi |
| 13758 W Sola Dr Sun City West, AZ | 2.0 | 1.5 | 1351 | $3,950 | $2.92 | 2d | 1 | 0.28mi |
| 13428 W El Sueno Ct Sun City West, AZ | 2.0 | 2.0 | 1812 | $2,850 | $1.57 | 2d | 1 | 0.29mi |
| 22212 N Cheyenne Dr Sun City West, AZ | 2.0 | 2.0 | 1669 | $3,500 | $2.10 | 20d | 1 | 0.35mi |
| 13755 W Nogales Dr Sun City West, AZ | 2.0 | 1.5 | 1660 | $4,500 | $2.71 | 44d | 1 | 0.36mi |
| 13706 W Parada Dr Sun City West, AZ | 3.0 | 2.0 | 2147 | $3,600 | $1.68 | 44d | 1 | 0.59mi |
| 14113 W Robertson Dr Sun City West, AZ | 2.0 | 1.5 | 1410 | $3,800 | $2.70 | 44d | 1 | 0.62mi |
| 22520 N Via de la Caballa Sun City West, AZ | 2.0 | 2.0 | 1438 | $3,400 | $2.36 | 17d | 1 | 0.72mi |
| 12944 W Quinto Dr Sun City West, AZ | 3.0 | 2.0 | 2095 | $3,200 | $1.53 | 44d | 1 | 0.78mi |
| 14234 W Via Tercero Sun City West, AZ | 2.0 | 2.0 | 1653 | $2,500 | $1.51 | 44d | 1 | 0.86mi |
| 12835 W Chapala Ct Sun City West, AZ | 2.0 | 2.0 | 2095 | $4,000 | $1.91 | 25d | 1 | 0.96mi |
| 12910 W Junipero Dr Sun City West, AZ | 2.0 | 2.0 | 1636 | $1,800 | $1.10 | 13d | 1 | 0.97mi |
| 14608 W Horizon Dr Sun City West, AZ | 2.0 | 2.0 | 1778 | $2,000 | $1.12 | 44d | 1 | 1.25mi |
| 23134 N 126th Dr Sun City West, AZ | 3.0 | 3.0 | 1878 | $2,131 | $1.13 | 6d | 1 | 1.26mi |
| 14759 W Gunsight Dr Sun City West, AZ | 2.0 | 2.0 | 1348 | $1,699 | $1.26 | 44d | 1 | 1.45mi |
| 14759 W Gunsight Dr Sun City West, AZ | 2.0 | 2.0 | 1348 | $1,599 | $1.19 | 22d | 1 | 1.45mi |
HOA detail
- Monthly dues
- $130 · $1,560/yr
Listing history 23 events
-
2026-06-21days on market $395,000 Active 143 DOM
-
2026-06-18days on market $395,000 Active 140 DOM
-
2026-06-17remarks 623-char remark
-
2026-06-17days on market $395,000 Active 139 DOM
-
2026-06-16days on market $395,000 Active 138 DOM
-
2026-06-15days on market $395,000 Active 137 DOM
-
2026-06-13days on market $395,000 Active 135 DOM
-
2026-06-13days on market $395,000 Active 134 DOM
-
2026-06-09days on market $395,000 Active 131 DOM
-
2026-06-08days on market $395,000 Active 130 DOM
-
2026-06-07days on market $395,000 Active 129 DOM
-
2026-06-04days on market $395,000 Active 126 DOM
-
2026-06-03days on market $395,000 Active 125 DOM
-
2026-06-02days on market $395,000 Active 124 DOM
-
2026-06-01days on market $395,000 Active 123 DOM
-
2026-05-31days on market $395,000 Active 122 DOM
-
2026-05-04price $395,000 595-char remark
Show marketing remark (595 chars)
BIG PRICE REDUCTION!! FRESH NEW PAINT. NICE AND BRIGHT INSIDE. VERY CLEAN.WELCOME TO THIS 1,537 sq ft PAYSON MODEL NESTLED IN THE EXPANSION AREA OF SUN CITY WEST ON THE 15th TEE BOX OF DEER VALLEY GOLF COURSE. GOLF CART PATH IS ON THE OPPOSITE SIDE OF THE FAIRWAY. THIS HOME BOASTS PLANTATION SHUTTERS THROUGH-OUT, TWO CAR GARAGE, PATIOS IN BOTH THE FRONT OF THE HOME AS WELL AS THE BACK TO ENJOY YOUR MORNING COFFEE OR A NICE GLASS OF WINE IN THE EVENING. THIS MODEL OFFERS THE SPLIT BEDROOM CONCEPT PROVIDING THE PRIVACY FOR FAMILY AND FRIENDS. COME AND MAKE THIS HOME THE ENVY OF THE BLOCK!
-
2026-05-02status Active 595-char remark
Show marketing remark (595 chars)
BIG PRICE REDUCTION!! FRESH NEW PAINT. NICE AND BRIGHT INSIDE. VERY CLEAN.WELCOME TO THIS 1,537 sq ft PAYSON MODEL NESTLED IN THE EXPANSION AREA OF SUN CITY WEST ON THE 15th TEE BOX OF DEER VALLEY GOLF COURSE. GOLF CART PATH IS ON THE OPPOSITE SIDE OF THE FAIRWAY. THIS HOME BOASTS PLANTATION SHUTTERS THROUGH-OUT, TWO CAR GARAGE, PATIOS IN BOTH THE FRONT OF THE HOME AS WELL AS THE BACK TO ENJOY YOUR MORNING COFFEE OR A NICE GLASS OF WINE IN THE EVENING. THIS MODEL OFFERS THE SPLIT BEDROOM CONCEPT PROVIDING THE PRIVACY FOR FAMILY AND FRIENDS. COME AND MAKE THIS HOME THE ENVY OF THE BLOCK!
-
2026-04-16status Pending 595-char remark
Show marketing remark (595 chars)
BIG PRICE REDUCTION!! FRESH NEW PAINT. NICE AND BRIGHT INSIDE. VERY CLEAN.WELCOME TO THIS 1,537 sq ft PAYSON MODEL NESTLED IN THE EXPANSION AREA OF SUN CITY WEST ON THE 15th TEE BOX OF DEER VALLEY GOLF COURSE. GOLF CART PATH IS ON THE OPPOSITE SIDE OF THE FAIRWAY. THIS HOME BOASTS PLANTATION SHUTTERS THROUGH-OUT, TWO CAR GARAGE, PATIOS IN BOTH THE FRONT OF THE HOME AS WELL AS THE BACK TO ENJOY YOUR MORNING COFFEE OR A NICE GLASS OF WINE IN THE EVENING. THIS MODEL OFFERS THE SPLIT BEDROOM CONCEPT PROVIDING THE PRIVACY FOR FAMILY AND FRIENDS. COME AND MAKE THIS HOME THE ENVY OF THE BLOCK!
-
2026-01-13$420,000 Active 595-char remark
Show marketing remark (595 chars)
BIG PRICE REDUCTION!! FRESH NEW PAINT. NICE AND BRIGHT INSIDE. VERY CLEAN.WELCOME TO THIS 1,537 sq ft PAYSON MODEL NESTLED IN THE EXPANSION AREA OF SUN CITY WEST ON THE 15th TEE BOX OF DEER VALLEY GOLF COURSE. GOLF CART PATH IS ON THE OPPOSITE SIDE OF THE FAIRWAY. THIS HOME BOASTS PLANTATION SHUTTERS THROUGH-OUT, TWO CAR GARAGE, PATIOS IN BOTH THE FRONT OF THE HOME AS WELL AS THE BACK TO ENJOY YOUR MORNING COFFEE OR A NICE GLASS OF WINE IN THE EVENING. THIS MODEL OFFERS THE SPLIT BEDROOM CONCEPT PROVIDING THE PRIVACY FOR FAMILY AND FRIENDS. COME AND MAKE THIS HOME THE ENVY OF THE BLOCK!
-
1999-01-19soldstatus $177,000
-
1997-07-01soldstatus $175,000
-
1994-03-16soldstatus $164,948
ⓘ Source: listings_history table (triggers on properties + properties_extension) + one-shot
backfill from property_details.listing_events for pre-trigger history.
Tax reassessment forecast AZ · Resets to sale price
- Current annual tax
- $2,928 · $244/mo
- Projected year-2 tax
- $2,928 · $244/mo
- Expected delta
- $0/yr ($0/mo · 0.0%)
ⓘ Screening estimate from a state-policy table — verify with the county assessor before closing.
Climate risk First Street
- Flood 1/10 Low FEMA zone X (shaded) · 0% chance over 30 yrs
- Wildfire 4/10 Moderate
- Heat 9/10 Extreme 5 d/yr ≥113°F today · 12 d/yr by 30 yrs out
- Wind 1/10 Low
- Air quality 2/10 Low 1 unhealthy d/yr today · 1 by 30 yrs out
Nearby sold comps map
Loading sold comps map…
Walkable amenities ~0.75 mi
Loading nearby amenities…
Taxation est. · year 1
- Rental income
- $36,822
- − Mortgage interest
- −$22,126
- − Property taxes
- −$2,928
- − Insurance
- −$1,975
- − Repairs & maintenance
- −$2,946
- − Management
- −$2,946
- − HOA
- −$1,560
- − Depreciation
- −$11,491
- Taxable loss
- −$9,150
- Est. tax savings @ 24.0%
- +$2,196
- After-tax cash flow
- $-35/yr
For passive investors: Depreciation is non-cash, so a rental often shows a tax loss while cash-flowing — sheltering income. Rental losses are passive: they offset passive income freely, and up to $25,000/yr can offset ordinary (W-2) income if you actively participate and your MAGI is under $100k (phasing out to $0 by $150k); unused losses carry forward. On sale, claimed depreciation is recaptured at up to 25%, and gains may owe capital-gains tax (a 1031 exchange can defer both). Figures are a year-1 estimate at your 24.0% rate — not tax advice; consult a CPA.
Schools (NCES district)
- District
- Peoria Unified School District (4237)
- NCES district ID
- 0406250
- Math proficiency
- 36% ▼ -14.00%
- Reading proficiency
- 42% ▼ -8.00%
- Median HH income
- $60,171
- Composite
- 34.62/100
- National rank
- #5152
- State rank
- #64 of 249 in AZ
Livability — Sun City West
- Score
- 63/100
- State rank
- #106
- US rank
- #14878
Category grades
Schools grade is shown separately in the Schools card above.
Census & demographics
- Census place
- Sun City West, AZ
- County
- Maricopa County · 4,537,380 people
- City population
- 27,680
- Metro
- Phoenix-Mesa-Chandler, AZ
- Population (ZIP)
- 27,680
- Household income
- $63,928
- Rent vs Own
- Severe rent burden
- 691.0
Population outlook (Maricopa County) Hauer SSP2
- Today (2025)
- 4,979,203 people
- By 2030
- 5,378,229 · +8.0%
- By 2040
- 6,156,598 · +23.6%
- By 2050
- 6,872,376 · +38.0%
- By 2075
- 8,401,270 · +68.7%
- By 2100
- 9,247,439 · +85.7%
Race, ethnicity, and origin ACS 2023
- Neighborhood character
- Predominantly White (94%)
- Race & ethnicity
- White 94% Two or more races 2% Hispanic / Latino 1% Asian 1%
- Common ancestry
- Romanian 5% Portuguese 5% Lithuanian 4%
- Foreign-born
- 4% · Canada
- Languages at home
- 96% English-only · Spanish 2% Russian/Polish/Slavic 1%
Political lean MEDSL · Maricopa
- 2024 margin
- Toss-up / Even · D 47.7% · R 51.2% · Other 1.1%
- 2008→2024 swing
- +7.1pp toward D · 2008: -10.6pp · 2024: -3.5pp
- All cycles
- 2024: R+3.5 2020: D+2.2 2016: R+3.5 2012: R+12.0 2008: R+10.6
Not yet ingested
- Civics
- —
Market trends
- HPI YoY
- ▼ -140.20%
- Current HPI
- 239.3422
- Rent YoY
- ▲ 7.03%
- Metro
- Phoenix-Mesa-Chandler, AZ
- State GDP YoY
- ▲ 4.54%
- F500 in state
- 20
Industry mix (Fortune 500 HQ in AZ)
| Industry | F500 HQs | Revenue |
|---|---|---|
| Technology | 2 | $13B |
|
||
| Mining / Metals | 1 | $23B |
|
||
| Environmental Services | 1 | $16B |
|
||
| Metals / Steel | 1 | $14B |
|
||
| Technology Distribution | 1 | $9B |
|
||
| Homebuilding | 1 | $8B |
|
||
Price history
+139.5% since first listed7 events — show timeline
- 2026-05-04 Price Changed $395,000 ARMLS
- 2026-05-02 Relisted — ARMLS
- 2026-04-16 Pending — ARMLS
- 2026-01-13 Listed $420,000 ARMLS
- 1999-01-19 Sold (Public Records) $177,000 Public Records
- 1997-07-01 Sold (Public Records) $175,000 Public Records
- 1994-03-16 Sold (Public Records) $164,948 Public Records
Property tax history
+3.0%/yrLatest (2025): $2,928 · +4.2% YoY. Source: county tax records.
Cash-flow waterfall
monthlySold comps — $/sqft
last 12 mo · ≤1 miLoading sold comps…